Involvement of FAK-mediated BMP-2/Smad pathway in mediating osteoblast adhesion and differentiation on nano-HA/chitosan composite coated titanium implant under diabetic conditions
Xiang-Yu
Ma†
abc,
Ya-Fei
Feng†
c,
Tian-Sheng
Wang†
b,
Wei
Lei
 c,
Xiang
Li
d,
Da-Peng
Zhou
a,
Xin-Xin
Wen
bc,
Hai-Long
Yu
a,
Liang-Bi
Xiang
 *a and
Lin
Wang
*ce
aDepartment of Orthopedics, General Hospital of Shenyang Military Area Command of Chinese PLA, Shenyang, Liaoning 110016, China. E-mail: xiangliangbi1963@sina.com
bDepartment of Orthopedics of the 463 Hospital of PLA, Shenyang, Liaoning 110042, China
cDepartment of Orthopedics, Xijing Hospital, Fourth Military Medical University, Xi'an, Shaanxi 710032, China. E-mail: wanglinxj@fmmu.edu.cn
dSchool of Mechanical Engineering, Shanghai Jiao Tong University, State Key Laboratory of Mechanical System and Vibration, Shanghai, 200240, China
eDepartment of Orthopedics, The First Affiliated Hospital of Xi'an Jiao Tong University, Xi'an, Shaanxi 710061, China
First published on 7th November 2017
Abstract
Chitosan (CS)-based hydroxyapatite (HA) composites have emerged as a novel strategy for promoting bone regeneration. Here nanophase HA/CS composite coated porous titanium implants (nCT) were fabricated and their biological behavior under diabetic conditions was investigated. We proposed that the focal adhesion kinase (FAK)-mediated BMP-2/Smad pathway played a role in mediating the promotive effect of nCTs on osteoblast adhesion and differentiation under diabetes-induced high reactive oxygen species (ROS) condition. To confirm the hypothesis, rat osteoblasts on bare titanium implants (Ti) and nCT were subjected to normal serum (NS), diabetic serum (DS), DS + NAC (a potent ROS inhibitor) and DS + cytochalasin D (an actin polymerization inhibitor). In vivo on diabetic sheep implanted with Ti or nCT showed that diabetes-induced ROS overproduction impaired osteoblast adhesion, evidenced by immunostaining of F-actin and vinculin and morphological observation through inhibition of FAK phosphorylation, which contributed to suppressed BMP-2-dependent Smad1/5/8 phosphorylation. nCT substrate reactivated the FAK-BMP-2/Smad pathway, thus reversing osteoblast dysfunction, which exerted a similar effect to NAC treatment on Ti. These effects were further confirmed by improved osteointegration within nCT in diabetic sheep, evidenced by micro-CT and histological examinations. Our study demonstrated that reactivation of the FAK-BMP-2/Smad pathway was involved in improving osteoblast adhesion and differentiation by nano-HA/CS composite coating, potentially directing biomaterial modification and biofunctionalization under diabetic conditions.
1. Introduction
Despite the extensive use of titanium implants due to their excellent mechanical properties and biocompatibility, osteointegration of implants in medically compromised patients such as diabetics still remains a challenge.1,2 Several plausible mechanisms responsible for the disorder have been proposed, one of which is the pathological condition-induced increase in oxidative stress in the absence of endogenous antioxidants.3,4 Our previous study has demonstrated that ROS overproduction under diabetic conditions contributed to osteoblast dysfunction occurring at the bone–titanium interface, eventually leading to impaired osteointegration.5 However, the underlying molecular mechanisms have not been clearly identified yet. Another previous study from our lab has indicated that diabetes also inactivated the Wnt/β-catenin pathway in osteoblasts on the titanium surface, which is an important regulator of cellular attachment. Thus, it retards the following osteoblast functions and eventual osteointegration.6 The above findings provide us rationales to investigate whether diabetes-induced ROS overproduction directly contributes to impaired osteoblast adhesion, thus leading to osteoblastic dysfunction at the bone–titanium interface, as well as to explore molecular mechanisms.Cell adhesion is a critical process in the interaction of cells with materials and controls cell survival, migration, proliferation and differentiation.7 Adhesion formation is an integrin-dependent process, which mediates cell–substrate signaling through activation of intracellular focal adhesion kinase (FAK) and phosphatase signal to trigger downstream biochemical signaling pathways.8,9 Previous study has demonstrated that FAK activation via focal adhesion formation is essential for BMP action in terms of stimulating osteoblastic markers.10 It is known that the action of the canonical BMP signaling pathway through Smad-dependent pathways11 plays a critical role in bone development and regeneration.12 In diabetic animals, osteogenesis suppression is directly associated with decreased expression of BMP-induced transcription factors such as Runx2, Osterix and ALP.13 Interestingly, the expression of BMP-2, the critical regulator of osteoblastogenesis in BMP family, is generally discovered to not alter.13–15 Since FAK is involved in both maintenance of cellular adhesion onto the substrate and BMP action for osteogenic differentiation,10 we speculate that FAK inhibition resulting from diabetes-induced ROS overproduction may act as a critical factor in suppressed differentiation potential of osteoblasts at the bone–titanium interface and hence explore therapeutic strategies associated with adhesion improvement.
In recent years, a variety of chitosan-based hydroxyapatite (CS/HA) biocomposites have been used as scaffolding and surface modification biomaterials in bone tissue engineering, and CS/HA has been proved to exhibit excellent biocompatibility and osteoconductivity.16–18 CS is widely used to modify surface properties of implant materials for enhancing osteoblast attachment19 owing to its minimal foreign body reaction, suitable degradation rate and favorable wettability,20 especially in titanium surface modification.21 Excellent osteoconductivity and chemical and biological affinity with bony tissue are regarded as advantages of HA,22 on which cell adhesion is more enhanced than on titanium substrate.23,24 Moreover, on nanophase HA, a greater concentration of adhesion-beneficial serum proteins are adsorbed than on conventional HA.25 Nano-HA/CS scaffolds have been reported to facilitate cell adhesion and improve osteoblastic differentiation through integrin-mediated signaling cascades and the downstream BMP/Smad pathway.12 Nonetheless, the application of nano-HA/CS composite under diabetic conditions has been rarely investigated.
In the present study, we deposited nano-HA/CS composite onto the surface of porous titanium implants as improved bio-coating to fabricate nano-composite coated titanium implants (nCT). Based on the above-mentioned viewpoints, we investigated the role of FAK along with its downstream BMP-2/Smad signaling pathway on osteoblast adhesion and differentiation and the beneficial effect of nCT on FAK-BMP-2/Smad reactivation for eventually improved osteointegration under diabetes-induced high ROS condition.
2. Materials and methods
2.1 Implant preparation
Porous Ti6Al4V frameworks (Ti) were designed by a commercially computer-aided design (CAD) software and fabricated using electron beam melting (EBM), as described previously.26 The nCT were fabricated by the lyophilization method similar with a previous description.6 Briefly, 0.8 g nanophase HA powder was added into chitosan solution (1 g chitosan dissolved in 98 ml 0.2 M acetic acid). After stirring at 50 °C for 2 h, the homogeneous nano-HA/CS composite solution was casted into the Ti framework. The Ti framework/composite solution specimens were frozen at −20 °C for 12 h and lyophilized at −80 °C overnight. After immersing in 0.05 M NaOH for equilibrating about 10 min and freeze-drying again, the nCT were finally fabricated. A scanning electron microscope (SEM, S-4800, Hitachi, Japan) was utilized to observe the microstructure of Ti and nCT.2.2 Ethics statement
The animal experimental protocol including both in vitro and in vivo experiments was approved by the Fourth Military Medical University Committee on Animal Care (Permit Number: 14012). The animal experiments were performed in accordance with the National Institutes of Health Guidelines for the Use of Laboratory Animals.2.3 Osteoblast isolation and culture
Primary rat osteoblasts were obtained by digestion of the calvarial bone of neonatal Sprague-Dawley rats using enzymatic isolation method as described.27 Briefly, after the calvaria tissue was extracted and digested with 0.5% trypsin for 15 min at 37 °C, and the calvarial fragments were transferred to a culture flask and cultured in DMEM (Invitrogen, CA, USA) containing 10% fetal bovine serum in a humidified atmosphere of 5% CO2/95% air at 37 °C. Osteoblasts between the third and fifth passages were seeded on the implants with a density of 5 × 10⁵ cells per ml and randomized to incubate with one of the following factors: (1) Ti + normal serum (NS); (2) Ti + diabetic serum (DS); (3) nCT + DS; (4) Ti + DS + n-acetyl-cysteine (NAC, a potent ROS inhibitor, 20 mmol L−1; Sigma, MO);28 and (5) nCT + DS + cytochalasin D (an actin polymerization inhibitor that has been shown to cause downstream FAK phosphorylation inhibition).29 DS was acquired from diabetic rats that were induced by injecting STZ (40 mg kg−1, Sigma, MO) intravenously for 5 consecutive days and confirmed with a blood glucose level higher than 300 mg dl−1 15 days post-first injection as described previously.302.4 Detection of ROS production and antioxidant activity
ROS production in osteoblasts was evaluated by detection of DCF fluorescence intensity and H2O2 amount. DCF fluorescence was detected first after 7 days of incubation. The osteoblasts harvested from each group were incubated with DCDHF-DA solution (Sigma, St Louis, MO) in the culture medium at 37 °C for 30 min. After washing three times with PBS, the osteoblasts were added with H2O2-containing medium. After incubation for 1 h once more, DCF fluorescence was detected with excitation at 485 nm and emission at 528 nm using a spectrophotometer (Bio-tek, Germany). The intracellular DCF fluorescence in the TI + NS group was set as 1 and the relative levels of fluorescence in other groups were calculated. Oxidative stress was further assayed by evaluating H2O2 amount from the culture supernatant with Amplex Red assay (Molecular Probes, Invitrogen, CA) according to the manufacturer's instructions. The fluorescence intensity was recorded using a 530 nm excitation filter and a 590 nm emission filter in the spectrophotometer. Known amounts of H2O2 were added with the reactants of Amplex Red and horseradish peroxidase to obtain a standard curve.SOD activity was evaluated after incubation for 7 days; the osteoblasts on the implants were lysed with Tris-HCl (10 mM) containing 0.5% Triton X-100, 0.1 mM EDTA and 1 mM PMSF on ice for 10 min. SOD activity assay was performed to measure enzyme activity by following the manufacturer's instructions. The assay measured total SOD activity and enzyme activity was normalized to the protein content determined using a BCA protein assay kit (Pierce, America). The relative levels of SOD activity for each group were calculated and expressed as % of control.
2.5 Western blot assay
The expressions of phosphorylated FAK (p-FAK), BMP-2, and p-Smad1/5/8 were determined by western blot analysis. After incubation for 7 days, osteoblasts on the implants were harvested and lysed with RIPA buffer. After the lysates were centrifuged at 12![[thin space (1/6-em)]](https://www.rsc.org/images/entities/char_2009.gif) 000 g for 10 min, the protein from the supernatant was separated by sodium dodecylsulfate-polyacrylamide gel electrophoresis (SDS-PAGE) and subsequently transferred to a polyvinylidene difluoride (PVDF) membrane. After being blocked with 5% milk, the total FAK (t-FAK), p-FAK, BMP-2, t-Smad1, p-Smad1/5/8 and β-actin were probed with specific antibodies (Cell Signaling, Santa Cruz, CA) overnight at 4 °C, followed by incubation with the corresponding secondary antibodies at room temperature for 1 h. The protein bands were visualized with the Western-Light Chemiluminescent Detection System (Peiqing, China). The density values were calculated by densitometric scanning using ImageJ software and normalized to β-actin. Six separate samples were measured for each group.
000 g for 10 min, the protein from the supernatant was separated by sodium dodecylsulfate-polyacrylamide gel electrophoresis (SDS-PAGE) and subsequently transferred to a polyvinylidene difluoride (PVDF) membrane. After being blocked with 5% milk, the total FAK (t-FAK), p-FAK, BMP-2, t-Smad1, p-Smad1/5/8 and β-actin were probed with specific antibodies (Cell Signaling, Santa Cruz, CA) overnight at 4 °C, followed by incubation with the corresponding secondary antibodies at room temperature for 1 h. The protein bands were visualized with the Western-Light Chemiluminescent Detection System (Peiqing, China). The density values were calculated by densitometric scanning using ImageJ software and normalized to β-actin. Six separate samples were measured for each group.
2.6 Osteoblast F-actin and vinculin immunostaining
After incubation for 1 day, the samples from each group were removed from the culture flask, fixed with 4% paraformaldehyde and permeabilized with 0.1% Triton X-100 for 10 min. After non-specific antibody binding was blocked using 1.0% BSA for 30 min, the samples were incubated with rat anti-vinculin antibody (R&D, 1: 200) in PBS for 1 h. Subsequently, they were incubated with FITC-conjugated anti-rat IgG antibody (1![[thin space (1/6-em)]](https://www.rsc.org/images/entities/char_2009.gif) :
:![[thin space (1/6-em)]](https://www.rsc.org/images/entities/char_2009.gif) 200) along with rhodamine phalloidin for 1 h in the dark. Finally, the osteoblast nuclei were stained with 4′,6-diamidino-2-phenylindole (DAPI) for 5 min in the dark. The samples were then imaged using a confocal microscope (Olympus Fluoview, Japan). The overall cellular area to nucleus area (CN ratio) and fluorescence intensity of vinculin were measured using an ImageJ software package. Six different substrate fields were measured per sample, and three separate samples were measured for each group.
200) along with rhodamine phalloidin for 1 h in the dark. Finally, the osteoblast nuclei were stained with 4′,6-diamidino-2-phenylindole (DAPI) for 5 min in the dark. The samples were then imaged using a confocal microscope (Olympus Fluoview, Japan). The overall cellular area to nucleus area (CN ratio) and fluorescence intensity of vinculin were measured using an ImageJ software package. Six different substrate fields were measured per sample, and three separate samples were measured for each group.
2.7 Osteoblast morphological observation
Osteoblast morphology was observed after 1 day of incubation using SEM (S-4800, Hitachi, Japan) operating at 15 kV. Before that, the samples were removed from the culture flask and fixed in 2.5% glutaraldehyde at 4 °C overnight. After dehydration through ethanol series and critical-point drying, they were sputtered with gold and lastly observed using SEM.2.8 Osteoblast proliferation assay
After 1, 3 and 7 days of cell culturing, the samples were moved to new wells with addition of CCK-8 solution and further 3 h of incubation. The medium was then transferred to a 96-well plate, and the optical density (OD) value was measured by the spectrophotometer at a wavelength of 450 nm. The OD value at day 1 was set as 1 for each group and the increase was presented at 3 and 7 days.2.9 Osteoblast differentiation assay
Following incubation for 6 and 10 days, the ALP activity of each sample was determined by a colorimetric assay using p-nitrophenyl phosphate as substrate. The absorbance of formed p-nitrophenol was measured at a wavelength of 405 nm with the spectrophotometer. The intracellular total protein content was determined using a BCA protein assay kit and the ALP activity was normalized to the total protein content.Osteocalcin (OCN) production of osteoblasts was measured after incubation for 14 days using an enzyme-linked immunosorbent assay (ELISA). The culture medium of each group was extracted and incubated with anti-osteocalcin antibody overnight at 4 °C and then with horseradish peroxidase (HRP)-conjugated secondary antibody for 10 min at room temperature. Tetramethylbenzidine was used as chromogenic substrate to HRP. The absorbance values were then measured at 450 nm after stopping the reaction with addition of 1 N hydrochloric acid. The osteocalcin production was calculated based on the absorbance calibration curve.
Matrix mineralization of the samples was evaluated by Alizarin Red staining and quantification after incubation for 21 days. After the samples were fixed in 75% ethanol, they were stained with Alizarin Red (40 mM) for 10 min at room temperature and rinsed carefully with distilled water until no more color appeared in the samples. Subsequently, the stained samples were dissolved in 10% cetylpyridinium chloride and the absorbance values were measured at 620 nm.
2.10 Real-time polymerase chain reaction
The transcript levels of integrin subunits (integrin α2, α3, β1 and β3) and osteogenesis-related genes (Runx2, Osterix and OPN) for each group after incubation for 7 days were assessed using real-time PCR. Osteoblasts were harvested and total cellular RNA was extracted with Trizol. The extracted RNA samples were then converted to cDNA and the gene expressions were evaluated using a Bio-Rad CFX Manager system. The primer sequences are listed in Table 1 and β-actin was used as a housekeeping gene. The gene expression of osteoblasts in Ti + NS group was set as 1 and the relative levels in other groups were quantified.| Gene | Forward primer sequence (5′-3′) | Reverse primer sequence (5′-3′) |
|---|---|---|
| α2-Integrin | GCACCACATTAGCATACAGA | GGCATCATACAGGAGAGGAA |
| α3-Integrin | GTCTGGAAACCTTGTCAACCC | CAACCACAGCTCAATCTCAGC |
| β1-Integrin | CTACTGGTCCCGACATCATCC | TGACCACAGTTGTCACGGCAC |
| β3-Integrin | GAGTGTCCCAAGGGTCCTGATA | AATGGCAGAGAGTCCCACGGTC |
| Runx2 | GCCGTAGAGAGCAGGGAAGAC | CTGGCTTGGATTAGGGAGTCAC |
| Osterix | CGGCAAGGCTTCGCATCTG | GGAGCAGAGCAGACAGGTGAACT |
| OPN | GACAGCAACGGGAAGACC | CAGGCTGGCTTTGGAACT |
| β-Actin | GGACTATGACTTAGTTGCGTTAC | TTTGCATTACATAATTTACACGA |
2.11 Induction of diabetic sheep
Diabetes was successfully induced in six sheep (male, 1 year old, 60–70 kg) with two doses of streptozotocin (60 mg kg−1) intravenously injected for five to seven consecutive days, as described previously.31 Blood glucose levels were measured every day, and those consistently exceeding 180 mg dL−1 after administration for 3 weeks were considered diabetes. The diabetic sheep were randomly divided into three groups: Ti (implantation) group, nCT group and Ti + NAC group (n = 2 for each group). For Ti + NAC group, NAC was intramuscularly administered at 5 mg kg−1 every week after Ti implantation, as previously described.322.12 Animal surgery
Prior to surgery, all six sheep were placed in quarantine for 10 days and fasted for 24 h. The surgical procedure was performed as described previously.6 Briefly, a mixture of ketamine and xylazine was injected intramuscularly to induce general anesthesia, which was maintained with isoflurane delivered in oxygen via endotracheal intubation. After the hip was shaved and a longitudinal incision was made, the crista iliaca was totally exposed. An electrical drill was used to create three bone defects (each Φ 12 mm × 5 mm), into which three Ti/nCT were press-fitted. Then three identical implants were implanted on the other side via the same procedure. Afterwards, the incisions were closed in layers and covered with adhesive bandages to prevent infection. After 1 day of surgery, the six sheep were allowed to move freely. 12 weeks later, all the sheep were euthanized by intracardiac overdose of pentobarbital sodium and the crista iliaca were immediately dissected for further tests.2.13 Micro-CT analysis
The extracted specimens containing the implants and surrounding tissues (n = 6 for each group) were fixed in 10% neutral buffered formalin for more than 2 weeks and subjected to micro-CT (eXplore Locus SP, GE Healthcare, Canada) analysis. The scanning angular rotation was 360° and the angular increment was 0.40° with source voltage set at 80 kV and beam current at 200 mA using filtered Bremsstrahlung radiation. To determine the 3D architectural properties within the bone ingrowth area, the reconstructed data were loaded into 3D modeling software (Microview, GE Healthcare, Canada) in the region of interest (ROI). To calculate the percentage of bone volume out of pore volume (BV/PV), the threshold for bone tissue was set as 2000 and the threshold for implant was set as 4600.2.14 Histological and histomorphometrical evaluation
Other specimens extracted from crista iliaca (n = 6 for each group) were fixed in 10% formalin solution for 3 weeks to prepare undecalcified histological sections. After a series of dehydration processes in graded ethanol (70–100%), they were transferred into a methyl methacrylate (MMA) solution and polymerized at 37 °C for 1 week. Three slices of histological sections (80–100 μm in thickness) from the cross-section of each sample were prepared using a modified microtome (Leica SP 1600, Leica, Germany) and were polished to remove grinding marks. Afterwards, the slices were stained with 1.2% trinitrophenol and 1% acid fuchsin (Van-Gieson staining) and examined with a light microscope (Leica LA Microsystems, Bensheim, Germany). The quantitative analysis of osteogenesis and osteointegration within the implants was performed using an image analysis system (Image-Pro Plus software, Silver Spring, USA) after the bone tissue and titanium implants were pseudocoloured priorly. The mean value of bone volume fraction [(bone area/pore area) × 100%] was calculated for each sample and statistically compared between groups.2.15 Statistical analysis
The results were expressed as mean ± SD from at least three independent experiments. Statistical analysis was performed using one-way ANOVA followed by Bonferroni's multiple comparison tests. P values less than 0.05 were considered to be statistically significant.3. Results
3.1 Surface characterization of Ti and nCT
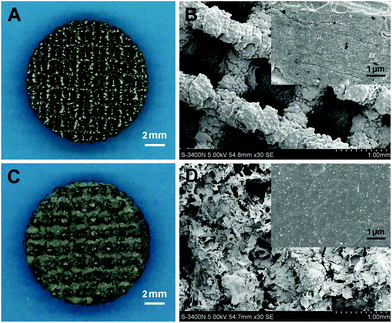
The gross views and SEM images of Ti and nCT are displayed in Fig. 1. The high magnification images (top right inset) display the nanotopographies of the samples. On nCT, granulate-like HA nanoparticles are seen uniformly distributed on CS. The diameter of the HA granule is between 50 and 100 nm (Fig. 1D).3.2 Osteoblast ROS production and antioxidant activity on Ti and nCT substrate under diabetic conditions
After 7 days of incubation, oxidative stress as indicated by DCF fluorescence and H2O2 in osteoblasts was measured. As shown in Fig. 2A, DS induced about 3-fold increase in fluorescence intensity compared to NS incubation (p < 0.05). The increase was reversed by nCT substrate, on which the fluorescence intensity was significantly decreased, accounting for about 60% of that on Ti incubated with DS (p < 0.05). As a well-accepted ROS scavenger, NAC administration attenuated the fluorescence intensity on Ti (p < 0.05), but exhibited no significant difference with that on nCT substrate without NAC addition (p > 0.05).Similar to DCF fluorescence results, H2O2 amount in osteoblast culture supernatants incubated with DS on Ti was markedly higher than that incubated with NS (p < 0.05, Fig. 2B). When incubated on nCT substrate with DS, H2O2 amount was decreased to 69% (p < 0.05). NAC treatment significantly decreased H2O2 amount on Ti (p < 0.05) but was comparable to that of the nCT group (p > 0.05).
The activity of SOD was measured to evaluate the antioxidant capacity of osteoblasts (Fig. 2C). DS incubation markedly attenuated SOD activity compared to NS incubation on Ti (p < 0.05), and both nCT substrate and NAC administration improved SOD activity compared to Ti substrate (both p < 0.05). But no statistical difference was observed between the two groups (p > 0.05).
3.3 Activities of FAK phosphorylation and downstream BMP-2/Smad signaling pathway on Ti and nCT substrate under diabetes-induced high ROS condition
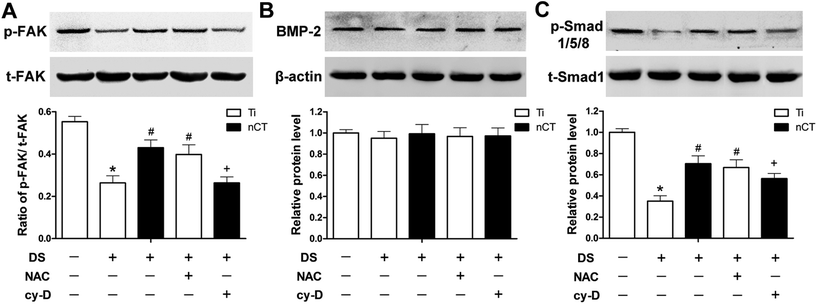
The protein levels of t-FAK, p-FAK, BMP-2, t-Smad1 and p-Smad1/5/8 were assessed by western blot analysis after 7 days of incubation. According to the semiquantative analysis shown in Fig. 3, the relative p-FAK levels expressed as ratios to t-FAK incubated with DS, was about half of that incubated with NS on Ti (p < 0.05). Compared to that in the Ti + DS group, the p-FAK level increased 1.7-fold for nCT (p < 0.05). NAC treatment induced a similar expression to nCT substrate, which was also significantly higher than that of the Ti + DS group (p < 0.05). Cytochalasin D gave rise to a dramatically lower expression of p-FAK, which was decreased by 38% compared with that in the nCT + DS group without cytochalasin D administration (p < 0.05).In the BMP-2-dependent Smad signaling pathway, the level of BMP-2 protein was apparently neither affected by the diabetic serum nor by the implant substrate (all p > 0.05). While Smad1/5/8 phosphorylation was regulated in a similar manner with p-FAK, with total Smad1 levels constant independent of treatments. Compared with NS incubation, DS obviously reduced Smad1/5/8 phosphorylation to 35% on Ti substrate (p < 0.05), which was up-regulated by either nCT substrate or NAC treatment (p < 0.05). Cytochalasin D statistically reduced elevated Smad1/5/8 phosphorylation on nCT substrate compared to that on its counterpart without cytochalasin D treatment (p < 0.05). These data demonstrated that reactivation of FAK by nCT substrate alleviated inhibition of BMP-2/Smad signaling mediated by DS-induced ROS overproduction on Ti substrate.
3.4 Integrin subunit expressions on Ti and nCT under diabetes-induced high ROS condition
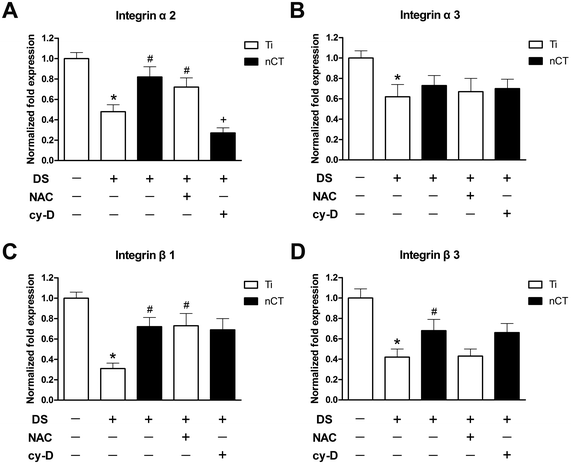
Integrins are the major adhesion receptors that mediate cell attachment and adhesion.33 After 7 days of incubation, DS remarkably down-regulated the expressions of integrin subunits α2, α3, β1, and β3 to about 50%, 60%, 30% and 40% compared to those incubated with NS on Ti substrate, respectively (all p < 0.05), as shown in Fig. 4. Integrin subunits α2, β1 and β3 were elevated 1.70-fold, 2.32-fold and 1.62-fold on nCT substrate, respectively, compared to those on Ti substrate incubated with DS (all p < 0.05), while the expression of integrin subunit α3 was not affected by substrate (p > 0.05). The expressions of integrin subunits α3 and β3 were not apparently altered by NAC treatment (both p > 0.05). But the expressions of integrin subunits α2 and β1 treated with NAC on Ti substrate were 1.50-fold and 2.35-fold of their counterparts without NAC treatment, respectively (both p < 0.05). Moreover, cytochalasin D exhibited inhibitory effect only on α2 expression, which was repressed to 30% of that in the nCT + DS group (p < 0.05).3.5 Role of FAK in improved osteoblast adhesion and morphology on nCT under diabetes-induced high ROS condition
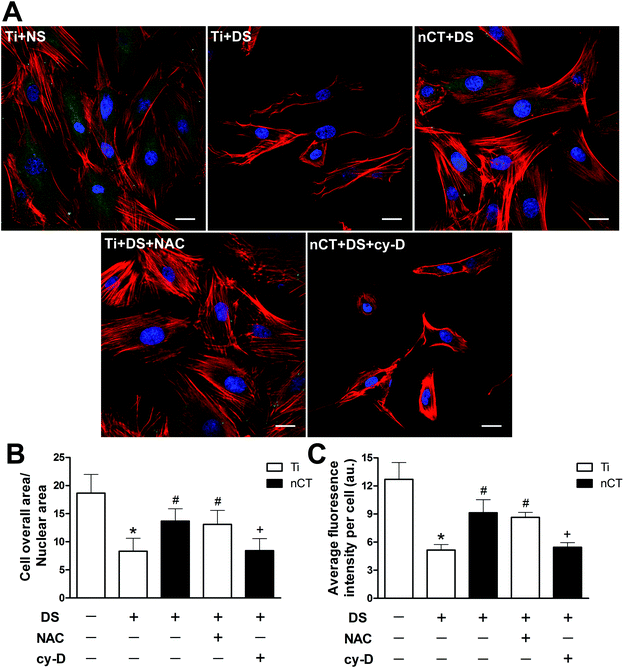
To investigate osteoblast adhesion behavior, we performed triple immunostaining (Fig. 5A) and characterized cytoskeleton organizations by quantifying CN ratio via image analysis (Fig. 5B). Labeling with phalloidin after 1 day of incubation revealed that actin polymerization and filament formation were well organized with a large spreading area on Ti incubated with NS but concealed when treated with DS. The actin bundles had a slim feature and twisted orientation when incubated with DS on Ti, together with reduced CN ratio (p < 0.05). The cytoskeleton organization was enhanced on nCT substrate incubated with DS, concomitant with elevated CN ratio compared to that on Ti substrate (p < 0.05). However, nCT-induced amelioration of osteoblast adhesion in DS disappeared after administration of cytochalasin D, which led to compromised osteoblast spreading (p < 0.05). NAC treatment exhibited an effect similar to nCT substrate, giving rise to enhanced osteoblast spreading with increased CN ratio (p < 0.05).Vinculin bridges focal adhesion complexes with cytoskeleton.34 To evaluate adhesion plaques of osteoblasts in different groups, immunostaining specific to vinculin was performed and quantified (Fig. 5C). In osteoblasts grown on Ti substrate incubated with NS, the vinculin distributed well within cytoplasm with high fluorescence intensity, indicating normal osteoblast adhesion. A significant decrease in fluorescence intensity was observed on Ti incubated with DS (p < 0.05). nCT substrate obviously induced higher intensity compared to Ti substrate incubated with DS, which exerted similar effect to NAC treatment (both p < 0.05). Cytochalasin D retarded the fluorescence intensity of vinculin to a markedly lower level on nCT substrate (p < 0.05).
Osteoblast morphology was observed by SEM after 1 day of incubation (Fig. 6). When incubated with NS, osteoblasts exhibited a typically flattened and spread shape on Ti substrate. However, when incubated with DS, the discernible morphological changes could be observed. The osteoblasts loosely attached on Ti substrate with atrophied morphology. On nCT, the osteoblasts spread better than on Ti, concomitant with many prominent filopodia protrusions. NAC treatment also seemly ameliorated the impaired morphology of osteoblasts on Ti, evidenced by a more flattened shape and more compact attachment. The cytochalasin D treatment altered the morphology of osteoblasts on nCT, resulting in decreased osteoblast spreading and protrusions. These data collectively demonstrated that FAK reactivation played an important role for improving osteoblast adhesion and determining morphology exerted by nCT substrate.
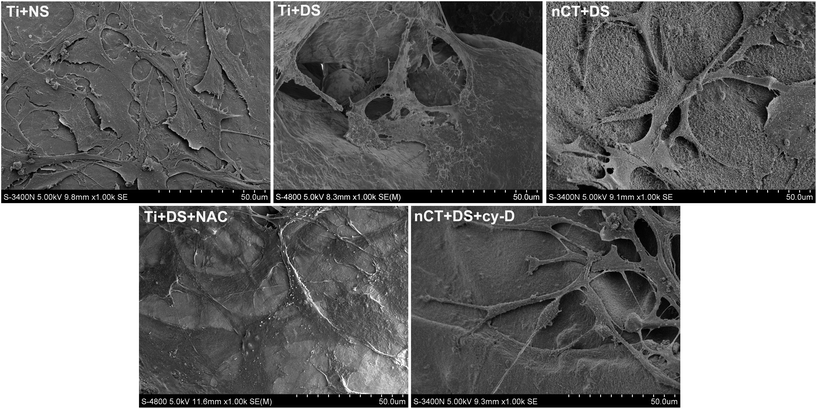 | ||
| Fig. 6 Analysis of osteoblast morphology observed by SEM for each group after 1 day of incubation. The black arrow indicates many prominent filopodia protrusions of osteoblasts in the nCT + DS group. | ||
3.6 Role of FAK in improved osteoblast proliferation on nCT under diabetes-induced high ROS condition
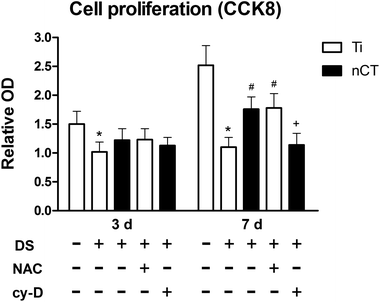
The underlying role of FAK in osteoblast proliferation under diabetes-induced high ROS condition was indicated by cellular viability, which could be determined by CCK-8 assay after incubation for 1, 3 and 7 days. The increase in each group was calculated and presented at 3 and 7 days (Fig. 7). At day 3, the osteoblast viability was apparently retarded by DS (p < 0.05). nCT substrate and NAC treatment induced no significant difference compared to Ti incubated with DS (both p > 0.05). While at day 7, nCT generated much higher osteoblast viability compared with Ti incubated with DS. A similar effect was shown by NAC treatment (both p < 0.05). The exogenous cytochalasin D showed no effect on osteoblast viability at 3 days (p > 0.05) but negative effect at 7 days (p < 0.05).3.7 Role of FAK-BMP-2/Smad signaling pathway in improved osteoblast differentiation on nCT under diabetes-induced high ROS condition
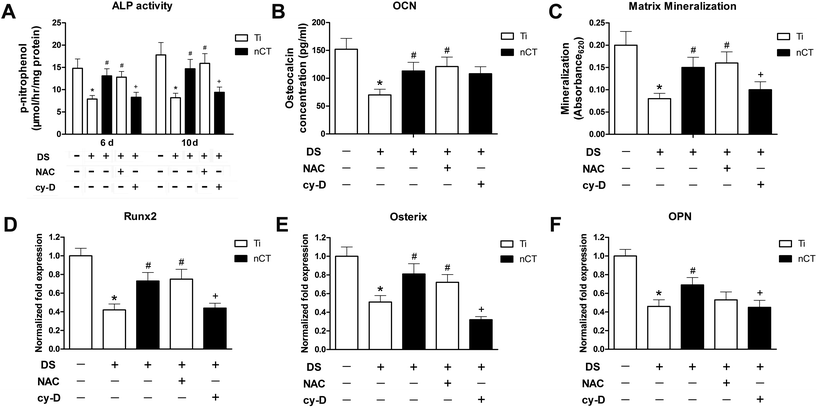
The differentiation of osteoblasts of each group was assessed in terms of ALP activity, OCN production, matrix mineralization and osteogenesis-related gene expressions downstream of the BMP-2/Smad signaling pathway (Fig. 8). As an early marker of osteogenic differentiation, ALP activity of osteoblasts slightly increased from day 6 to day 10 among all groups (Fig. 8A). DS induced significantly lower ALP activity at the two time slots on Ti substrate (both p < 0.05), which were obviously ameliorated by either nCT substrate or NAC treatment in DS (both p < 0.05). Cytochalasin D gave rise to dramatically lower ALP activity on nCT substrate at both time slots (both p < 0.05).Afterwards, the OCN production using ELISA was evaluated for each group after incubation for 14 days (Fig. 8B), because OC production is a marker indicating the late stage of osteoblast differentiation.35 The assay results were consistent with that of ALP activity at day 10, except in the nCT + cytochalasin D group. Although cytochalasin D seemed to reduce elevated OCN production induced by nCT substrate, the difference was not statistically significant (p > 0.05).
Matrix mineralization was evaluated by Alizarin Red staining after incubation for 21 days for each group and showed a trend similar to that of ALP activity at day 10 (Fig. 8C). Again, nCT substrate displayed higher mineralization capacity than Ti incubated with DS (p < 0.05). Similar effect was observed in the Ti + NAC group (p < 0.05). Cytochalasin D depressed mineralization on nCT by about 30% (p < 0.05).
To further examine the effect of nano-HA/CS composite coating on osteoblastic differentiation at the molecular level, mRNA expressions of osteogenesis-related genes downstreamof the BMP-2/Smad signaling pathway, including Runx2, Osterix and OPN, were characterized by real-time PCR analysis after culturing for 7 days (Fig. 8D–F). Generally, the expressions of all the concerned genes were significantly decreased to more or less half of that after DS incubation (all p < 0.05). Compared to those in the Ti + DS group, the gene expressions of Runx2, Osterix and OPN were upregulated 1.74-, 1.59- and 1.5-fold on nCT substrate, respectively (all p < 0.05). NAC treatment exhibited an effect similar to nCT substrate on the expressions of Runx2 and Osterix (both p < 0.05), but not OPN (p > 0.05). Cytochalasin D led to significantly lower expressions for all the three genes, accounting for 60%, 40% and 65% of those in the nCT + DS group, respectively (p < 0.05).
3.8 Effect of nano-HA/CS composite coating on osteogenesis and osteointegration in diabetic sheep
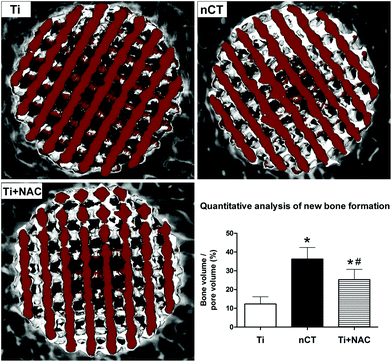
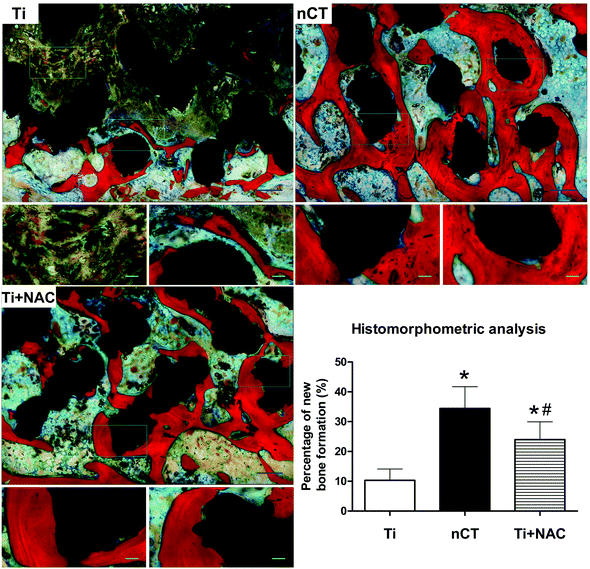
To evaluate new bone ingrowth and osteointegration within the implants, we performed micro-CT analysis in diabetic sheep at 12 weeks after implantation. The reconstructed 3D images of new bone ingrowth within the implants of each group were representatives of sections in the very center of the implants in terms of z-dimension (Fig. 9). The host bone tissue (white) was observed to integrate with the implants (brown) from the margin into the center. In the Ti group, new bone formation was detected majorly in the peripheral space of the implant, while nCT group exhibited a much more favorable bone tissue regeneration within the implant with the percentage of BV/PV (36.3 ± 6.2%) higher than that in the Ti group (12.3 ± 3.9%, p < 0.05). The Ti + NAC group also exhibited substantial new bone ingrowth (25.3 ± 5.5%), which was significantly higher than that in the Ti group (p < 0.05), but not comparable with that in the nCT group (p < 0.05).To further investigate the effect of nano-HA/CS composite coating on osteointegration in diabetic sheep, histological analysis at the bone–titanium interface by Von-Gieson staining was performed, as shown in Fig. 10. After implantation for 12 weeks, limited new bone tissue (red) grew into the pores of the implant with abundant loosely packed fibrous and osteoid tissue (yellow and purple) occupying the central area. The bone–titanium contact was organized loosely, which was in line with a previous report.36 In comparison, the nCT group exhibited more favorable new bone ingrowth into the implant with more compact bone–titanium integration. The histomorphometrical evaluation showed that the bone volume fraction in the nCT group (34.5 ± 7.3%) was significantly higher than that in the Ti group (10.3 ± 3.8%, p < 0.05). The Ti + NAC group also exhibited moderate new bone ingrowth (24.0 ± 6.0%), higher than that of the Ti group (p < 0.05) but less than that of the nCT group (p < 0.05). These data collectively demonstrated that nano-HA/CS composite coating compensated for the negative influence of DM on osteointegration of titanium implant and performed better than NAC administration.
4. Discussion
Since diabetes is considered as a major obstacle I the clinical application of titanium implants,37 explorations for specific mechanisms of diabetes-induced poor implant osteointegration and valuable improvement strategies targeting at bio-modification are urgently needed. In the present study, we demonstrated that diabetes-induced ROS overproduction impaired osteoblast adhesion and the following osteoblastic differentiation on pure titanium substrate regulated by the FAK-mediated BMP-2/Smad signaling pathway. The nano-HA/CS composite coating constructed on the surface of the titanium implant reversed the impaired biological performance of pure titanium substrate via reactivation of the above FAK-BMP-2/Smad pathway under diabetes-induced high ROS condition. Repair of crista iliaca defect in vivo further demonstrated that nCT performed much better than Ti and even superior to NAC treatment on Ti in promoting bone regeneration and osteointegration. This was possibly attributed to the role of nano-HA/CS composite coating in facilitating osteoblast adhesion and osteogenic differentiation at the bone–titanium interface.The poor osteointegration problems in uncontrolled diabetes are mainly due to depressed osteoblast biological functions occurring at the bone–titanium interface during the healing period.38 In terms of pathogenesis of diabetic conditions, there have been controversial arguments about the role of diabetic serum vs. high glucose alone. Some previous literature has established the pathological condition of high glucose for investigating cellular behavior alterations in vitro.39,40 Zhang et al. once drew the controversial conclusion that the simple high glucose condition activated the PI3K/AKT pathway emerged as the major osteogenic signaling network for osteoblastic activities.41 On the other hand, in our previous study, it was found that DS-mediated ROS overproduction inactivated the PI3K/AKT pathway, leading to impaired osteoblast biological functions.42 Thus, it can be seen that high glucose condition is not the same as DS condition. In our opinion, ROS overproduction is a result of synergetic action of high glucose and other DS-associated proteins/chemicals. DS contains not only high glucose, but also additive pathological stimuli including high adipose and inflammatory cytokines.
Although diabetes-induced ROS overproduction plays a critical role in impaired tissue-affecting process, specific molecular mechanisms are not well understood. In the present study, the regulation of the FAK-mediated BMP-2/Smad signaling pathway in the above process was initially elucidated and FAK-related osteoblast adhesion was thereafter investigated. When cells come into contacting with a material, adhesion as the initial step in the cascade of cellular events43 definitively controls successive biological functions.44 Upon adhesion, a selective group of signaling and cytoskeletal proteins are recruited to focal adhesions, which link cytoskeleton to substrate and mediate signal transduction.45,46 Among them, FAK uniquely mediates matrix–integrin interactions in cellular processes and plays an important role in regulating subsequent cellular biological functions.10,47
In our study, FAK phosphorylation of osteoblasts in focal adhesion at the bone–titanium interface was significantly inhibited by ROS overproduction but ameliorated by NAC treatment, as evidenced by western blot analysis. Osteoblast adhesion was regulated in a manner similar to FAK phosphorylation, as evidenced by the suppressed CN ratio, vinculin intensity and impaired osteoblast morphology. As co-localization components in focal adhesion, the integrin subunit expressions exhibited diverse manners in different groups. It was reported that on titanium substrate, osteoblasts majorly express integrin subunits α2, α3, α4, α5, α6, β1 and β3.48 Among them, integrin α2 plays a key role in cell motility and adhesion via FAK signaling.49 As a result, it was regulated in the same way as p-FAK level in our study. For β subunits, we found that they were all up-regulated by nCT substrate, but partly regulated by NAC treatment (only integrin β1). It may be because FAK is an immediate downstream signal of integrin subunit β1.10 Therefore, we considered that integrin subunits α2 and β1 jointly participated in FAK inhibition exerted by DM-induced ROS overproduction at the bone–titanium interface. Based on the experimental results, it could be collectively demonstrated that diabetes-induced ROS overproduction negatively influenced osteoblast adhesion through FAK inhibition, as evidenced by decreased p-FAK protein levels and mRNA levels of integrin subunits α2 and β1. Similar to our findings, a recent report demonstrated that photo-generated ROS overproduction on UV-irradiated TiO2 surface almost completely inhibited platelet adhesion on TiO2 substrate.50
FAK activation is concomitant with numerous effects resulting from diversity of signaling pathways employing this enzyme. One of them is enhanced transduction of signals controlling cell proliferation.51,52 In our study, we found that FAK reactivation induced by NAC treatment incubated with DS led to elevated osteoblast proliferation, which was in line with a previous report.51 However, the most important role of FAK activation is to promote differentiation of osteoblast lineage, especially associated with BMP expression.10 BMPs as members of the TGF-β superfamily are considered the most important osteogenic stimulators and can induce ectopic bone formation in vivo.53,54 Among them, BMP-2 signaling pathway plays a vital role in osteogenic differentiation.55,56 When it comes to diabetic conditions, although DM adversely affects osteogenic differentiation,5,6,57 we found BMP-2 expression was not altered when incubated with DS, which was also confirmed in previous reports.13–15 Hie et al. thus speculated Runx2 and Runx2-mediated differentiation were suppressed by a totally BMP-2-independent mechanism under diabetic conditions.13 However, our results indicated that diabetes-induced impaired FAK phosphorylation significantly suppressed BMP-2-related Smad1/5/8 phosphorylation and its downstream Runx2 expression. It might be ascribed to refractoriness of osteoblasts to BMP-2 on Ti under diabetes-induced high ROS condition. Eventually, the above process led to attenuated osteoblast differentiation from early to late stage including ALP activity, osteocalcin production and matrix mineralization. The above findings were consistent with Tamura et al.'s vital demonstration that FAK activation via focal adhesion formation is necessary for BMP action in terms of stimulation of osteoblastic differentiation.10 Therefore, it seemed to be an accelerant method to activate FAK phosphorylation and FAK-mediated BMP-2/Smad signaling pathway for solving the problem.
In the present study, nano-hydroxyapatite incorporated chitosan composite coating was successfully constructed on the titanium implant surface. A previous report demonstrated that favorable wettability of chitosan made osteoblasts cultured on chitosan-coated titanium exhibit increased expressions of osteogenic genes including osteocalcin and osteoprotegerin possibly via regulating wettability-sensitive integrins.58 It possibly contributed to the promotion of implant osteointegration as the extensively used technique for surface modification.21,59 More importantly, chitosan and its derivatives exhibited possible antioxidant activities.60,61 Tomida et al. reported that it can be attributed to the effects of intra-molecular hydrogen bonding in the chitosan molecule. The strong effect of intramolecular hydrogen bonding decreased the reactivity of hydroxyl and amino groups.62 Xie et al. considered that the amino groups NH2 in water-soluble chitosan could also react with –OH to form stable macromolecule radicals.61 In another previous research about the reaction of chitosan with glucose by Gullon et al., it was demonstrated that chitosan undergoing the Maillard Reaction (MR) by co-heating a solution with glucose at a temperature of 40 °C can form complexes with antioxidant properties.63 The titanium surface was coated with chitosan, which insulated titanium surface from diabetes-mediated high ROS micro-environment. The enhanced anti-oxidative effect as well as adhesion-enhancement effect of nCT on seeded osteoblasts collectively led to ameliorated osteoblast dysfunction and apoptosis and eventually improved osteointegration in diabetic sheep. Upon addition of HA, cellular adhesion is reported to increase, because more albumin and serum proteins were adsorbed to HA than to titanium.23,64 HA has also been reported to benefit cytoskeleton organization and focal contact formation.65 When it comes to nanoscale, it was revealed that nanophase HA in nano-HA/CS scaffolds elevated expressions of integrin subunits α1, α2, and β1 and accounted for improved BMSC adhesion or spreading by influencing the integrin-BMP/Smad signaling pathway. This may be because nano-HA adsorbs more fibronectin and vitronectin from the serum, which would lead to better binding of purified integrins and osteoblast precursor cells.12
In the present study, the nano-HA/CS composite coating improved osteoblast adhesion and morphology under diabetes-induced high ROS condition, as shown by fluorescent immunostaining and SEM observation. Importantly, the nano-HA/CS composite coating significantly facilitated FAK phosphorylation under diabetic conditions, along with expressions of integrin subunits α2, β1 and β3. The composite coating's facilitation on FAK phosphorylation consequently reversed the suppression of BMP-2-dependent Smad1/5/8 phosphorylation along with increased BMP-2/Smad-mediated osteoblastic gene expressions on Ti substrate under diabetic conditions, but interfered by the cytochalasin D treatment. These results highlighted the critical role of the FAK mediated BMP-2/Smad signaling pathway in nano-HA/CS composite coating's regulation on improved osteointegration under diabetic conditions.
The activity of the BMP-initiated signaling pathways is under tight control by downstream intracellular effectors, Smad proteins.66 The critical step in activation of canonical BMP signaling is the phosphorylation of transcription factors Smad1, Smad5 and Smad8 (collectively Smad1/5/8).66 The BMP-2/Smad-mediated transcription factor Runx2 acts as the principal osteogenic master gene and constitutes a network of activities and molecular switches for osteoblast differentiation and bone development.67 Osterix acts downstream of Runx2, directing pre-osteoblasts to become osteoblasts.68 The two critical downstream transcription factors that were regulated in a manner similar to p-Smad1/5/8 directly contributed to osteoblast differentiation from early to late stage on nCT substrate. Taken together with the above results, it could be indicated that nano-HA/CS composite coating facilitated osteogenesis and osteointegration under diabetes-induced high ROS condition, likely by supporting osteoblast adhesion and adhesion-related osteoblastic differentiation through reactivation of the FAK-mediated BMP-2/Smad signaling pathway.
Animal experiments were also performed to further confirm the promotive effect on osteointegration exerted by nCT in diabetic sheep. The osteointegration and new bone ingrowth were significantly increased in the nCT group, which performed even better than NAC treatment on Ti implantation. These findings further corroborated the supportive function of nano-HA/CS composite coating against diabetes-induced ROS overproduction at the bone–titanium interface in vivo. However, more details about the relationship between molecular mechanisms in vitro with nCT's favorable biological performance in vivo needs further investigations.
5. Conclusion
Diabetes-induced ROS overproduction contributed to the inhibition of adhesion-related FAK phosphorylation, further leading to impaired osteoblast biological functions, especially BMP-2/Smad dependent differentiation at the bone–titanium interface. Nano-HA/CS composite coating constructed on Ti reactivated the FAK-BMP-2/Smad signaling pathway, thus promoting osteoblast adhesion and differentiation and eventual osteointegration under diabetic conditions. The elucidation of the molecular mechanisms provided new molecular targets for biomaterial surface modification and functionalization, based on which the great potential of using nano-HA/CS composite coating for bone tissue engineering applications under diabetic conditions was highlighted.Conflicts of interest
There are no conflicts of interest to declare.Acknowledgements
This work was supported by grants from the Liao Ning Province Natural Science Foundation of China (No. 201601411) to Xiang-Yu Ma, National Natural Science Foundation of China (No. 81401769) to Ya-Fei Feng, and Research Fund for the National Natural Science Foundation of China (No. 81702131) to Xiang-Yu Ma.References
- F. Javed and G. E. Romanos, J. Periodontol., 2009, 80, 1719–1730 CrossRef PubMed.
- X. F. Hu, L. Wang, Y. Z. Lu, G. Xiang, Z. X. Wu, Y. B. Yan, Y. Zhang, X. Zhao, Y. Zang, L. Shi, W. Lei and Y. F. Feng, Acta Biomater., 2017, 61, 233–248 CrossRef CAS PubMed.
- Y. Hamada, H. Fujii and M. Fukagawa, Bone, 2009, 45(Suppl 1), S35–S38 CrossRef CAS PubMed.
- R. J. Waddington, A. Alraies, J. S. Colombo, A. J. Sloan, J. Okazaki and R. Moseley, Cells Tissues Organs, 2011, 194, 307–312 CrossRef CAS PubMed.
- Y. F. Feng, L. Wang, Y. Zhang, X. Li, Z. S. Ma, J. W. Zou, W. Lei and Z. Y. Zhang, Biomaterials, 2013, 34, 2234–2243 CrossRef CAS PubMed.
- X. Y. Ma, Y. F. Feng, Z. S. Ma, X. Li, J. Wang, L. Wang and W. Lei, Biomaterials, 2014, 35, 7259–7270 CrossRef CAS PubMed.
- K. Anselme, Biomaterials, 2000, 21, 667–681 CrossRef CAS.
- H. A. Pan, J. Y. Liang, Y. C. Hung, C. H. Lee, J. C. Chiou and G. S. Huang, Biomaterials, 2013, 34, 841–853 CrossRef CAS PubMed.
- W. Chen, L. G. Villa-Diaz, Y. Sun, S. Weng, J. K. Kim, R. H. Lam, L. Han, R. Fan, P. H. Krebsbach and J. Fu, ACS Nano, 2012, 6, 4094–4103 CrossRef CAS PubMed.
- Y. Tamura, Y. Takeuchi, M. Suzawa, S. Fukumoto, M. Kato, K. Miyazono and T. Fujita, J. Bone Miner. Res., 2001, 16, 1772–1779 CrossRef CAS PubMed.
- A. C. Carreira, W. F. Zambuzzi, M. C. Rossi, R. Astorino Filho, M. C. Sogayar and J. M. Granjeiro, Vitam. Horm., 2015, 99, 293–322 CAS.
- H. Liu, H. Peng, Y. Wu, C. Zhang, Y. Cai, G. Xu, Q. Li, X. Chen, J. Ji, Y. Zhang and H. W. OuYang, Biomaterials, 2013, 34, 4404–4417 CrossRef CAS PubMed.
- M. Hie, N. Iitsuka, T. Otsuka and I. Tsukamoto, Int. J. Mol. Med., 2011, 28, 455–462 CAS.
- S. Botolin, M. C. Faugere, H. Malluche, M. Orth, R. Meyer and L. R. McCabe, Endocrinology, 2005, 146, 3622–3631 CrossRef CAS PubMed.
- S. Botolin and L. R. McCabe, Endocrinology, 2007, 148, 198–205 CrossRef CAS PubMed.
- J. M. Oliveira, M. T. Rodrigues, S. S. Silva, P. B. Malafaya, M. E. Gomes, C. A. Viegas, I. R. Dias, J. T. Azevedo, J. F. Mano and R. L. Reis, Biomaterials, 2006, 27, 6123–6137 CrossRef CAS PubMed.
- J. Yang, A. Liu, Y. Han, Q. Li, J. Tian and C. Zhou, J. Biomed. Mater. Res., Part A, 2014, 102, 1202–1209 CrossRef PubMed.
- M. Shakir, R. Jolly, M. S. Khan, N. Iram and H. M. Khan, Int. J. Biol. Macromol., 2015, 80, 282–292 CrossRef CAS PubMed.
- J. Y. Lee, S. H. Nam, S. Y. Im, Y. J. Park, Y. M. Lee, Y. J. Seol, C. P. Chung and S. J. Lee, J. Controlled Release, 2002, 78, 187–197 CrossRef CAS PubMed.
- A. Di Martino, M. Sittinger and M. V. Risbud, Biomaterials, 2005, 26, 5983–5990 CrossRef CAS PubMed.
- J. D. Bumgardner, R. Wiser, P. D. Gerard, P. Bergin, B. Chestnutt, M. Marin, V. Ramsey, S. H. Elder and J. A. Gilbert, J. Biomater. Sci., Polym. Ed., 2003, 14, 423–438 CrossRef CAS PubMed.
- T. J. Blokhuis, M. F. Termaat, F. C. den Boer, P. Patka, F. C. Bakker and H. J. Haarman, J. Trauma, 2000, 48, 179–186 CrossRef CAS PubMed.
- K. L. Kilpadi, P. L. Chang and S. L. Bellis, J. Biomed. Mater. Res., 2001, 57, 258–267 CrossRef CAS PubMed.
- A. Carrado, F. Perrin-Schmitt, Q. V. Le, M. Giraudel, C. Fischer, G. Koenig, L. Jacomine, L. Behr, A. Chalom, L. Fiette, A. Morlet and G. Pourroy, Dent. Mater., 2017, 33, 321–332 CrossRef CAS PubMed.
- T. J. Webster, C. Ergun, R. H. Doremus, R. W. Siegel and R. Bizios, J. Biomed. Mater. Res., 2000, 51, 475–483 CrossRef CAS PubMed.
- X. Li, C. T. Wang, W. G. Zhang and Y. C. Li, Proc. Inst. Mech. Eng., Part H, 2009, 223, 173–178 CrossRef CAS PubMed.
- L. Zhao, Y. Wei, J. Li, Y. Han, R. Ye and Y. Zhang, J. Biomed. Mater. Res., Part A, 2010, 92, 432–440 Search PubMed.
- I. Irrcher, V. Ljubicic and D. A. Hood, Am. J. Physiol.: Cell Physiol., 2009, 296, C116–C123 CrossRef CAS PubMed.
- Y. Takeuchi, M. Suzawa, T. Kikuchi, E. Nishida, T. Fujita and T. Matsumoto, J. Biol. Chem., 1997, 272, 29309–29316 CrossRef CAS PubMed.
- K. J. Motyl, M. Raetz, S. A. Tekalur, R. C. Schwartz and L. R. McCabe, Am. J. Physiol.: Regul., Integr. Comp. Physiol., 2011, 300, R1250–R1260 CrossRef CAS PubMed.
- T. Ramanathan, K. Shirota, S. Morita, T. Nishimura, Y. Huang, X. Zheng and S. Hunyor, Cardiovasc. Res., 2002, 55, 749–756 CrossRef CAS PubMed.
- X. Wang, C. Gu, W. He, X. Ye, H. Chen, X. Zhang and C. Hai, Biochimie, 2012, 94, 1705–1717 CrossRef CAS PubMed.
- R. O. Hynes, Cell, 2002, 110, 673–687 CrossRef CAS PubMed.
- R. Zaidel-Bar, C. Ballestrem, Z. Kam and B. Geiger, J. Cell Sci., 2003, 116, 4605–4613 CrossRef CAS PubMed.
- T. Yonezawa, J. W. Lee, A. Hibino, M. Asai, H. Hojo, B. Y. Cha, T. Teruya, K. Nagai, U. I. Chung, K. Yagasaki and J. T. Woo, Biochem. Biophys. Res. Commun., 2011, 409, 260–265 CrossRef CAS PubMed.
- B. Wang, Y. Song, F. Wang, D. Li, H. Zhang, A. Ma and N. Huang, Br. J. Oral Maxillofac. Surg., 2011, 49, 225–229 CrossRef PubMed.
- H. F. Morris, S. Ochi and S. Winkler, Ann. Periodontol., 2000, 5, 157–165 CrossRef CAS PubMed.
- M. Yu, W. Zhou, Y. Song, F. Yu, D. Li, S. Na, G. Zou, M. Zhai and C. Xie, Bone, 2011, 49, 387–394 CrossRef CAS PubMed.
- C. C. Guan, M. Yan, X. Q. Jiang, P. Zhang, X. L. Zhang, J. Li, D. X. Ye and F. Q. Zhang, Bone, 2009, 45, 1146–1152 CrossRef CAS PubMed.
- Y. Wittrant, Y. Gorin, K. Woodruff, D. Horn, H. E. Abboud, S. Mohan and S. L. Abboud-Werner, Bone, 2008, 42, 1122–1130 CrossRef CAS PubMed.
- Y. Zhang and J. H. Yang, J. Cell. Biochem., 2013, 114, 2595–2602 CrossRef CAS PubMed.
- X. Li, X. Y. Ma, Y. F. Feng, Z. S. Ma, J. Wang, T. C. Ma, W. Qi, W. Lei and L. Wang, Biomaterials, 2015, 36, 44–54 CrossRef CAS PubMed.
- M. Lai, K. Cai, L. Zhao, X. Chen, Y. Hou and Z. Yang, Biomacromolecules, 2011, 12, 1097–1105 CrossRef CAS PubMed.
- S. S. Rao and J. O. Winter, Front. Neuroeng., 2009, 2, 6 CAS.
- N. J. Boudreau and P. L. Jones, Biochem. J., 1999, 339(Pt 3), 481–488 CrossRef CAS PubMed.
- S. Pina, J. M. Oliveira and R. L. Reis, Adv. Mater., 2015, 27, 1143–1169 CrossRef CAS PubMed.
- M. Dejaeger, A. M. Bohm, N. Dirckx, J. Devriese, E. Nefyodova, R. Cardoen, R. St-Arnaud, J. Tournoy, F. P. Luyten and C. Maes, J. Bone Miner. Res., 2017, 32, 2087–2102 CrossRef CAS PubMed.
- R. K. Sinha and R. S. Tuan, Bone, 1996, 18, 451–457 CrossRef CAS PubMed.
- R. S. Sawhney, M. M. Cookson, Y. Omar, J. Hauser and M. G. Brattain, J. Biol. Chem., 2006, 281, 8497–8510 CrossRef CAS PubMed.
- J. Chen, A. Zhao, H. Chen, Y. Liao, P. Yang, H. Sun and N. Huang, Colloids Surf., B, 2014, 122, 709–718 CrossRef CAS PubMed.
- A. K. Howe, A. E. Aplin and R. L. Juliano, Curr. Opin. Genet. Dev., 2002, 12, 30–35 CrossRef CAS PubMed.
- R. K. Assoian and M. A. Schwartz, Curr. Opin. Genet. Dev., 2001, 11, 48–53 CrossRef CAS PubMed.
- J. M. Wozney, V. Rosen, A. J. Celeste, L. M. Mitsock, M. J. Whitters, R. W. Kriz, R. M. Hewick and E. A. Wang, Science, 1988, 242, 1528–1534 CAS.
- X. Zhang, Y. S. Liu, L. W. Lv, T. Chen, G. Wu and Y. S. Zhou, Beijing Daxue Xuebao, Yixueban, 2016, 48, 37–44 CAS.
- Y. K. Wang, X. Yu, D. M. Cohen, M. A. Wozniak, M. T. Yang, L. Gao, J. Eyckmans and C. S. Chen, Stem Cells Dev., 2012, 21, 1176–1186 CrossRef CAS PubMed.
- R. Aquino-Martinez, N. Artigas, B. Gamez, J. L. Rosa and F. Ventura, PLoS One, 2017, 12, e0178158 Search PubMed.
- V. Gopalakrishnan, R. C. Vignesh, J. Arunakaran, M. M. Aruldhas and N. Srinivasan, Biochem. Cell Biol., 2006, 84, 93–101 CrossRef CAS PubMed.
- R. Olivares-Navarrete, P. Raz, G. Zhao, J. Chen, M. Wieland, D. L. Cochran, R. A. Chaudhri, A. Ornoy, B. D. Boyan and Z. Schwartz, Proc. Natl. Acad. Sci. U. S. A., 2008, 105, 15767–15772 CrossRef CAS PubMed.
- M. Lai, Z. Jin, Q. Tang and M. Lu, Journal of biomaterials science. Polymer edition, 2017, 1–15, DOI:10.1080/09205063.2017.1342334.
- C. Kilic, E. G. Gulec Peker, F. Acarturk, S. M. Kilicaslan and S. Coskun Cevher, Colloids Surf., B, 2013, 112, 499–507 CrossRef CAS PubMed.
- W. Xie, P. Xu and Q. Liu, Bioorg. Med. Chem. Lett., 2001, 11, 1699–1701 CrossRef CAS PubMed.
- H. Tomida, T. Fujii, N. Furutani, A. Michihara, T. Yasufuku, K. Akasaki, T. Maruyama, M. Otagiri, J. M. Gebicki and M. Anraku, Carbohydr. Res., 2009, 344, 1690–1696 CrossRef CAS PubMed.
- B. Gullon, M. I. Montenegro, A. I. Ruiz-Matute, A. Cardelle-Cobas, N. Corzo and M. E. Pintado, Carbohydr. Polym., 2016, 137, 382–389 CrossRef CAS PubMed.
- T. Matsuura, R. Hosokawa, K. Okamoto, T. Kimoto and Y. Akagawa, Biomaterials, 2000, 21, 1121–1127 CrossRef CAS PubMed.
- L. Di Silvio, M. J. Dalby and W. Bonfield, Biomaterials, 2002, 23, 101–107 CrossRef CAS PubMed.
- X. H. Feng and R. Derynck, Annu. Rev. Cell Dev. Biol., 2005, 21, 659–693 CrossRef CAS PubMed.
- J. B. Lian, G. S. Stein, A. Javed, A. J. van Wijnen, J. L. Stein, M. Montecino, M. Q. Hassan, T. Gaur, C. J. Lengner and D. W. Young, Rev. Endocr. Metab. Disord., 2006, 7, 1–16 CrossRef CAS PubMed.
- H. W. Choung, D. S. Lee, H. K. Lee, W. J. Shon and J. C. Park, Tissue Eng., Part A, 2016, 22, 93–102 CrossRef CAS PubMed.
Footnote |
| † These authors contributed equally to this work. |
| This journal is © The Royal Society of Chemistry 2018 |

