DOI:
10.1039/C7AY02334K
(Paper)
Anal. Methods, 2018,
10, 51-58
An electrochemiluminescence sensor based on CdSe@CdS functionalized MoS2 and hemin/G-quadruplex-based DNAzyme biocatalytic precipitation for sensitive detection of Pb(II)
Received
1st October 2017
, Accepted 21st November 2017
First published on 21st November 2017
Abstract
A novel electrochemiluminescence (ECL) biosensor based on CdSe@CdS quantum dots (QDs) functionalized MoS2 modified electrode was developed for sensitive detection of Pb(II) using HRP-mimicking DNAzyme biocatalytic precipitation (BCP) for ECL signal quenching. Polycationic poly(diallyldimethylammonium chloride) (PDDA) and negatively charged QDs were adsorbed on the surface of MoS2, in sequence, to form the MoS2–QDs composites, which were employed as a matrix for the immobilization of the G-rich DNA strand, i.e., T30695. The MoS2–QDs were characterized by UV-vis absorption spectroscopy, fluorescence spectroscopy, energy dispersive spectrometry, transmission electron microscopy, and field emission scanning electron microscopy. CdSe@CdS QDs can produce an ECL signal using 0.1 M K2S2O8 as a co-reactant. T30695 can combine with Pb(II) ions to form a stable parallel G-quadruplex. The G-quadruplex can further combine with hemin to form DNAzyme, which can catalyze H2O2 and oxidize 4-chloro-1-naphthol (4-CN) to produce an insoluble precipitation of benzo-4-chlorohexadienone on the surface of the sensor. When the concentration of Pb(II) in the solution was increased, more of DNAzyme was generated and subsequently more 4-CN molecules were oxidized catalytically, leading to a decrease of the ECL signal. Using this quenching strategy, the ECL signal of the biosensor was linearly dependent on the logarithm of the Pb(II) concentration ranging from 1.0 × 10⁻¹⁵ to 1.0 × 10⁻¹¹ M with a detection limit of 0.98 f M. The stability and selectivity of the sensor were also investigated. The sensor was applied in the determination of Pb(II) in the real water samples and satisfactory results were obtained.
1. Introduction
Lead is one of the highly toxic heavy metal.1 It has been used in various applications, such as batteries, food packaging, gasoline, and cosmetics.2 Pb(II) is harmful to the nervous, digestive, and blood system, particularly for children whose brain systems are in the sensitive period. The United States Environmental Protection Agency (EPA) defines that the maximum contamination level (MCL) of Pb(II) in drinking water is no more than 72 nM.1 Over the past few years, numerous methods have been devised for detecting Pb(II), such as atomic absorption spectrometry,3 atomic emission spectrometry,4 mass spectrometry,5 fluorescence spectroscopy,6–8 colorimetry,9,10 and surface plasmon resonance.11 However, these traditional methods have some disadvantages, such as the involvement of time-consuming steps, use of expensive equipment, and a high consumption of reagents.12 Some electrochemical methods of determining Pb2+ such as electrochemical13,14 and electrochemiluminescent15,16 methods have been reported.
In the recent years, graphene-like two-dimensional layered nanomaterials (such as MoS2 and WS2) have attracted increasing attention because of their particular physical, optical, and electronic properties.17 As lamellar molybdenum disulfide possesses a large specific surface area and a good biocompatibility, it has been used in the preparation of electrochemical sensors.
A biocatalytic precipitation (BCP) procedure can produce a nonconductive insoluble product on the electrode surface and the insoluble precipitation can block the electron transfer process of the redox probes, such as Fe(CN)63−/Fe(CN)64−.18 This method has been employed as a preferred approach for lowering the detection limit in the biochemical analysis.19,20 Moreover, the BCP technique could effectively quench the ECL intensity.21 The G-quadruplex/hemin system (DNAzyme), which consists of G-rich DNA sequence and some metal ions to form parallel, antiparallel or heterozygous G-quadruplex and the embed hemin as a cofactor, possesses a peroxidase-like activity.22 T30695, containing G-rich DNA sequence, could make up a stable parallel G-quadruplex with Pb(II) even in the existence of K(I) and has a stronger affinity to hemin than other forms of G-quadruplex. The G-quadruplex can further combine with hemin to form HRP-mimicking DNAzyme.23 Although the catalytic activity of the DNAzyme is lower than that of native HRP, DNAzyme is easier to be synthesized, less expensive, and more stable. This type of DNAzyme can catalyze the H2O2-mediated oxidative reactions to produce fluorescent signals24 and has been widely used in sensor design25 to improve the sensitivity of DNAzyme-based sensors. Recently, it has been found that hemin-binding DNAzyme can catalyze the oxidation reaction of H2O2 towards 4-chloro-1-naphthol (4-CN). An insoluble precipitation, therefore, can be produced on the surface of the sensor to amplify the signal of detecting Cu2+.20
Most recently, our group devised a novel strategy based on DNAzyme for electrochemiluminescence (ECL) detection of Pb(II) using a composite, which was prepared with graphene oxide, poly(diallyldimethylammonium chloride) (PDDA), and CdS quantum dots (QDs) for signal amplification.26 Herein, we constructed an electrochemiluminescent biosensor for the detection of Pb(II) with the integration of HRP-mimicking DNAzyme catalyzing BCP. Polycationic poly(diallyldimethylammonium chloride) and negatively charged QDs were adsorbed on the surface of MoS2, in sequence, to form the MoS2–QDs composites, which were employed as a matrix for the immobilization of the guanine-rich DNA strand, i.e., T30695. T30695 can combine with Pb(II) ions to form a stable parallel G-quadruplex. A G-quadruplex DNAzyme, which was formed by G-quadruplex and intercalated hemin, can catalyze H2O2 and oxidize 4-chloro-1-naphthol (4-CN) to produce an insoluble precipitation of benzo-4-chlorohexadienone on the surface of the sensor to significantly cause the ECL quenching. Therefore, the ECL intensity of the biosensor to Pb(II) would decrease with the increase in the Pb(II) concentration. By monitoring the change in the ECL response, we could quantitatively determine the concentration of target Pb(II) in the water samples.
2. Experimental
2.1 Reagents and apparatus
Poly(diallyldimethylammonium chloride) was purchased from Sigma-Aldrich (USA). Hemin was purchased from Aladdin Shanghai Biochemical Technology (China). Bovine serum albumin (BSA), SeCl2, CdCl2, MoS2, mercaptopropionic acid (MPA), and 4-chloro-1-naphthol were purchased from J & K Technology Co. Ltd. (China). N-Hydroxysuccinimide (NHS) and ethyl-(3-methyl-propyl)carbodiimide amine hydrochloride (EDC) were purchased from Sinopharm chemical reagent Co., Ltd. NaBH4, Na2HPO4·12H2O, NaH2PO4·2H2O, FeCl2·4H2O, MnCl2·4H2O, KCl, HgCl2, CuCl2, NaCl, PbCl2, CrCl3, BaCl2, AgCl, CaCl2, and H2O2 were purchased from Tianjin Fu Chen Chemical Reagent Corporation (China). All chemicals were analytical reagent-grade materials. All solutions were prepared with ultrapure water (Milli-Q Advantage A10 Water Purification System, Millipore Corporation, France).
The labeled DNA oligonucleotides were synthesized by Shanghai Sangon Biological Engineering Technological Co. Ltd. (China). The base sequence of T30695 is as follows:27
T30695: 5′-NH2-AAA AAA GGG TGG GTG GGT GGG T-3′
The electrochemical measurement for ECL was carried out on an MPI-A detection system (Xi'an Rimax Electronics Co., Ltd. China) with a three-electrode system and a photomultiplier tube. The voltage was set at 600 V. A glassy carbon electrode (GCE, Φ = 3 mm) was used as a working electrode; a platinum wire and an Ag/AgCl (saturated KCl solution) were used as a counter electrode and a reference electrode, respectively. Transmission electron microscope (TEM) image was obtained using a JEM2011 (JEOL Co. Ltd., Japan). UV-vis absorption spectra were recorded with a Model 2450 UV-vis photospectrometer (Shimadzu Co. Ltd., Japan). A Centrifuge 5418 centrifugation system (Eppendorf China Ltd) was used for centrifugation.
2.2 Preparation of MPA-CdSe@CdS QDs and MoS2-PDDA-CdSe@CdS QDs
The MPA-capped core–shell CdSe@CdS QDs were synthesized using a method reported in the literature.28 Briefly, 0.3 mL MPA was added to 100 mL of a 2 × 10⁻² M CdCl2 solution. The pH value of the solution was adjusted to 10.64 through the dropwise addition of 1 M NaOH solution under stirring. Then, 0.0333 g SeO2 and 0.0113 g NaBH4 were added to the above solution. After stirring for five minutes, 5 mL of a freshly prepared Na2S solution of 4 × 10⁻⁴ M was added to the solution. The typical molar ratio of Cd2+![[thin space (1/6-em)]](https://www.rsc.org/images/entities/char_2009.gif) :Se2−:S2−:MPA was 1:0.15:0.2:2.14. The mixed solution was heated to 100 °C in a reactor and maintained at this temperature for 9 h. The obtained QDs solution was preserved in a refrigerator at 4 °C.
:Se2−:S2−:MPA was 1:0.15:0.2:2.14. The mixed solution was heated to 100 °C in a reactor and maintained at this temperature for 9 h. The obtained QDs solution was preserved in a refrigerator at 4 °C.
The preparation of MoS2-PDDA-CdSe@CdS QDs is based on the reported approach with some modifications.29 Initially, 1 mg MoS2 was dispersed in 10 mL ultrapure water and sonicated for 1 h. MoS2 was functionalized with PDDA according to the following procedures: 10 mL of a MoS2 suspension (0.1 mg mL−1) was mixed with 500 μL of a 17.2% PDDA solution and sonicated for 1 h to give a homogeneous composite. After being centrifugated for 20 min at 5000 rpm, the composite was washed with ultrapure water for at least three times to remove the redundant PDDA and redispersed in 2 mL water. CdSe@CdS QDs solution (6 mL) was added dropwise into 2 mL of the MoS2-PDDA suspension and stirred at room temperature for 24 h to form the MoS2-PDDA-CdSe@CdS QDs nanocomposite. The composite was centrifuged for 20 min and washed with ultrapure water for at least three times. Finally, the MoS2-PDDA-CdSe@CdS QDs nanocomposite was redispersed in ultrapure water and stored at 4 °C before use.
2.3 Fabrication of ECL biosensor for Pb(II)
The self-assembly procedure for fabrication of the biosensor was described in Scheme 1. A glassy carbon electrode was polished with 0.05 μm alumina powder, then washed with ultrapure water, ethanol, and ultrapure water for 3 min, and dried with high purity N2. The GCE electrode was immersed in a 0.5 M H2SO4 solution and the potential scanning by cyclic voltammetry was performed in a potential range of −0.3 to 1.5 V for 20 cycles, washed with ultrapure water, and dried with high purity N2. First, 10 μL of MoS2-CdSe@CdS QDs was poured on the surface of the precleaned GCE electrode and dried. This electrode was denoted as MoS2-CdSe@CdS/GCE. The modified electrode was immersed in 200 μL 0.1 M pH 7.4 phosphate buffer solution (PBS) containing 0.01 M EDC and 0.005 M NHS solution for 30 min to activate the terminal carboxylic acid group of QDs, followed by thorough rinsing with 5 mM PBS to remove the excess EDC and NHS. T30695 could immobilize onto the surface of the MoS2-CdSe@CdS QDs composite via the interaction between the activated carboxylic acid group and the amino group of T30695. The electrode was incubated for 2 h at 37 °C and rinsed with 5 mM pH 7.4 PBS. Then, the electrode was immersed in 1% (w/v) BSA for 60 min to block the non-specific binding sites and washed with 5 mM pH 7.4 PBS. The modified electrode was denoted as T30695/MoS2-CdSe@CdS/GCE.
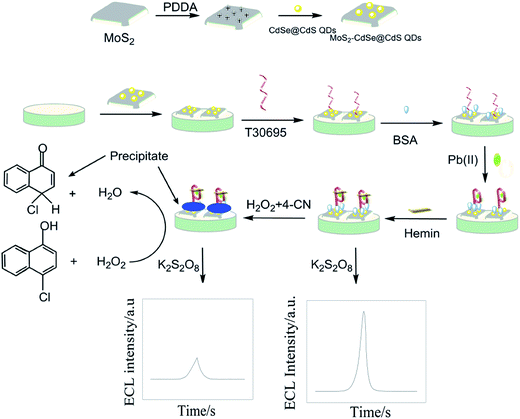 |
| | Scheme 1 Fabrication process and the determination mechanisms of the electrochemiluminescence sensor. | |
2.4 Determination for Pb(II)
The T30695/MoS2-CdSe@CdS/GCE electrode was immersed in a solution of different concentrations of Pb(II) at 37 °C for 60 min to form G-quadruplex and washed thoroughly again with 5 mM pH 7.4 PBS. Then, the electrode was immersed into 0.1 mM hemin for 30 min to form DNAzyme and washed thoroughly with 5 mM pH 7.4 PBS. The electrode was denoted as DNAzyme/T30695/MoS2-CdSe@CdS/GCE. Finally, the modified electrode was incubated at 25 °C in a 1 mM 4-CN solution containing 0.15 mM H2O2 for 15 min. The prepared electrode was denoted as 4-CNox/DNAzyme/T30695/MoS2-CdSe@CdS/GCE, where 4-CNox is a 4-CN oxidation product, 4-chloro-1-naphthoquinone. The ECL experiment was carried out in 0.1 M PBS (pH 7.4) containing 0.1 M K2S2O8. The potential window was from 0 to −1.5 V with a scan rate of 100 mV s−1. The ECL intensity was measured. The ECL intensity decreased with the increase of the Pb(II) concentration. The analysis was based on the change in the ECL intensity (I) before and after the Pb(II) solutions were applied to the surface of the working electrode at room temperature. In the absence of Pb(II), the ECL response was recorded as I0. In the presence of Pb(II), the reaction between T30695 and Pb(II) ions in the solution occurred to form G-quadruplex, the intercalated hemin can catalyze the oxidation of H2O2 towards 4-chloro-1-naphthol (4-CN) to produce an insoluble precipitation benzo-4-chlorohexadienone on the surface of the sensor, and the ECL response was recorded as Ip. The change in the ECL intensity is given by ΔI = I0 − Ip.
3 Results and discussion
3.1 Characterization of MPA-CdSe@CdS QDs and MoS2-PDDA-CdSe@CdS QDs
Fig. 1A shows the UV-vis absorption (Fig. 1A curve a) and the fluorescence spectra (Fig. 1A curve b) of the CdSe@CdS QDs solution. The wavelength of the maximum UV absorption peak of CdSe@CdS QDs was 403 nm and the wavelength of the maximum fluorescence peak appeared at 620 nm, which was consistent with the values reported in the literature.29Fig. 1B is the TEM image of CdSe@CdS QDs. The diameter of CdSe@CdS QDs, which was deduced from the TEM image, was in the range of 2–3 nm. Fig. 1C shows the energy dispersive spectroscopy (EDS) pattern of CdSe@CdS QDs, which detected the presence of sulfur, cadmium, and selenium.
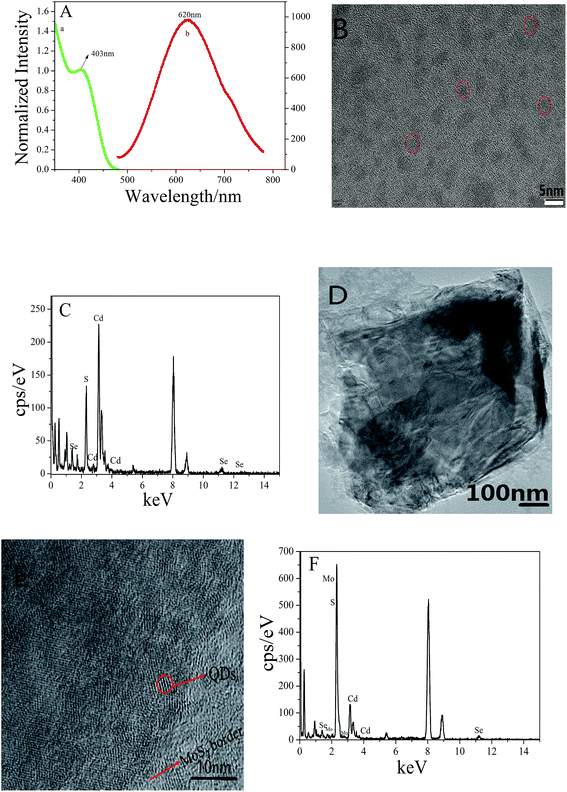 |
| | Fig. 1 (A) The UV/vis absorbance spectrum (a) and fluorescence spectrum (b) of CdSe@CdS QDs; (B) TEM image and (C) EDS pattern of CdSe@CdS QDs; TEM image of (D) MoS2 and (E) MoS2-CdSe@CdS QDs, and (F) EDS pattern of MoS2-CdSe@CdS QDs. | |
Fig. 1D shows the TEM image of MoS2, which indicated that MoS2 nanosheets have single or few layers and the surface is relatively smooth. It can be observed from Fig. 1E that there were numerous CdSe@CdS QDs, which were loaded on the surface of the MoS2 nanosheets. Fig. 1F shows the energy dispersive spectroscopy (EDS) pattern of MoS2-PDDA-CdSe@CdS QDs, which proved the successful formation of the composites.
3.2 ECL and electrochemical behaviors of the biosensor
The construction process of the biosensor was characterized by ECL. The ECL intensity versus time curves were obtained in the 0.1 M PBS containing 0.1 M K2S2O8, as shown in Fig. 2. The maximum value of the ECL intensity was obtained after the MoS2-PDDA-CdSe@CdS QDs was coated on the surface of GCE (Fig. 2A, curve a). After the modified electrode was anchored with T30695 (Fig. 2A, curve b) and blocked by BSA (Fig. 2A, curve c), the ECL intensity successively declined because the oligonucleotides and BSA, immobilized on the modified electrode, hindered the electron transfer. After the modified electrode was immersed into 1.0 × 10⁻¹¹ M Pb(II) and 200 μL 0.1 mM hemin solution, DNAzyme was formed on the electrode surface and the ECL intensity was decreased (Fig. 2A, curve d). This could be ascribed to the poor conductivity of DNAzyme. After the electrode was incubated in 1 mM 4-CN and 0.15 mM H2O2, an evident decrease in the ECL intensity was observed (Fig. 2A, curve e), because DNAzyme can catalyze the oxidation of H2O2 towards 4-chloro-1-naphthol (4-CN) to produce an insoluble precipitate of benzo-4-chlorohexadienone on the electrode surface. Due to the hydrophobicity of benzo-4-chlorohexadienone, the precipitate would be adsorbed onto the electrode surface by a hydrophobic force without being washed away. The insulating coverage layer could inhibit the transfer of the co-reactant K2S2O8 to the surface of the underlying CdSe@CdS QDs film, thus weakening the ECL emission. The possible ECL mechanisms are described as follows:30| | | QDs−* + S2O82− → SO4−* + SO42− | (2) |
| | | QDs−* + SO4−* → QDs* + SO42− | (3) |
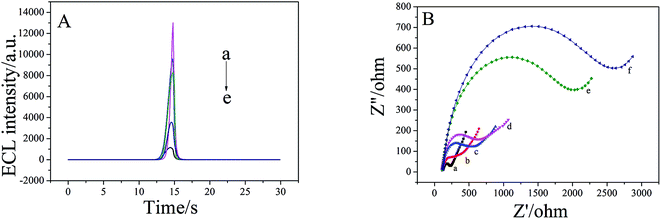 |
| | Fig. 2 (A) The electrochemiluminescence intensity of (a) MoS2-CdSe@CdS/GCE, (b) T30695/MoS2-CdSe@CdS/GCE, (c) BSA/T30695/MoS2-CdSe@CdS/GCE, (d) DNAzyme/BSA/T30695/MoS2-CdSe@CdS/GCE, and (e) 4-CNox/DNAzyme/BSA/T30695/MoS2-CdSe@CdS/GCE; (B) the electrochemical impedance spectra of (a) bared GCE, (b) MoS2-CdSe@CdS/GCE, (c) T30695/MoS2-CdSe@CdS/GCE, (d) BSA/T30695/MoS2-CdSe@CdS/GCE, (e) DNAzyme/BSA/T30695/MoS2-CdSe@CdS/GCE, and (f) 4-CNox/DNAzyme/BSA/T30695/MoS2-CdSe@CdS/GCE. | |
EIS was used to verify the stepwise modification process of the biosensor. A 5 mM K3[Fe(CN)6]/K4[Fe(CN)6] (1:1) mixture containing 0.1 M KCl was used as the redox probe at different stages. As shown in Fig. 2B, a small semicircle was observed due to a free electron-transfer process of the bare GCE (curve a). When the MoS2-PDDA-CdSe@CdS QDs were modified onto the GCE, a slight increase of Ret was found because of the low conductivity of the MoS2-PDDA-CdSe@CdS QDs composites (Fig. 2B, curve b). After T30695 was assembled and BSA was adsorbed on the modified electrode, in sequence, the value of Ret increased significantly (Fig. 2B, curve c and d). These phenomena could be attributed to the electrostatic repulsion of the negatively charged phosphate backbone of the oligonucleotides to the redox probe and the nonconductive properties of BSA immobilized on the modified electrode, which hindered the electron transfer. After the electrode was incubated with the Pb(II) and hemin (Fig. 2B, curve e), the Ret value increased apparently because the formed DNAzyme hindered the electron transfer of [Fe(CN)6]3−/4−. After it was incubated in 1 mM 4-CN solution containing 0.15 mM H2O2, the Ret value showed a significant increase (Fig. 2B, curve f), implying that the insoluble precipitation layer greatly prevented the diffusion of the redox probe to the electrode surface. The different electrochemical responses indicated that the biosensor was successfully fabricated.
3.3 Optimization of experimental conditions
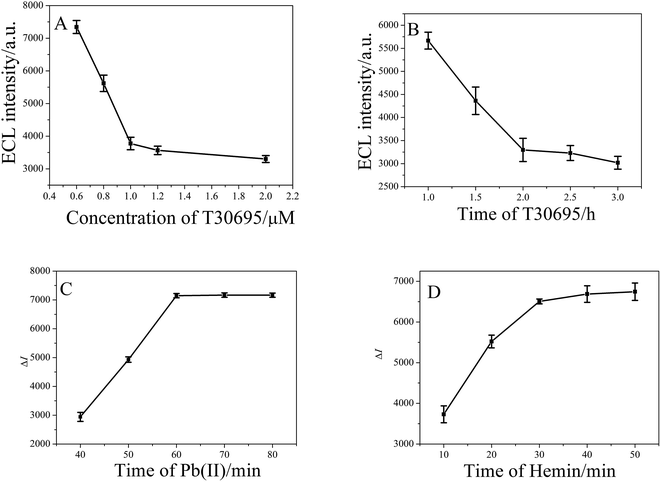
Fig. 3A shows the effects of the concentration of T30695 on the ECL intensity. The ECL intensity rapidly decreased with the increase in T30695 concentration until 1.0 μM of T30695 and then slightly decreased when the T30695 concentration was more than 1.0 μM because the oligonucleotides immobilized on the modified electrode hindered the electron transfer. These phenomena indicated that the amount of T30695 adsorbed on the electrode surface has almost reached saturation when the T30695 concentration was more than 1.0 μM. Thus, 1.0 μM T30695 was used in the subsequent experiments. Fig. 3B–D showed the effects of incubation time for the electrode incubated with 1.0 μM T30695, 5.0 × 10⁻¹² M Pb(II), and 0.1 mM hemin solution on the ECL intensity or ΔI, respectively. With longer incubating times, up to 2 h (Fig. 3B), the ECL intensity slightly decreased with the increase in the incubating time. As shown in the plots in Fig. 3C and D, the ΔI value sharply increased with the increase in the incubating time up to 60 min (Fig. 3C) and 30 min (Fig. 3D). With a longer incubating time, the slope quickly decreased. Therefore, the incubating time of 2 h, 60 min, and 30 min for T30695, Pb(II), and hemin was employed, respectively, in the subsequent experiments.
 |
| | Fig. 3 Effects of (A) T30695 concentration and (B) incubation time of 1.0 μM T30695 on the ECL intensity, and the effects of the incubation time of (C) 5.0 × 10⁻¹² M Pb(II) and (D) 0.1 mM Hemin on the ΔI value. | |
3.4 Calibration curve
Under the optimized experimental conditions, Fig. 4 displays the ECL response of the biosensor to different concentrations of Pb(II). In the absence of Pb(II), the background ECL intensity was recorded as I0. Then, the reaction between T30695 and Pb(II) ions in the solution occurred to produce G-quadruplex. In addition, the intercalated hemin can catalyze the oxidation of H2O2 towards 4-chloro-1-naphthol (4-CN) to produce an insoluble precipitate, benzo-4-chlorohexadienone, on the surface of the sensor; the ECL response was recorded as Ip. The difference of the ECL intensity (ΔI = I0 − Ip) was linearly increased with the increase in the logarithm of the Pb(II) concentration (c) over a range from 1.0 × 10⁻¹⁵ to 1.0 × 10⁻¹¹ M. The linear regression equation is ΔI = 25652 + 1621.6logc (M) with a correlation coefficient of γ = 0.9932. The detection limit of 0.98 fM can be estimated at a signal-to-noise ratio of 3. Compared with other previously reported methods, the proposed method exhibited a lower detection limit or/and a wider range of linear response (Table 1).
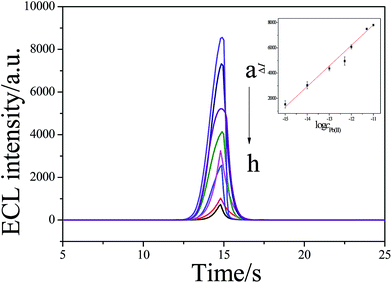 |
| | Fig. 4 The ECL intensity of the sensor incubated with different concentration of Pb(II) solution: (a) 0, (b) 1.0 × 10⁻¹⁵, (c) 1.0 × 10⁻¹⁴, (d) 1.0 × 10⁻¹³, (e) 5.0 × 10⁻¹³, (f) 1.0 × 10⁻¹², (g) 5.0 × 10⁻¹², (h) 1.0 × 10⁻¹¹ M Pb(II). Inset: calibration curve for Pb(II) detection. | |
Table 1 Comparison of the proposed sensor for ECL determination of Pb(II) with the othersa
| Methods |
Sensing probe |
Detection limit (mol L−1) |
Linear range (mol L−1) |
Ref. |
|
SWV, square wave voltammetry.
|
| Fluorescence |
Carbon dots |
5.9 × 10⁻¹⁰ |
10−8–10−6 |
9
|
| SWV |
Affinity peptide |
— |
1–107 |
11
|
| ECL |
Graphene QDs |
7 × 10⁻⁸ |
10−7–10−5 |
15
|
| ECL |
Ru(phen)32+ |
9 × 10⁻¹³ |
2 × 10⁻¹²–10−19 |
16
|
| ECL |
CdSe@CdS–4-CNox |
9.8 × 10⁻¹⁶ |
1.0 × 10⁻¹⁵–1.0 × 10⁻¹¹ |
This work |
3.5 Reproducibility and interferences
In this study, the fabrication reproducibility was estimated using five different electrodes produced by the same method. A solution containing 1.0 × 10⁻¹¹ M Pb(II) was determined by the five electrodes in the same electrochemical cell. The relative standard deviation (RSD) was 3.4%, which indicated that the reproducibility of the method was excellent. Fig. 5A shows the ECL intensity of an identical ECL biosensor for detecting 1.0 × 10⁻¹¹ M Pb(II) after continuous scanning for 10 cycles. The experimental results illustrated that the ECL response of the biosensor possessed a potential cycling stability. Moreover, the stability of the as-prepared biosensor was also evaluated and only a small decrease of the ECL sensitivity for 1.0 × 10⁻¹¹ M Pb(II) was observed after the biosensor was stored at 4 °C for 30 days. The experimental results demonstrated that the biosensor possessed a good stability. The specificity studies were carried out with inorganic species. No interference could be observed for the following materials: 10-fold quantity of Co(II), Cr(II), Cu(II), Fe(II), K(I), Mn(II), Na(I), Ca(II), and Ag(I), while Pb(II) concentration was 1.0 × 10⁻¹² M and 0 M. The experimental results indicated that the ECL biosensor possessed a good selectivity towards Pb(II).
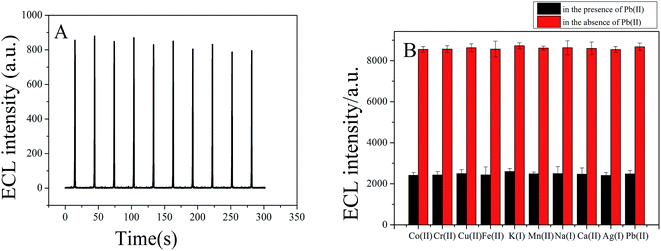 |
| | Fig. 5 (A) ECL intensity of the biosensor in the presence of 1.0 × 10⁻¹¹ M Pb(II) in 0.1 M PBS containing 0.1 M K2S2O8 under continuously cyclic scans for 10 cycles and (B) the ECL intensity of the biosensor in the solution with different species in the presence or absence of Pb(II). | |
3.6 Analysis of real samples
The real samples that were collected from Jingmi River were analyzed by the proposed ECL biosensor. The real water samples were filtered using a 0.45 μm ultra-filtration membrane to perform a pretreatment. No ECL response corresponding to Pb(II) was observed when the real water samples were analyzed. Therefore, different quantities of Pb(II) were added to the samples. The standard addition method was adopted to estimate the accuracy. Table 2 summarizes the result. As can be seen from Table 2, the recoveries are acceptable for all of the samples.
Table 2 Analysis of the Pb(II) concentrations in the real samples using the ECL biosensor
| Samples |
Added (M) |
Found (M) |
RSD (%) |
Recovery (%) |
| 1 |
1.00 × 10⁻¹² |
1.02 × 10⁻¹² |
3.19% |
102% |
| 2 |
1.00 × 10⁻¹³ |
0.96 × 10⁻¹³ |
2.10% |
96% |
4 Conclusions
A novel ECL biosensor for detecting Pb(II) was proposed based on hemin/G-quadruplex-based DNAzyme on the core–shell CdSe@CdS QDs. The hemin/G-quadruplex-based DNAzyme can trigger the formation of different amounts of insoluble products on the electrode by a biocatalytic precipitation reaction with the change of the Pb(II) concentration. Moreover, an efficient signal amplification was realized by CdSe@CdS QDs functionalized MoS2. The proposed biosensor displayed a lower detection limit and a wider linear range for the Pb(II) determination. Simultaneously, this developed method could be successfully applied to the determination of Pb(II) in the real samples.
Conflicts of interest
There are no conflicts to declare.
Acknowledgements
The authors thank the financial support from the Key Research Project of National Natural Science Foundation of China (No. 51638001), the Doctoral Fund of China Education Ministry (No. 20131103110011), and the Key Project of Beijing Natural Science Foundation (No. KZ201110005006).
References
- H.-B. Wang, L. Wang, K.-J. Huang, S.-P. Xu, H.-Q. Wang, L.-L. Wang and Y.-M. Liu, New J. Chem., 2013, 37(8), 2557–2563 RSC.
- D. Yang, X. Liu, Y. Zhou, L. Luo, J. Zhang, A. Huang, Q. Mao, X. Chen and L. Tang, Anal. Methods, 2017, 9(13), 1976–1990 RSC.
- C. D. Palmer, M. E. Lewis, C. M. Geraghty, F. Barbosa Jr and P. J. Parsons, Spectrochim. Acta, Part B, 2006, 61(8), 980–990 CrossRef.
- H. R. Badiei, C. Liu and V. Karanassios, Microchem. J., 2013, 108, 131–136 CrossRef CAS.
- V. Ettler, M. Mihaljevic and M. Komarek, Anal. Bioanal. Chem., 2004, 378(2), 311–317 CrossRef CAS PubMed.
- Y. Wen, C. Peng, D. Li, L. Zhuo, S. He, L. Wang, Q. Huang, Q.-H. Xu and C. Fan, Chem. Commun., 2011, 47(22), 6278–6280 RSC.
- A. Kumar, A. R. Chowdhuri, D. Laha, T. K. Mahto, P. Karmakar and S. K. Sahu, Sens. Actuators, B, 2017, 242, 679–686 CrossRef CAS.
- C.-L. Li, K.-T. Liu, Y.-W. Lin and H.-T. Chang, Anal. Chem., 2011, 83(1), 225–230 CrossRef CAS PubMed.
- A. R. Ferhan, L. Guo, X. Zhou, P. Chen, S. Hong and D.-H. Kim, Anal. Chem., 2013, 85(8), 4094–4099 CrossRef CAS PubMed.
- J. Yan and E. M. Indra, Anal. Chem., 2012, 84(14), 6122–6127 CrossRef CAS PubMed.
- G. Pelossof, R. Tel-Vered and I. Willner, Anal. Chem., 2012, 84(8), 3703–3709 CrossRef CAS PubMed.
- Y. Zang, J. Lei, Q. Hao and H. Ju, ACS Appl. Mater. Interfaces, 2014, 6(18), 15991–15997 CAS.
- W. Su, M. Cho, J.-D. Nam, W.-S. Choe and Y. Lee, Biosens. Bioelectron., 2013, 48, 263–269 CrossRef CAS PubMed.
- Y. Sun, H. Du, Y. Deng, Y. Lan and C. Feng, J. Solid State Electrochem., 2016, 20(1), 105–113 CrossRef CAS.
- Y. Dong, W. Tian, S. Ren, R. Dai, Y. Chi and G. Chen, ACS Appl. Mater. Interfaces, 2014, 6(3), 1646–1651 CAS.
- A. Gao, C.-X. Tang, X.-W. He and X.-B. Yin, Analyst, 2013, 138(1), 263–268 RSC.
- A. Splendiani, L. Sun, Y. Zhang, T. Li, J. Kim, C.-Y. Chim, G. Galli and F. Wang, Nano Lett., 2010, 10(4), 1271–1275 CrossRef CAS PubMed.
- F. Patolsky, M. Zayats, E. Katz and I. Willner, Anal. Chem., 1999, 71(15), 3171–3180 CrossRef CAS PubMed.
- H. C. Yoon, H. Yang and Y. T. Kim, Analyst, 2002, 127(8), 1082–1087 RSC.
- M. Xu, Z. Gao, Q. Wei, G. Chen and D. Tang, Biosens. Bioelectron., 2015, 74, 1–7 CrossRef CAS PubMed.
- J. Wang, W.-W. Zhao, C.-Y. Tian, J.-J. Xu and H.-Y. Chen, Talanta, 2012, 89, 422–426 CrossRef CAS PubMed.
- P. Travascio, Y. Li and D. Sen, Chem. Biol., 1998, 5(9), 505–517 CrossRef CAS PubMed.
- C. H. Chung, J. H. Kim, J. Jung and B. H. Chung, Biosens. Bioelectron., 2013, 41, 827–832 CrossRef CAS PubMed.
- H. Li, Q. Zhang, Y. Cai, D.-M. Kong and H.-X. Shen, Biosens. Bioelectron., 2012, 34(1), 159–164 CrossRef CAS PubMed.
- Q. Zhang, Y. Cai, H. Li, D.-M. Kong and H.-X. Shen, Biosens. Bioelectron., 2012, 38(1), 331–336 CrossRef CAS PubMed.
- H.-Y. Song, T.-F. Kang, M.-F. Jiang and S.-Y. Cheng, J. Electroanal. Chem., 2017, 801, 244–250 CrossRef CAS.
- F. Li, L. Yang, M. Chen, Y. Qian and B. Tang, Biosens. Bioelectron., 2013, 41, 903–906 CrossRef CAS PubMed.
- C. Zhou, Q. Chen, G. Wang, A. Guan, J. Xu, X. Liu, Z. Shi and L. Zhou, J. Photochem. Photobiol., A, 2017, 332, 251–257 CrossRef CAS.
- Y.-M. Liu, J.-J. Yang, J.-T. Cao, J.-J. Zhang, Y.-H. Chen and S.-W. Ren, Sens. Actuators, B, 2016, 232, 538–544 CrossRef CAS.
- J.-J. Zhang, T.-F. Kang, Y.-C. Hao, L.-P. Lu and S.-Y. Cheng, Sens. Actuators, B, 2015, 214, 117–123 CrossRef CAS.
|
| This journal is © The Royal Society of Chemistry 2018 |

 *,
Li-Ping
Lu
*,
Li-Ping
Lu


