An ionic liquid-magnetic graphene composite for magnet dispersive solid-phase extraction of triazine herbicides in surface water followed by high performance liquid chromatography
Hua
Zhang
a,
Yanan
Yuan
a,
Yunyun
Sun
a,
Can
Niu
*a,
Fengxia
Qiao
b and
Hongyuan
Yan
 *a
*a
aKey Laboratory of Medicinal Chemistry and Molecular Diagnosis, Ministry of Education & Hebei University, Baoding, 071002, China
bDepartment of Biochemistry, Baoding University, Baoding, 071000, China. E-mail: niucanwo@126.com; yanhy@hbu.edu.cn; Tel: +86-312-5079788
First published on 3rd November 2017
Abstract
A new ionic liquid-magnetic graphene (IL-MG) composite was used as the adsorbent in magnetic dispersive solid-phase extraction to rapidly extract and isolate triazine herbicides from surface water. IL-MG was synthesized by a simple and time-saving one-pot strategy where the synthesis of magnetic Fe3O4, the modification with an IL, and the reduction of graphene oxide to graphene were conducted at the same time. An IL was applied to enrich the interaction mechanism between IL-MG and analytes (π–π, hydrophobic interaction, and electrostatic interaction). Moreover, the IL and Fe3O4 nanoparticles acted as spacers, inserting between the layers of graphene to prevent the aggregation of graphene, which improved the adsorption ability because of the large specific surface area of IL-MG. The resultant IL-MG had hierarchical flake structures and showed a high adsorption capacity (8266.0–12![[thin space (1/6-em)]](https://www.rsc.org/images/entities/char_2009.gif) 324.1 μg g−1) toward triazine herbicides. Under suitable conditions, the linearity for triazine herbicides was achieved in the range of 0.55–500 ng mL−1 with a detection limit of 0.09–0.15 ng mL−1 and a quantitation limit of 0.31–0.51 ng mL−1, and the enrichment factor was 83-fold, which indicated that the proposed method could be successfully applied for the determination of triazine herbicides in surface water.
324.1 μg g−1) toward triazine herbicides. Under suitable conditions, the linearity for triazine herbicides was achieved in the range of 0.55–500 ng mL−1 with a detection limit of 0.09–0.15 ng mL−1 and a quantitation limit of 0.31–0.51 ng mL−1, and the enrichment factor was 83-fold, which indicated that the proposed method could be successfully applied for the determination of triazine herbicides in surface water.
Introduction
Triazine herbicides, one common type of herbicide with high activity to inhibit photosynthesis in plants or the germination of weeds, are widely used in agriculture to protect crops. The extensive use of triazine herbicides has led to their presence in the environment, such as surface water, soil, and so on.1,2 In view of their persistence, triazine herbicides and their metabolites can migrate from the environment into food chains, resulting in potential harm to human health.3,4 Some countries and regions have legislated to limit the levels of triazine residues. However, the amounts of the residues often exceed these levels because of insufficient control or monitoring. Therefore, it is necessary to develop a simple and effective method to detect triazine herbicides in environmental samples.5Several methods have been developed for determining triazine herbicides in various environmental matrices, including liquid chromatography,6 liquid chromatography-mass spectrometry,7 gas chromatography-mass spectrometry,8 and capillary electrophoresis.9 However, due to the low levels of analytes, sample pretreatment and enrichment processes were the most complex and crucial steps in the analytical procedures. Until now, the pretreatment methods associated with the isolation of triazine herbicides have mainly included solid-phase extraction (SPE),10–12 dispersive liquid–liquid microextraction,13 solid-phase microextraction (SPME),14 dispersant-assisted dynamic microwave extraction (DA-DME),15 and stir bar sorptive extraction.16 Among these methods, SPE is one of the most widely applied pretreatment techniques because of its high recovery, reproducibility, and simple operation. However, most of the SPE procedures are tedious, laborious, and time consuming, so the exploration of a simple and time-saving pattern of SPE is imperative.
As a new mode of SPE, magnetic dispersive solid-phase extraction (MDSPE) is performed under an external magnetic field without tedious centrifugation or filtration procedures.17–19 Magnetic adsorbents dispersed into the sample solution can increase the contact interface with analytes significantly, and this was beneficial to facilitate the mass transfer of analytes. Moreover, magnetic adsorbents can be easily retrieved, which makes the sample pretreatment procedure more convenient, time-saving, and economical.20
Graphene has a two-dimensional single-atom sheet structure and a high specific surface area, which make it possess excellent adsorption ability and become a promising candidate as an adsorbent.21–23 There has been an increasing application of magnetic graphene in MDSPE,24–26 because the composite materials combine the merits of magnetic adsorbents and graphene. However, graphene materials exhibit a tendency to agglomerate and have a single adsorption mechanism, indicating the limitation of their practical applications. Ionic liquids (ILs), composed of an organic cation and an organic or inorganic anion, exhibit beneficial characteristics, such as high chemical and thermal stability, negligible vapor pressure, non-flammability, and high ionic conductivity.27–29 Recently, an IL was introduced in the synthesis process of magnetic graphene to improve the adsorption capacity of the obtained materials and prevent aggregation, because the adsorption mechanism of IL-based materials usually involves multiple interactions, including electrostatic, π–π, hydrogen bonding, and ion exchange interactions, and the IL can enhance the dispersion stability of prepared materials in aqueous solution.30–32 However, the synthesis of magnetic graphene oxide and its subsequent modification are always completed step by step, which are complex and time consuming. Therefore, an easy and time-saving preparation strategy is yet to be developed.
In this work, a new IL-MG was synthesized by a simple and time-saving one-pot strategy where the synthesis of magnetic Fe3O4, the modification with an IL, and the reduction of graphene oxide (GO) to graphene were conducted at the same time to provide multiple binding sites. The IL-MG has hierarchical flake structures because the IL and Fe3O4 nanoparticles can act as spacers inserting between the layers of graphene and effectively enlarge the layer spacing. The proposed IL-MG-MDSPE method combines the excellent adsorption ability of IL-MG and the rapid extraction efficiency of MDSPE, which was successfully applied to rapidly isolate and analyze triazine herbicides from surface water.
Experimental
Chemicals and reagents
Cyanazine, ametryn and atrazine were purchased from Sigma-Aldrich Co., Ltd (St Louis, USA). 1-(3-Aminopropyl)-3-methylimidazolium chloride hydrochloride (ApMeIm+Cl−) was purchased from Shanghai Chengjie Chemical Co. Ltd (Shanghai, China). Graphite powder (500 mesh, 99.95%), iron(III) chloride hexahydrate (FeCl3·6H2O), iron(II) chloride tetrahydrate (FeCl2·4H2O), potassium hydroxide (KOH), potassium permanganate (KMnO4), hydrochloric acid (HCl), and hydrogen peroxide (H2O2) were purchased from Huadong Chemical Reagent Co. Ltd (Tianjin, China). Methanol, acetonitrile, acetone and trifluoroacetic acid (TFA) were obtained from Kermel Chemical Co., Ltd (Tianjin, China). Methanol (HPLC grade) was obtained from Xingke Biochemistry Co., Ltd (Shanghai, China). The water used was double-deionized and filtered with a 0.45 μm filter membrane.Instruments and conditions
HPLC analysis was performed by using an UltiMate 3000 equipped with a VWD-3100 UV-VIS detector (Thermo Fisher Scientific, Massachusetts, USA). The morphological evaluation was performed by using a Phenom Pro scanning electron microscope (SEM) (Phenom, Eindhoven, Netherland). The specific surface area was evaluated by using a TriStar II 3020 pore size and surface area analyzer (Micromeritics, Norcross, USA). The freeze dryer was purchased from SIM International Group (California, USA). The detection wavelength of the detector was set at 224 nm. The analytical column was purchased from Welch Materials, Inc. (Ultimate AQ-C18, 4.6 mm × 250 mm, 5 μm). The mobile phase was water-methanol (4![[thin space (1/6-em)]](https://www.rsc.org/images/entities/char_2009.gif) :
:![[thin space (1/6-em)]](https://www.rsc.org/images/entities/char_2009.gif) 6, v/v, containing 0.5% TFA) with a flow rate of 1.0 mL min−1.
6, v/v, containing 0.5% TFA) with a flow rate of 1.0 mL min−1.
Synthesis of IL-MG composite
Graphite powder (1.00 g) was added into 45 mL of H2SO4 with stirring in an ice-bath for 30 min. After dispersing sufficiently, 3.00 g of KMnO4 was added gradually, and the mixture was kept stirring for 24 h at room temperature. After that, 60 mL of water was slowly added in the ice-bath with stirring for 1 h. Then 3 mL of H2O2 was added to the mixture with stirring for 1 h. Finally, the mixture was washed with 5% HCl to remove metal ions, followed by washing with water to achieve pH 7, and graphite oxide was obtained.Graphite oxide (0.40 g) was dissolved in 320 mL of water under ultrasonication for 3 h to form a homogeneous dispersion. Then, ApMeIm+Cl− (1.60 g) was added and the mixture was sonicated for 20 min followed by adding FeCl2·4H2O (0.56 g) and FeCl3·6H2O (1.50 g). Then KOH (1.40 g) was dissolved in 2 mL of water and the solution was added dropwise to the above mixture solution, and then the mixture solution was stirred at 700 rpm for 24 h (80 °C). Subsequently, the obtained IL-MG was washed with water to achieve pH 7 and freeze-dried under vacuum.
Rebinding experiment: for static adsorption experiment, IL-MG (10 mg) was dispersed in 10 mL of mixed solution with a concentration of 1–20 μg mL−1. After being shaken for 24 h, the supernatant solution was collected by using a magnet and then filtered through a 0.45 μm filter membrane. The concentration of the supernatant solution was determined to calculate the adsorption capacity of IL-MG. For dynamic adsorption experiment, six parts of IL-MG (10 mg) were dispersed in 10 mL of mixed solution with a concentration of 20 μg mL−1, respectively. After being shaken for 1–12 h, the supernatant solution was collected at different times and filtered through a 0.45 μm filter membrane. The concentration of the supernatant solution was detected to evaluate the adsorption capacity of IL-MG.
Procedure of MDSPE
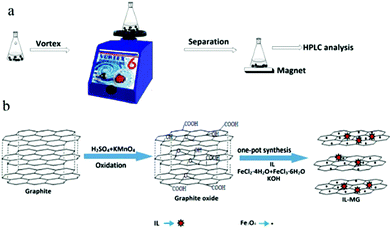
The procedure of MDSPE is illustrated in Fig. 1a. IL-MG (40 mg) was dispersed in a 100 mL conical flask and 50 mL of sample aqueous solution was added. After vortexing for 15 min, IL-MG was isolated with a magnet and then the supernatant solution was collected. Elution was performed with acetone (6 mL) by vortexing for 5 min. Subsequently, the eluate was collected and evaporated to dryness at 40 °C. Finally, the residues were re-dissolved with 0.6 mL of water-methanol (1![[thin space (1/6-em)]](https://www.rsc.org/images/entities/char_2009.gif) :
:![[thin space (1/6-em)]](https://www.rsc.org/images/entities/char_2009.gif) 5, v/v) for further HPLC analysis.
5, v/v) for further HPLC analysis.
Results and discussion
Synthesis of IL-MG composite
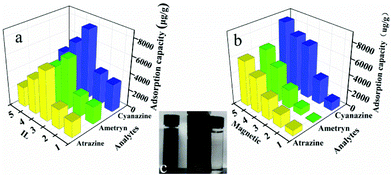
As shown in Fig. 1b, one-pot synthesis of IL-MG can avoid the tedious process where the synthesis of magnetic Fe3O4, the modification with an IL, and the reduction of GO to graphene were conducted simultaneously in the presence of KOH. The whole operation was easy and time-saving. The surface of GO possesses abundant active epoxy groups, which can undergo a ring-opening addition reaction with the amino groups (–NH2) of ApMeIm+Cl− under catalysis by KOH.33,34 As a result, Fe3O4 nanoparticles were doped in graphene sheets by the in situ ultrasonic-assisted co-precipitation of iron ions in alkaline solution in the presence of GO, and the IL was incorporated to the surface of graphene by covalent binding, not only enhancing the dispersion stability of the prepared materials in aqueous solution, but also improving the affinity with the analytes by providing multiple adsorption mechanism such as π–π interaction, electrostatic interaction, and ion exchange interaction. The IL and Fe3O4 nanoparticles were also able to alleviate the aggregation of graphene, because they can attach to graphene sheets serving as the spacer that effectively enlarged the layer spacing and significantly enhanced the extraction efficiency of the graphene-based composites.The effects of the amount of IL and Fe3O4 nanoparticles on the adsorption capacity were evaluated by performing MDSPE. Briefly, IL-MG (10 mg) was dispersed in 10 mL of mixed solution (atrazine, ametryn, and cyanazine) with a concentration of 25.0 μg mL−1. The supernatant solution was collected after vortexing (10 min) for HPLC analysis to detect the adsorption amount of the analytes. For IL-MG, the amount of IL is a key parameter to increase the adsorption capability. Fig. 2a shows that along with the increasing amount of IL, the adsorption capacity of the triazine herbicides increased and then decreased when the amount of IL was more than 1.60 g. The reason may be that the low amount of IL increased the dispersion stability of the prepared materials in aqueous solution for avoiding aggregation, but the excessive IL induced an increase in viscosity which was not conducive for the dispersion of graphene, therefore leading to the aggregation of graphene and affecting the interaction between IL-MG and analytes. In Fig. 2b, the function of Fe3O4 is presented. With the increase of magnetic quantities, the adsorption ability gradually weakened. The reason may be that excess amounts of Fe3O4 would cover the graphene sheets, reducing the surface area of graphene and affecting the adsorption property of IL-MG. However, if the amount of Fe3O4 is insufficient, the obtained magnetic intensity is weak, which makes no contribution to the rapid separation of the materials under an external magnetic field. The results indicated that FeCl2·4H2O (0.56 g), FeCl3·6H2O (1.50 g) and IL (1.60 g) were the optimal amounts to obtain the best extraction efficiency for IL-MG. Besides, Fig. 2c clearly shows that the well-dispersed IL-MG could be collected under a magnetic field within 60 s and redispersed quickly with a slight shake once the external magnetic field was removed. The excellent magnetic redispersibility made the IL-MG a promising candidate for practical applications in the MDSPE field.
Characterization of IL-MG and MG
The morphologies of IL-MG and MG were investigated by SEM, and the results are shown in Fig. 3. The SEM image of MG showed a compact block structure (Fig. 3b), while the introduction of the IL enabled IL-MG to obtain a porous structure (Fig. 3a). Besides, the hierarchical architecture of the thin layers of graphene can be observed in Fig. 3c. The SEM images illustrated that the IL existing between the graphene sheets effectively increased the dispersion stability of graphene, which contributed to the prevention of agglomeration. Meanwhile, the specific surface areas of IL-MG and MG were determined using the nitrogen adsorption test (BET). The specific surface areas of IL-MG and MG were 227 m2 g−1 and 131 m2 g−1, respectively. The IL can avoid the aggregation of graphene and increase the basal space between graphene sheets, so the specific surface area of IL-MG was larger than MG, improving the adsorption property of IL-MG. Fig. 3d shows the FT-IR spectra of MG and IL-MG. The adsorption peak at 580 cm−1 belonged to the Fe–O vibration, which implied that the Fe3O4 nanoparticles were successfully attached to IL-MG. The bands for the imidazole ring (1150 cm−1), N–H (1210 cm−1), and C–N (1580 cm−1) of the IL were observed, confirming the successful introduction of the IL into IL-MG.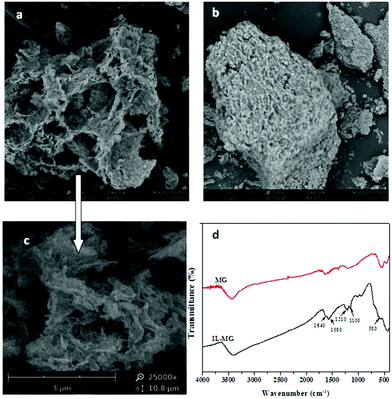 | ||
Fig. 3 Scanning electron micrograph of IL-MG (a, c), MG (b) (a: ×3500; b: ×3500; c: ×25![[thin space (1/6-em)]](https://www.rsc.org/images/entities/char_2009.gif) 000) and FT-IR spectra of MG and IL-MG (d). 000) and FT-IR spectra of MG and IL-MG (d). | ||
Adsorption characteristics of IL-MG
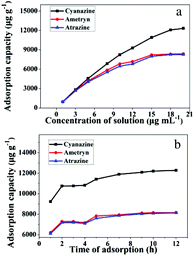
To demonstrate the adsorption ability of IL-MG, static adsorption experiment and dynamic adsorption experiment were conducted. The results of the static adsorption experiment (Fig. 4a) showed that the adsorption capacity of triazine herbicides increased along with the increasing concentration of analytes, and the adsorption capacity tended to saturate when the concentration of triazine herbicides was larger than 18.0 μg mL−1. The adsorption amounts of cyanazine, ametryn and atrazine were 12![[thin space (1/6-em)]](https://www.rsc.org/images/entities/char_2009.gif) 324.1, 8374.7 and 8266.0 μg g−1, respectively. The results of dynamic adsorption (Fig. 4b) showed that the adsorption capacity slightly increased after 2 h and tended to balance at approximately 7 h. Furthermore, two models Langmuir and Freundlich were used to analyze the equilibrium adsorption data. The Langmuir and Freundlich adsorption equations were calculated using eqn (1) and (2):
324.1, 8374.7 and 8266.0 μg g−1, respectively. The results of dynamic adsorption (Fig. 4b) showed that the adsorption capacity slightly increased after 2 h and tended to balance at approximately 7 h. Furthermore, two models Langmuir and Freundlich were used to analyze the equilibrium adsorption data. The Langmuir and Freundlich adsorption equations were calculated using eqn (1) and (2): | (1) |
 | (2) |
Herein, Ce is the equilibrium concentration of the analyte in solution (μg mL−1), Qe is the adsorption amount of the adsorbent at equilibrium (μg mg−1), Qm is the maximum adsorption capacity of the adsorbent (μg mg−1). b is the Langmuir adsorption equilibrium constant (mL μg−1), and KF and 1/n are the Freundlich characteristic constants. The parameters of Langmuir and Freundlich adsorption are shown in Table 1. The correlation coefficients for both Langmuir and Freundlich were close to 1, suggesting that the adsorption of analytes on IL-MG was both physical adsorption and chemical adsorption.35 For the Langmuir adsorption equilibrium of the three analytes on the IL-MG surface, the three correlation coefficients were all larger than 0.99 indicating that the adsorption was a monolayer process. The fit of the experimental isotherm data to the Langmuir equation (0.9960–0.9982) was closer to 1 than that to the Freundlich equation (0.9710–0.9792). Therefore, the Langmuir model represented the experimental data better on the basis of the values of correlation coefficient.36
| Analytes | Langmuir | Freundlich | ||||
|---|---|---|---|---|---|---|
| Q m (ng mL−1) | b | r | 1/n | K F | r | |
| Cyanazine | 13.63 | 1.08 | 0.9963 | 0.486 | 5.61 | 0.9766 |
| Ametryn | 8.98 | 1.16 | 0.9982 | 0.404 | 3.78 | 0.9710 |
| Atrazine | 9.01 | 0.89 | 0.9960 | 0.418 | 3.49 | 0.9792 |
Optimization of IL-MG-MDSPE method
The IL-MG possessed an aromatic ring and charged imidazole ring, so there were mainly three interactions (π–π, hydrophobic interaction, and electrostatic interaction) between triazine herbicides and IL-MG, which influenced the MDSPE process. In order to obtain optimum conditions for rapid isolation and extraction of triazine herbicides from the water sample, various parameters of MDSPE including the adsorbent amount, the adsorption and desorption time, and the kind and volume of elution solvent were investigated.Firstly, the amounts of IL-MG ranging from 10.0 to 60.0 mg were evaluated. IL-MG was dispersed in 50.0 mL of mixed standard solution (atrazine, ametryn, and cyanazine) with a concentration of 100 ng mL−1. The supernatant solution was collected after vortexing (10 min) for HPLC analysis to detect the loss of the analytes. As shown in Fig. 5a, the loss rate of triazine herbicides was progressively decreased from 10.0 to 40.0 mg of the adsorbent and then remained almost constant with a further increase of the amount of IL-MG. Consequently, 40.0 mg of IL-MG was used as the optimum amount for MDSPE. The adsorption time was evaluated by changing the vortexing time (1 to 30 min). Fig. 5b shows that IL-MG has a large adsorption capacity, and extraction equilibrium was attained rapidly within 15 min, so 15 min was selected as the adsorption time for further work.
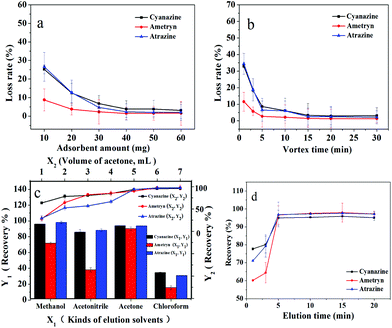 | ||
| Fig. 5 Optimization of MDSPE conditions: a: adsorbent amount; b: adsorption time; c: kinds and volume of elution solvents; d: desorption time. | ||
A suitable elution solvent should be utilized to elute the analytes from IL-MG and four types of elution solvents were evaluated by performing MDSPE, including methanol, acetonitrile, acetone, and chloroform. As shown in Fig. 5c, acetone can obtain the highest recovery for all three triazine herbicides. And the recoveries of the three triazine herbicides increased until the volume of acetone reached 6.0 mL and then remained unchanged. Hence, the optimal elution solvent was 6.0 mL of acetone. The effect of the desorption time on the recoveries of triazine herbicides was evaluated by changing the elution time (1 to 20 min). Fig. 5d shows that desorption equilibrium was attained rapidly within 5 min, so 5 min was selected as the desorption time for further work.
Validation of IL-MG-MDSPE method
The proposed IL-MG-MDSPE method was validated by linearity, precision, repeatability, limits of detection (LOD) and quantitation (LOQ), and intra-assay and inter-assay deviation as presented in Table 2. A calibration curve was constructed by least-squares linear regression analysis of the peak area and the concentration of triazine herbicides at seven increasing spiked levels in the range of 0.55–500 ng mL−1 with the correlation coefficient (r) ≥ 0.9996. Based on the signal-to-noise ratio of 3 and 10, the LOD and LOQ of the method for triazine herbicides were 0.09–0.15 ng mL−1 and 0.31–0.51 ng mL−1, respectively. The precision and accuracy were assessed by analyzing the spiked samples in the same day (n = 3) and three consecutive days (n = 3). The intra-assay and inter-assay precision expressed as relative standard deviations (RSDs) were 3.1–3.5% and 4.8–6.8%, respectively. To investigate the effect of the sample matrix on the accuracy of the IL-MG-MDSPE method for real samples application, recovery experiment was carried out by spiking three levels of triazine herbicides (1, 50, and 500 ng mL−1) into blank water samples. The results (Table 3) demonstrated that the recovery of the IL-MG-MDSPE method was 97.0–100.8% in surface water with RSDs ≤ 3.8%.| Analytes | Regression equation | r | Linearity | LOD | LOQ | RSDs (%) | |
|---|---|---|---|---|---|---|---|
| (ng mL−1) | (ng mL−1) | (ng mL−1) | Intra-day | Inter-day | |||
| Cyanazine | Y = 0.19x + 0.68 | 0.9998 | 0.55–500 | 0.15 | 0.51 | 3.1 | 6.8 |
| Ametryn | Y = 0.21x + 0.06 | 0.9998 | 0.55–500 | 0.09 | 0.31 | 3.4 | 5.1 |
| Atrazine | Y = 0.25x + 0.03 | 0.9996 | 0.55–500 | 0.12 | 0.39 | 3.5 | 4.8 |
| Analytes | 1 ng mL−1 | 50 ng mL−1 | 500 ng mL−1 | |||
|---|---|---|---|---|---|---|
| Recovery (%) | RSDs (%) | Recovery (%) | RSDs (%) | Recovery (%) | RSDs (%) | |
| Cyanazine | 98.8 | 3.2 | 97.0 | 3.1 | 100.8 | 2.0 |
| Ametryn | 97.5 | 3.7 | 100.1 | 3.4 | 99.2 | 1.9 |
| Atrazine | 100.1 | 3.8 | 100.7 | 3.5 | 99.8 | 1.6 |
Comparison of IL-MG-MDSPE with other methods
By considering the linear range, LOD, recovery, and RSD, the developed method was compared with the published methods for the extraction and determination of triazine herbicides. Compared with the reported methods in Table 4, the presented method had higher recovery, and a lower LOD and RSD which proved its better accuracy, sensitivity, and precision. Compared with other adsorbents, IL-MG has excellent adsorption ability and reaches adsorption equilibrium (15 min) and desorption equilibrium (5 min) in a short time. Besides, the analytes adsorbed on the surface of the IL-MG adsorbent can be easily isolated from the sample solution by using an external magnet, which reduced the pretreatment time and made the sample pretreatment procedure more convenient. These characters enabled IL-MG-MDSPE to become a simple and fast pretreatment method for the extraction and isolation of triazine herbicides from surface water.| Pretreatment method | Adsorbent | Linearity | LOD | Recovery (%) | RSD (%) | Ref. |
|---|---|---|---|---|---|---|
| SPE | Multiwalled carbon nanotubes | 0.50–80.0 ng mL−1 | 0.42–0.47 ng mL−1 | 88.0–124.0 | 7.6 | 8 |
| SPME | Ametryn-imprinted polymer | 100–5000 ng mL−1 | 14–74 ng mL−1 | 93.6–99.8 | 9.18 | 10 |
| SPE | Atrazine-imprinted polymer | 10.0–500.0 ng g−1 | 1.6–3.3 ng g−1 | 80.2–119.1 | 14.6 | 12 |
| DA-DME | Ethyl acetate | 10–100 ng mL−1 | 0.62–1.79 ng mL−1 | 84.3–101.0 | 6.2 | 15 |
| SPME | IL-calixarene-coated fibers | 25–5000 ng g−1 | 3.3–13.0 ng g−1 | 71.5–96.9 | 9.9 | 37 |
| SPE | Hollow molecularly imprinted microspheres | 0.5–250 ng g−1 | 0.08–0.16 ng g−1 | 81.0–96.0 | 9.8 | 38 |
| MDSPE | IL-MG | 0.55–500 ng mL−1 | 0.09–0.15 ng mL−1 | 97.0–100.8 | 3.8 | This work |
Assay of triazine herbicides in surface water
To evaluate the application of the presented IL-MG-MDSPE method, five surface water samples including river water, pond water, and farmland surface water were collected from a local city and processed under the optimized conditions. The chromatograms in Fig. 6a show that the proposed IL-MG-MDSPE has a good enrichment effect (83-fold) and there was no matrix interference at the retention time of triazine herbicides. In addition, the trace level of atrazine was detected in one of the farmland surface water samples (Fig. 6b). The result implied that the present IL-MG-MDSPE method was reliable for the extraction and determination of triazine herbicides from surface water.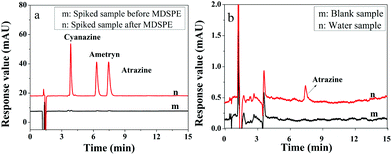 | ||
| Fig. 6 Chromatograms of the spiked sample before and after MDSPE (a) and real water sample after MDSPE (b). | ||
Conclusions
In the present work, IL-MG was synthesized by a simple and time-saving one-pot strategy wherein the tedious processes such as the synthesis of magnetic Fe3O4, modification with an IL, and reduction of GO to graphene were conducted at the same time. IL-MG exhibited excellent adsorption ability owing to these two reasons: (1) IL and Fe3O4 nanoparticles inserted between graphene sheets that effectively inhibited the stacking of graphene sheets and enlarged the surface area of graphene; (2) IL provided multiple binding sites between IL-MG and analytes (π–π, hydrophobic interaction, and electrostatic interaction). The IL-MG-MDSPE method combined the excellent adsorption ability of IL-MG and the rapid extraction efficiency of MDSPE, and was successfully applied to the rapid isolation and determination of the trace levels of triazine herbicides from surface water.Conflicts of interest
There are no conflicts to declare.Acknowledgements
This work was supported by the National Natural Science Foundation of China [21575033]; the Natural Science Foundation of Hebei Province [B2015201132, B2015104013]; the Natural Science Foundation of Education Department of Hebei Province [ZD2015036]; and the third graduate education and teaching reform program of Hebei University [Yjs2016-39].Notes and references
- A. C. F. Vida, D. J. Cocovi-Solberg, E. A. G. Zagatto and M. Miró, Talanta, 2016, 156–157, 71–78 CrossRef CAS PubMed.
- D. Chen, Y. Zhang, H. Miao, Y. Zhao and Y. Wu, J. Agric. Food Chem., 2015, 63, 9855–9862 CrossRef CAS PubMed.
- H. Geng, S. Miao, S. Jin and H. Yang, Anal. Bioanal. Chem., 2015, 407, 8803–8812 CrossRef CAS PubMed.
- T. Liu, P. Cao, J. Geng, J. Li, M. Wang, M. Wang, X. Li and D. Yin, Food Chem., 2014, 142, 358–364 CrossRef CAS PubMed.
- S. Y. Panshin, D. S. Carter and E. R. Bayless, Environ. Sci. Technol., 2000, 34, 2131–2137 CrossRef CAS.
- N. Rodríguez-González, E. Beceiro-González, M. J. González-Castro and M. F. Alpendurada, J. Chromatogr., A, 2016, 1470, 33–41 CrossRef PubMed.
- F. N. Andrade, Á. J. Santos-Neto and F. M. Lanças, J. Sep. Sci., 2014, 37, 3150–3156 CrossRef CAS PubMed.
- M. M. Sanagi, S. S. Muhammad, I. Hussain, W. A. W. Ibrahim and I. Ali, J. Sep. Sci., 2015, 38, 433–438 CrossRef CAS PubMed.
- A. A. Elbashir and H. Y. Aboul-Enein, Biomed. Chromatogr., 2014, 59, 570–576 Search PubMed.
- D. Djozan, M. Mahkam and B. Ebrahimi, J. Chromatogr., A, 2009, 1216, 2211–2219 CrossRef CAS PubMed.
- S. Xu, H. Lu and L. Chen, J. Chromatogr., A, 2014, 1350, 23–29 CrossRef CAS PubMed.
- F. N. Andrade, C. E. D. Nazario, Á. J. Santos-Neto and F. M. Lanças, Anal. Methods, 2016, 8, 1181–1186 RSC.
- M. M. Sanagi, H. H. Abbas, W. A. W. Ibrahim and H. Y. Aboul-Enien, Food Chem., 2012, 133, 557–562 CrossRef CAS PubMed.
- E. Turiel, M. Díaz-Álvarez and A. Martín-Esteban, J. Chromatogr., A, 2016, 1432, 1–6 CrossRef CAS PubMed.
- D. Li, Z. Zhang, N. Li, K. Wang, K. Zang, J. Jiang, A. Yu, H. Zhang and X. Li, Anal. Methods, 2016, 8, 3788–3794 RSC.
- Q. Zhong, Y. Hu, Y. Hu and G. Li, J. Sep. Sci., 2012, 35, 3396–3402 CrossRef CAS PubMed.
- A. Keramat and R. Zare-Dorabei, Ultrason. Sonochem., 2017, 38, 421–429 CrossRef CAS PubMed.
- M. Wierucka and M. Biziuk, TrAC, Trends Anal. Chem., 2014, 59, 50–58 CrossRef CAS.
- V. Singh, A. K. Purohit, S. Chinthakindi, D. G. Raghavender, V. Tak, D. Pardasani, A. R. Shrivastava and D. K. Dubey, J. Chromatogr., A, 2016, 1448, 32–41 CrossRef CAS PubMed.
- J. Wu, D. Xiao, H. Zhao, H. He, J. Peng, C. Wang, C. Zhang and J. He, Microchim. Acta, 2015, 182, 2299–2306 CrossRef CAS.
- L. Wang, M. Wang, H. Yan, Y. Yuan and J. Tian, J. Chromatogr., A, 2014, 1368, 37–43 CrossRef CAS PubMed.
- Y. Li, Z. Li, W. Wang, S. Zhong, J. Chen and A. Wang, J. Chromatogr., A, 2016, 1447, 17–25 CrossRef CAS PubMed.
- W. Fan, H. Man, L. You, X. Zhu, B. Chen and B. Hu, J. Chromatogr., A, 2016, 1443, 1–9 CrossRef CAS PubMed.
- Z. Liu, Y. Wang, R. Deng, L. Yang, S. Yu, S. Xu and W. Xu, ACS Appl. Mater. Interfaces, 2016, 8, 14160–14168 CAS.
- Y. Li, X. Wu, Z. Li, S. Zhong, W. Wang, A. Wang and J. Chen, Talanta, 2015, 144, 1295–1299 Search PubMed.
- E. Ziaei, A. Mehdinia and A. Jabbari, Anal. Chim. Acta, 2014, 850, 49–56 CrossRef CAS PubMed.
- H. Yan, C. Yang, Y. Sun and K. H. Row, J. Chromatogr., A, 2014, 1361, 53–59 CrossRef CAS PubMed.
- J. Wang, S. Huang, P. Wang and Y. Yang, Food Control, 2016, 67, 278–284 CrossRef CAS.
- R. Leyma, S. Platzer, F. Jirsa, W. Kandioller, R. Krachler and B. K. Keppler, J. Hazard. Mater., 2016, 314, 164–171 CrossRef CAS PubMed.
- H. Duan, X. Wang, Y. Wang, Y. Sun, J. Li and C. Luo, Anal. Chim. Acta, 2016, 918, 89–96 CrossRef CAS PubMed.
- M. Q. Cai, J. Su, J. Q. Hu, Q. Wang, C. Y. Dong, S. D. Pan and M. C. Jin, J. Chromatogr., A, 2016, 1459, 38–46 CrossRef CAS PubMed.
- E. Aliyari, M. Alvand and F. Shemirani, RSC Adv., 2016, 6, 64193–64202 RSC.
- C. Wang, B. Lin, G. Qiao, L. Wang, L. Zhu, F. Chu, T. Feng, N. Yuan and J. Ding, Mater. Lett., 2016, 173, 219–222 CrossRef CAS.
- J. Wu, H. Zhao, D. Xiao, P. H. Chuong, J. He and H. He, J. Chromatogr., A, 2016, 1454, 1–8 CrossRef CAS PubMed.
- H. L. Huang, X. H. Wang, H. Ge and M. Xu, ACS Sustainable Chem. Eng., 2016, 4, 3334–3343 CrossRef CAS.
- A. Afkhami, R. Moosavi and T. Madrakian, Talanta, 2010, 82, 785–789 CrossRef CAS PubMed.
- M. Tian, R. Cheng, J. Ye, X. Liu and Q. Jia, Food Chem., 2014, 145, 28–33 CrossRef CAS PubMed.
- Q. Zhao, H. Li, Y. Xu, F. Zhang, J. Zhao, L. Wang, J. Hou, H. Ding, Y. Li, H. Jin and L. Ding, J. Chromatogr., A, 2015, 1376, 26–34 CrossRef CAS PubMed.
| This journal is © The Royal Society of Chemistry 2018 |

