Dynamic characterization of drug resistance and heterogeneity of the gastric cancer cell BGC823 using single-cell Raman spectroscopy†
Yong
Zhang
 ab,
Ludi
Jin
c,
Jingjing
Xu
 c,
Yuezhou
Yu
c,
Lin
Shen
d,
Jing
Gao
d and
Anpei
Ye
c,
Yuezhou
Yu
c,
Lin
Shen
d,
Jing
Gao
d and
Anpei
Ye
 *ac
*ac
aKey Laboratory for the Physics and Chemistry of Nanodevices, School of Electronics Engineering and Computer Science, Peking University, No. 5 Yiheyuan Road, Beijing, P. R. China. E-mail: yap@pku.edu.cn.
bBeijing Institute of Biomedicine, No. 15 Xinjiangongmen Road, Beijing, P. R. China
cAcademy for Advanced Interdisciplinary Studies, Peking University, No. 5 Yiheyuan Road, Beijing, P. R. China
dKey Laboratory of Carcinogenesis and Translational Research, Department of Gastrointestinal Oncology, Peking University Cancer Hospital & Institute, No. 52 Fucheng Road, Beijing, P. R. China
First published on 7th November 2017
Abstract
Drug resistance and heterogeneous characteristics of human gastric carcinoma cells (BGC823) under the treatment of paclitaxel (PTX) were investigated using single-cell Raman spectroscopy (RS). RS of normal and drug-resistant BGC823 cells (DR-BGC823) were collected and analyzed using arithmetic, statistic and individual spectrum analysis. The dynamic effects of paclitaxel (PTX) in normal and DR-BGC823 cells were evaluated dynamically. The RS intensity changed with PTX over time and produced distinct different results for the two types of cells. The average RS intensities of the normal BGC823 cells initially decreased and then increased under PTX treatment after 24 hours. In contrast, upon exposure to PTX, the average intensity of the DR-BGC823 cells initially increased within 12 hours and then gradually decreased and approached a steady state. The temporal variation of the typical component in the cells was analyzed by comparing the ratios between Raman bands. More importantly, the heterogeneous characteristics of the BGC823 cells under PTX treatment were quantified and clustered using hierarchical trees combined with RS intensity changes. The ‘outlier’ cells related to drug resistance were discriminated. The heterogeneity of the normal BGC823 cells under drug treatment gradually appeared over time, and was evaluated with the eigenvalues of principal component analysis (PCA). Our study indicates that single-cell RS may be useful in systematically and dynamically characterizing the drug response of cancer cells at the single-cell level.
Introduction
Raman spectroscopy (RS) is an optical modality that can provide detailed quantitative chemical information of a cell or tissue of interest. Recently, RS has been used to study the processes of a single cell and provide discerning and screening information of individual cells.1–3 RS does not require fluorescent tags to study cells, and it can capture cellular functions while cells remain unaltered during observation. The latter advantage allows RS to perform the repetitive monitoring of dynamic events in the same cell if experimental conditions are optimized to avoid cell damage (e.g. laser wavelength and power).4–7 Therefore, RS is suitable for a variety of biological applications, especially for those requiring the characterization of cellular biochemistry. RS has been used widely to reveal cellular dynamic process variations by spectral changes such as altered peak intensities and shifts.8–10To understand cellular responses to xenobiotics, methods on the single-cell scale could elucidate the dynamic mechanisms of drug action, predict potential side effects, and assist personalized therapy. While the conventional bulk experiments provide average information of a number of cells, they cannot detect the detailed dynamic processes of individual cells. Recently, single-cell RS has been proposed to evaluate cytotoxicity and cellular activity by spectral intensity variation, which showed that the RS intensity of drug-treated cells was significantly different from the RS intensity of non-treated cells. This can be a sensitive biomarker for the quantitative evaluation of drug effects. Jung's group evaluated the cytotoxicity in L929 fibroblast cells treated with a commercial coal tar product.11 Buckmaster's group exposed human medulloblastoma (DAOY) cells to etoposide.12 Yao and colleagues studied the apoptosis of human gastric carcinoma cells treated with 5-flurouracil.13 Huang's group studied the apoptosis of nasopharyngeal carcinoma C666 cells induced with cisplatin.14 These studies suggested that all peaks were significantly decreased when the cells were treated with toxic drugs as compared to control cells and that the spectrum is significantly changed as a result of drug treatment, and both protein denaturation and DNA degradation related to the apoptosis could be evaluated with RS intensity variation and the results from this method concurred with the traditional cytotoxicity assays.11 In toxicology, different types of cell deaths are often defined by morphological criteria. Anticancer drugs induce the necrosis of tumor cells which is really complicated, and mainly involves oncosis (cell injury characterized by cytoplasmic swelling and karyolysis) and apoptosis (cell injury characterized by cytoplasmic shrinkage and karyorrhexis).15,16 Oncosis is a form of accidental cell death, and is morphologically characterized by a gain in cell volume, swelling of organelles, plasma membrane rupture and subsequent loss of intracellular contents.17,18 Apoptosis is a form of programmed cell death and involves a series of cell shrinking processes, beginning with cell size reduction and pyknosis, followed by cell budding and karyorrhexis.16,17 Chemotherapeutic drug induced cancer cell death often shows typical morphological features of oncosis, which could be reflected quantitatively through RS intensity changes. Moreover, RS offered label-free and non-contact rapid identification of the biochemical changes of the cells which is quick, of low-interference, and has minimal sample requirements.
Gastric cancer is a common malignant tumour and it is one of the most prevalent cancers in Asia. Paclitaxel (PTX) has often been prescribed to treat gastric, ovarian, breast, lung, and even cerebral cancers. However, tumours often become resistant to PTX or multiple drugs via multiple drug resistance (MDR) mechanisms.19 After consecutive treatments with PTX, there is a lack of efficacy resulting in treatment failure eventually. MDR is closely related to the heterogeneous characteristics of the cells. Cell culture and chemosensitivity tests such as the methyl thiazol tetrazolium (MTT) colorimetric assay20 have been proposed to study the dynamic responses of the chemotherapy of tumour cells. But cellular heterogeneity exists widely in tumour cells, and some minor types are related intimately to drug resistance.9,21 The individual information of cells is swamped in ensemble analysis. Proteomic studies with isolated cells have also been conducted,22 but this method is too complicated and time-consuming to observe cells efficiently. Single cell RS with appropriate metrics could accurately reveal the dynamic responses of the exposure of cells to drugs, and individual cellular responses to anti-cancer drugs could be identified on the single-cell scale. There is a shortage of pragmatic methods to quantitatively describe the heterogeneous characteristics of tumour cells under drug treatment. The advantage of RS is that it likely improves the accuracy of drug sensitivity testing. Accordingly, single-cell RS may provide a sensitive and convenient analysis for studying cancer cell drug resistance and its heterogeneity.
Here, we propose to apply single-cell RS to compare the spectral intensity of normal BGC823 and drug-resistant (DR-) BGC823 gastric cancer cells treated with PTX to describe the drug-resistance of tumour cells. Cell dynamic activity is quantified via the variation of RS peak intensity. Normal and drug resistant tumour cells showed different variation tendencies. The compositional changes of normal and DR-BGC823 cells under drug treatment had also been studied by comparing the variation of the ratios between Raman bands of the same cell. Besides the statistical average information, differences among individual cells are observed. These differences were quantitatively evaluated by using hierarchical trees combined with RS intensity changes. The ‘outlier’ cells related to drug resistance were also distinguished and analysed. The heterogeneous characteristics of normal BGC823 cells under PTX treatment can also be quantitatively measured using the eigenvalues of principal component analysis (PCA). These RS analytical methods provide a unique and effective tool for studying the interaction of anti-cancer drugs with cancer cells and cellular heterogeneity under drug treatment. This may be useful for revealing the mechanism of drug resistance and screening appropriate drugs for individualized cancer therapy.
Materials and methods
Confocal Raman spectroscopy
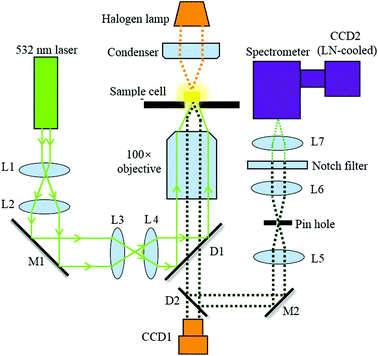
Fig. 1 illustrates the optical configuration of the back-scattering RS system, which has been described previously.23,24 A single laser beam at a wavelength of 532 nm from a continuous wave laser diode (Excelsior-532-200, Spectra-Physics) was coupled into an inverted microscope (Axiovert 200, Zeiss). This was used to generate RS at the cell. The exciting laser is directed to the microscope via dichroic mirrors (D1) and coupled into the objective (N-Achroplan 100×/1.25 Oil M27, Zeiss, Germany) with a free working distance of 0.29 mm. The back scattering Raman light is collected by using the same objective and then delivered into the spectrometer (SpectraPro2300i, 1200 g mm−1 blazed at 500 nm, Acton Research Co.) via a dichroic mirror (D2). A pinhole with a diameter of 100 μm was used to create a confocal system. A notch filter (532 nm, Thorlabs) is placed before the entrance of the spectrometer to filter the Rayleigh scattered light from the sample. RS is finally performed using a liquid nitrogen (LN)-cooled spectroscopic CCD (CCD2, Scientific Spec-10, PI).Cell culture
The human BGC823 gastric carcinoma cells used in the experiment were provided by Beijing Cancer Hospital. BGC823 cells have dense cellular surface microvilli and a large nucleus. PTX-resistant BGG823 cells (DR-BGC823) were derived from the normal BGC823 by stepwise sequential exposure to increasing concentrations of PTX. After cultured for 6–10 months, the DR-BGC823 cells could stably survive in 300 ng mL−1 PTX.25 Prior to the experiments, the normal and DR-BGC823 cells were maintained in culture with RPMI-1640 medium (Macgene, China) supplemented with 10% fetal bovine serum (Tianhang Biological Technology Co. Ltd, China) at 37 °C, and a relative humidity of 95%, with 5% CO2.PTX treatment of BGC823 cells
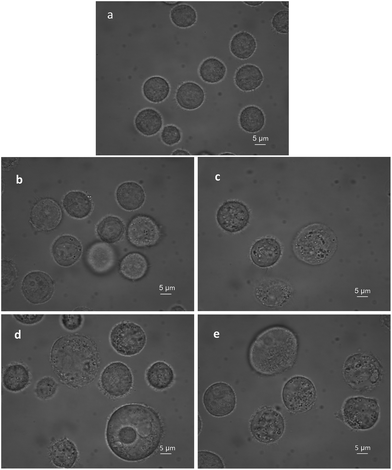
The BGC823 cells cultured from one passage and in the logarithmic growth phase were transferred to culture plates and incubated at 37 °C and 5% CO2 before RS measurements. After the cells grew to 50% confluence, PTX was added to the plate and blended. The control groups were not treated with PTX. Both drug-exposed cells and control cells were incubated under the same conditions during the experiment (with RPMI-1640 medium and fetal bovine serum). Before RS measurement, 0.25% trypsin (Macgene, China) was added to remove the cells. Then, 2 ml complete medium was added to terminate the digestion. Cells were transferred via a pipette to phosphate buffered saline (PBS) to make a 10 ml solution. Then these were transferred to a 15 ml centrifuge tube and washed three times and centrifuged at 1000 rpm (800g). Dead and disrupted cells were removed during washing, which ensures that all the cells for the RS measurement were alive. Supernatants were discarded after the final wash, and post-centrifugation cells were diluted in 5 ml PBS and mixed well. Finally, 80 μl of each group was subjected to RS measurements. Fig. 2 shows that PTX induced BGC823 cell death with the typical morphological features of oncosis.RS measurements
A special sample chamber was designed to collect RS signals with a high signal-to-noise ratio. A cleaned quartz cover slip (CFS-1010, UQG Ltd, England, thickness 0.1 mm) was fixed at the bottom of the chamber (top diameter 8 mm, bottom diameter 6 mm, and depth 2 mm). Another cover slip was placed on top of the cell during the experiment to prevent evaporation and contamination. Washed and rinsed cell samples diluted in PBS were placed into the sample cell. To ensure consistency in collecting the spectra of a single cell, the laser was focused accurately on the cell centre (nucleus). The integration time of the CCD was set 30 s for each spectral collection. Up to 30 isolated cells were measured randomly at each point-in-time. The background spectra around the cells were recorded at the same time. The spectrometer was calibrated via the wavelength dependence of a standard 1001 cm−1 vibrational band of polystyrene beads before RS measurements.Data processing
RS analysis was performed using in-house software based on a MATLAB (The MathWorks, Inc., USA) tool. For each spectrum, the background noise was removed by subtracting the background spectra. In single cell RS analysis, the spectral peaks corresponded to different chemical components; their intensity (area) is directly proportional to the content of the chemical component, while the total area under the RS curve (here from 450 cm−1 to 1800 cm−1) represents the ensemble of various components within a cell. This area was integrated and included the main components within a cell. The RS curve area can reduce the effects of non-pharmacological factors, such as cell cycles. The biochemical phenomena involved in cell death are very complex, and the chemical components for every cell may be different under drug treatment due to the biochemical and functional heterogeneity. The Nomenclature Committee on Cell Death (NCCD) proposed that specific biochemical analyses should not be employed as an exclusive means to define apoptosis or oncosis, because different cell deaths can occur with different biochemical changers.17 Therefore, using a single component or the specific ratio between peaks to characterize cell death may be suitable for single cell analysis, but has some drawbacks for evaluating drug treatment effects in general. However, the area under the RS curve represents the ensemble of various components within a cell, which might be more suitable and accurate.PTX cytotoxicity test
To determine the appropriate drug dose, the cytotoxicity of PTX to the normal BGC823 cells was initially determined using a Cell Counting-8 kit (Sigma Aldrich, St Louis, MO).20 The IC50 was ∼140 ng mL−1 for normal BGC823 cells. The difference of the drug response between the normal and DR-BGC823 cells was explored by their RS at different PTX concentrations and treatment times. The RS for an individual cell was collected and measured. To study the changes in the drug resistance of the normal BGC823 cells, we continuously recorded the RS of cells treated with 1 × IC50 PTX (140 ng mL−1) every 6 h. In addition, direct cell counting was performed for all cell groups prior to RS data collection using a hemocytometer.Consistency control
This study detected the cellular drug response based on the RS intensity variation of individual cells. For single-cell RS, a few factors would change RS intensity including the relative size between the laser spot and the cell volume, the power of the laser, the stability of the Raman spectral setup and the focusing position within the cell. All of these factors should be strictly controlled to maintain consistency in single cell RS experiments. The size of the laser spot on the cells could be calculated by using the Bassel function for a Gaussian laser beam, | (1) |
The laser power was also considered. Low power would reduce the intensity of the RS and its signal-to-noise ratio (SNR), while high power could damage the cell by absorption and heating. In this work, an optimal 20 mW laser power was obtained by experimental measurements based on the signal to noise ratio and photo damage to the cell (identified in Fig. S1 in the ESI†).
Furthermore, wavelength correction was carried out using a polystyrene bead prior to cell experiments. For intensity corrections, the power of the laser before the objective and the relative position of the Raman scattering light spot on the slit of the spectrometer were held rigidly constant with CCD monitoring. The laser focusing position in the axial direction was controlled to ∼1 μm precision via a bright light view. This minimizes RS fluctuation to <3%, which is less than the change caused by the drug (see Fig. S2 in the ESI†). Thus the RS data were confirmed to indeed reflect the activity of the cell.
In addition, biological variations, including cell culture, passage time, etc., could affect the mean RS value. In this study, the volume of the normal BGC823 cells was homogeneous (Fig. 2a). The cells in each group were from the same passage and under the same culture conditions. Statistical methods were helpful in indicating group effects and reducing the fluctuation among cells. At least 30 cells were measured in every group.
Results and discussion
RS is known as molecular fingerprint spectroscopy. It is a label-free technique to characterize the chemical components and content in samples. In eukaryotic cells, the 783 cm−1 band corresponds to the nucleic acid components of RNA or DNA uracil (U), thymine (T), and cytosine (C) ring vibrations. Therefore, major changes related to DNA can be observed at this peak.12,14 The sharp band at 1001 cm−1 corresponds to a symmetric ring-breathing mode of phenylalanine,12,13 which is very sensitive to the death of cells.11,26,27 This peak can also be used for determining whether the cells were dead. The band at 1245 cm−1 is attributed to the amide III (bonds β sheets), which is basic component of protein structure.2,28 Specific changes related to proteins can therefore be observed at these two peaks. The 1446 cm−1 band corresponds to CH2 bending vibrations in proteins, carbohydrates, lipid, and DNA.11,12,14 This demonstrates single-cell RS intensity changes as a whole. Meanwhile, the area under the RS curve represents the ensemble of various cell components which can be used to analyse intracellular concentration changes.Drug effect assessment
Fig. 3 and 4 show the RS dynamic changes of normal BGC823 cells exposed in a 1 × IC50 PTX concentration for 48 h. This indicates that the RS intensity of normal BGC823 cells initially decreased after 12 hours of exposure and then increased with PTX treatment after 24 hours compared to the control group. Decreases in RS intensity were likely due to drug-induced cell death.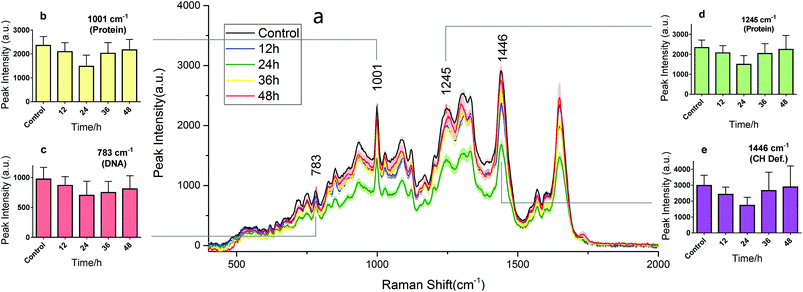 | ||
| Fig. 3 The RS changes over the treatment time in 1 × IC50 PTX for the normal BGC823 cells. The data were collected every 12 h for 48 h. (a) The RS lines of different PTX treatment times (mean ± s.e.m, the light shadow represents the s.e.m, n ≥ 30 cells per condition). (b)–(e) Selected peaks corresponding to different components, respectively. Mean ± s.d., (the five groups were compared by a one-way ANOVA, and P < 0.0001 in each figure). The mean intensities of the control groups collected at any time were consistent (Fig. S3 in the ESI†). | ||
Subsequent intensity increases were likely due to drug sensitive cell death or damage as a result of poor adaptation, and the cells were removed during cell washing and centrifugation. The remaining BGC823 cells were drug-resistant and could be detected. The longer the cell drug treatment time, the higher the proportion of drug-resistant cells reached. Therefore the mean RS intensity increased with time. Reports have also suggested that the normal BGC823 cells contain ∼4% side population (SP) cells, which are also less vulnerable to PTX.29
The RS intensity changes in the DR-BGC823 cells were different from those of the normal BGC823 cells (Fig. 4). After PTX treatment, the RS intensities increased during the first 12 hours. This then slowly decreased with time and then returned to the RS intensity of the control after 48 hours. Intracellular components may have increased because PTX might not kill the DR-BGC823 cells, and because the stress response was caused by relatively low PTX exposure.30,31 Cells could then return to original states when the stress dissipated.
The control groups of the normal BGC823 and DR-BGC823 cells are also shown in Fig. 4. There is no obvious difference among the control groups over time (P > 0.01). But, there were significant differences between the drug treated groups (P < 0.01). From Fig. 4b, we can see that the difference between the 783 cm−1 band of the control group was more fluctuant than other bands (P = 0.015 for the control group of the BGC823 cells). Some studies also reported that changes in the levels of DNA accounted for the most significant differences in the spectra due to the cellular cycle.32 Compared with the cellular cycle, the drug effect was the main factor affecting the changes of RS intensity.
Time-dependent effects at different concentrations of PTX were investigated for the BGC823 cells. The results were similar to the drug time-effect mentioned above. All these stable and reproducible trends suggested that both time- and dose-dependent effects could be evaluated by a single RS technique (Fig. S4 in the ESI†).
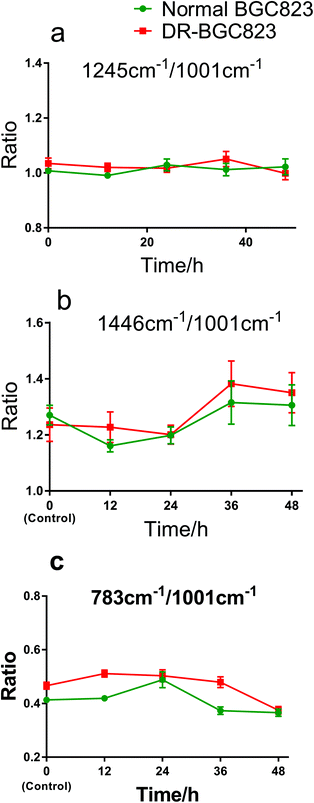
The ratio changes for different Raman bands in the same cell showed the relative change in cellular compositions, and the correlation of DNA, protein, and other constituents during drug treatment. This also indicates the drug treatment effects as an internal standard method. Fig. 5 shows the Raman band ratios of 1245 cm−1/1001 cm−1, 1446 cm−1/1001 cm−1, and 783 cm−1/1001 cm−1, respectively. The 1245 cm−1 band (amide III) is near constant relative to the 1001 cm−1 band (phenylalanine) during 48 hours of drug exposure (Fig. 5a). This means that the change in the amide III content was the same as phenylalanine and remained generally stable both in the normal BGC823 and DR-BGC823 cells. The ratio of the 1446 cm−1 (CH2) band to the 1001 cm−1 band (phenylalanine) (Fig. 5b) varied in the same pattern and increased evidently after 24 hours of PTX treatment both in the normal and DR-BGC823 cells. Some literature studies also have reported that the 1001 cm−1 band is very sensitive to the death of cells.11,26,27 The varied pattern of the ratio between two bands also verifies that the 1001 cm−1 band dropped more than the 1446 cm−1 band. However, the ratio of 783 cm−1 (DNA) to 1001 cm−1 was more complicated (Fig. 5c). They generally had the same slow decline, but the change was greater at 24 hours for the normal BGC823 cells. This feature suggested that the contents of DNA increased significantly when the BGC823 cells were close to death. It is generally known that condensed chromatin is the characteristic of cell apoptosis,16,17,33 and this could be detected by using RS. In addition, the 783 cm−1/1001 cm−1 ratio of the DR-BGC823 cells was higher than that of the normal BGC823 cells, which means that the DNA content of DR-BGC823 cells is relatively higher than that of normal BGC823 cells. This change was only an example of the reaction of cells to the drug, which demonstrates that the individual cell RS is a novel tool to explore the sensitivity of cells to drugs.
Heterogeneous drug response characteristics analysis
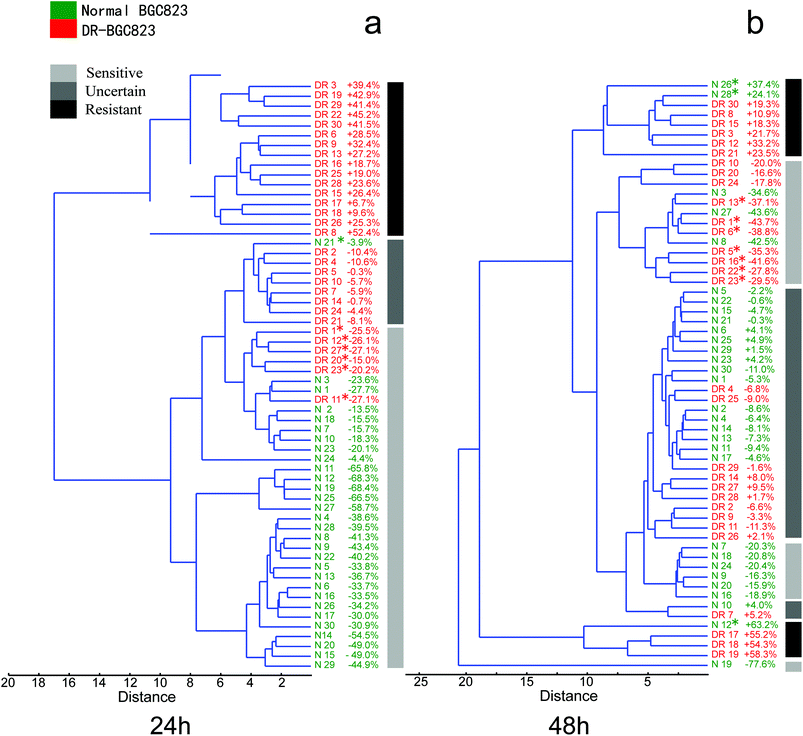
Cancer cells from the same type of patients, even from different populations of the same cancer cell line, are different. The functional and phenotypic heterogeneity of cancer cells has also been widely studied. The populations which are closely related to drug resistance should be considered carefully, because they may be the key for the improvement of cancer diagnoses and prognoses. Conventional cell biology (multi-cell) assays, such as MTT drug sensitive testing, represent a group activity that does not provide details about crucial cell-to-cell differences. Thus, outlier cell activities that are different with respect to average responses are overwhelmed by the averaged bulk measurements. This causes the loss of important information regarding cell biology and disease-related drug resistance for cancers as well as gene expression variations within clonal populations.11,21,34,35 However, single-cell RS may be a reliable analytical technique to reveal outliers insensitive to the drugs.The hierarchical clustering routine produces a ‘dendrogram’ which shows how data points can be clustered. It is also possible to find groupings of variables or associations. To analyse the heterogeneous drug response characteristics of the normal and DR-BGC823 cells, we used an Unweighted Pair Group Method with Arithmetic Mean (UPGMA) algorithm with a Euclidean distance measured for calculating the clustering tree. Before calculating, the RS need to be normalized using every RS. This was divided by the mean RS of the control group. The normalized RS showed the intensity changes relative to the control group after drug treatment. For clustering we used PAST software.36 In order to facilitate the analysis, a clustering tree combined with the percentage change in the RS curve area (the RS curve area from 450 cm−1 to 1800 cm−1 divided by the mean value of the control for every cell) was used for analysing the data. A grayscale diagram plotted the gross classification of the response of cells on PTX. This visually displayed the clustering result. The three grayscale icons represent different drug treatment effects. “Sensitive” corresponds to drug sensitive features and “Resistant” corresponds to drug resistant characteristics. “Uncertain” refers to the cells that could not been reliably classified by the result of a clustering tree and the RS intensity change (RS intensity changes were within ±10%).
In Fig. 6a, the normal (green) and DR-BGC823 (red) cells were almost entirely separated in a hierarchical clustering tree after 24 hour of PTX treatment. We know that the RS intensity of the normal BGC823 cells was minimized at 24 hours and did not show distinct drug resistant characteristics (Fig. 3), and the DR-BGC832 cells had a different response to PTX at this time (Fig. 4). The dendrogram gave a consistent result and these two cell types could be distinguished and separated. Moreover, some ‘outliers’ were distinguished and spotted by using the hierarchical clustering tree. For example, the normal BGC823 cell number N21 showed significant drug resistant characteristics, while the DR-BGC823 cells numbered DR1, DR12, DR27, DR20, DR23 and DR11 showed drug sensitive features. The results became more complex after 48 hour PTX treatment (Fig. 6b). More normal BGC823 cells became drug resistant (N12, N26, and N28) and more DR-BGC823 cells became drug sensitive (DR13, DR1, DR6, DR5, DR16, DR22, and DR23). The “Uncertain” group also increased considerably. In fact, after 48 hours of high PTX treatment, the RS intensity remained stable. The cells might have obvious drug-resistant characteristics.
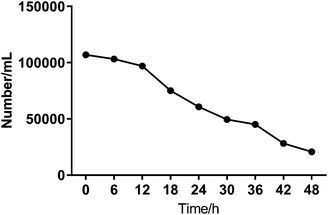
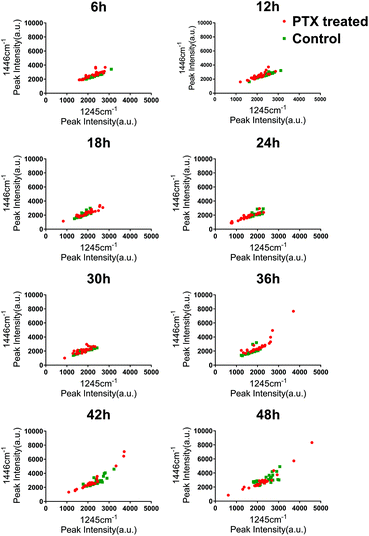
To investigate the heterogeneous drug response of the BGC823 cells, we increased the sampling frequency to better describe the dynamic process of BGC823 under PTX treatment. Here a 1 × IC50 PTX concentration was used and RS was collected every 6 h for 48 h (Fig. S5 in the ESI†). The cell counting test showed that PTX-induced cell death was a continuous process throughout the entire 48 h experiment (Fig. 7). The count of the normal BGC823 cells decreased by 86.1% after the 48 hour PTX treatment. The variation of the Raman bands indicates the drug treatment effects for different cells. We also used the evolution of the scatterplot about two typical components (1245 cm−1 band and 1446 cm−1 band) to show cell heterogeneity (Fig. 8). The figure was derived by plotting the spectral peak intensities of 1245 and 1446 cm−1 as x and y-axes, respectively. The red dots represented the PTX treated BGC823 cells and the green dots were the corresponding control groups at the corresponding times. This shows that the scatterplot had the trend from concentrated to discrete, which showed that the consistency of the BGC823 cells gradually decreased, and cell-to-cell differences increased over PTX treatment. Here, single-cell RS showed that the heterogeneous of BGC823 cells was gradually appeared during drug exposure, as indicated in 1245 and 1446 cm−1 bands.
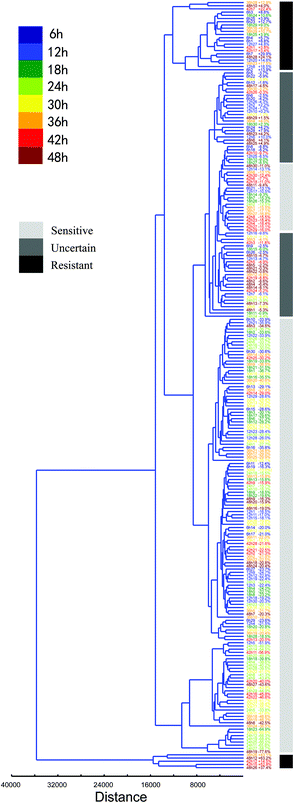
Furthermore, the heterogeneous characteristics of every normal BGC823 cell under PTX treatment can be clustered and quantified (Fig. 9). Putting totally normal BGC823 cells with different drug treatment time together for clustering analysis we found that most of cells showed a drug sensitive characteristic. However, some cells with too short (time <12 hours) or too long (time >42 hours) drug treatment time generally show obvious drug resistant characteristics. For example, long time-drug treated cells 42h7 (means the 7th cell in the group of 42 hours drug treatment), 42h12, 42h15, 48h12, 48h26 and 48h28 are drug resistant cells, while shot time-drug treated cells 6h3, 6h25, 6h23, 6h14, 6h1, 12h27, 6h7, 12h20, 12h8 and 6h2 also showed drug resistant characteristics. We might conclude that the mechanisms for these two groups were different. For the short time exposed BGC823 cells, PTX may not play significant effects due to the short drug treatment time, but the drug resistance characteristics may be the main reason underlying the long duration exposed cells. Basically, they are also classified into different groups.
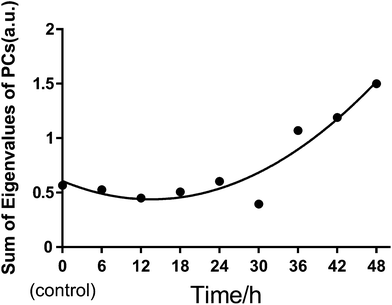
We also used principal component analysis (PCA) to quantitatively evaluate the heterogeneous characteristics of normal BGC823 cells under PTX treatment. PCA finds variables (components) accounting for as much as possible of the variance in multivariate data. The PCA routine finds the eigenvalues and eigenvectors of the variance–covariance matrix or the correlation matrix. The eigenvalues give a measure of the variance accounting for the corresponding eigenvectors (components). We input the full RS data of 30 cells from 450 cm−1 to 1800 cm−1 as PCA variables for each test group. By summing the eigenvalues of total PCs in each group, we can quantitatively measure the variance or the heterogeneity of the BGC823 cells under PTX treatment (Fig. 10).
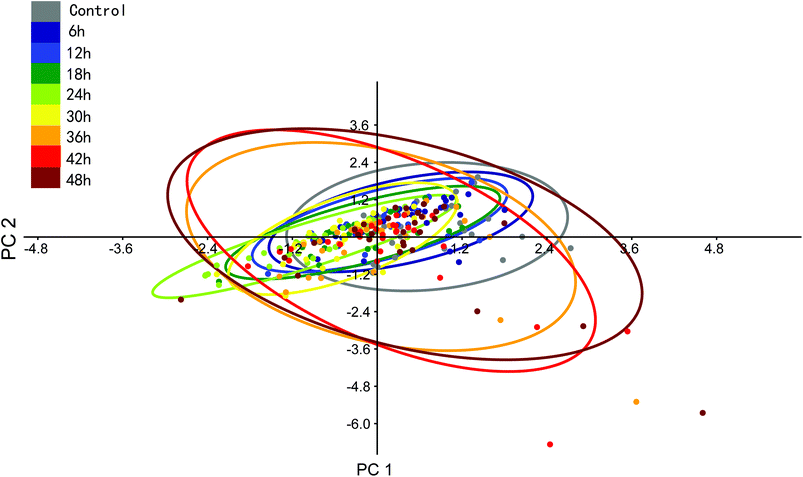
We can see that the sums of eigenvalues of total PCs were distinctly increased at 36 hours of PTX treatment. The ratio of the curve increased with prolonged treatment. This suggested that most PTX-sensitive BGC823 cells underwent apoptosis and died after 36 hours, while the proportion of PTX-resistant BGC823 cells had an obvious increase after 36 hours. This process accompanied the rise in drug response heterogeneous characteristics. Quantitative evaluation of the heterogeneous characteristics of tumour cells under drug treatment might be significant for drug screening and individual treatment. The PCA results of the normal BGC823 cells over PTX treatment from 6 to 48 hours are also shown in Fig. 11. The spectral features related to drug resistance can be observed from the diagram of PC1 (explaining 82.15% of variance) vs. PC2 (explaining 9.23% of variance). In the score plot, each cell is represented by a single point. The x-axis, labelled PC1, represents the score values for the first principal component; the y-axis, PC2, represents the second principal component. The samples are color coded according to the drug treatment time and the control group was colored with gray. For showing the changes in the normal BGC 823 cells under PTX treatment, 95% concentration ellipses were plotted in scatterplots. These ellipses were decided by estimating a region where 95% of population points fall into it. This clearly shows how the heterogeneous characteristics of the normal BGC823 cells changed with the prolonged drug treatment. From Fig. 11, we can see that the center of the BGC 823 cell distribution moves along the PC1 and the PC2 negative axis compared to the control group from 6 to 24 hours. The distribution regions were significantly increased after PTX treatment for 36 hours. The long axis of the ellipses had also rotated.
The results demonstrated that single-cell RS has high sensitivity to detect subtle changes that would otherwise be missed by conventional bulk assays. Therefore, single-cell RS is potentially important in drug resistance studies and cancer treatment.
Conclusions
We used single-cell RS to investigate the dynamic responses and heterogeneous characteristics of normal and DR-BGC823 cells under PTX treatment. The results showed an obviously different dynamic response to anti-cancer drugs between normal and drug-resistant BGC823 cells. Single cell RS was an effective and sensitive tool for cytotoxicity assays. The ability of single-cell RS in revealing cell-to-cell differences is preferred for a quantitative research of the heterogeneous characteristics of cancer cells under the treatment of anti-cancer drugs, because the unique characteristics of every cancer cell can be measured quantitatively. The ‘outlier’ having close links to drug resistance can be discriminated, which could also be used to rapidly, accurately, and objectively evaluate anticancer drug sensitivity with supplementary drug response heterogeneity. Thus it could be meaningful for individualized treatment. Finally, the integration of microfluidic systems with RS will allow label-free and rapid single cell analysis including separation and sorting.Conflicts of interest
There are no conflicts to declare.Acknowledgements
This work was supported by the National Natural Science Foundation of China (NSFC) (no. U1636110) and the Foundation from State Key Laboratory of Microbial Resources of China.References
- L. A. Austin, S. Osseiran and C. L. Evans, Analyst, 2016, 141, 476–503 RSC.
- I. W. Schie and T. Huser, Appl. Spectrosc., 2013, 67, 813–828 CrossRef CAS PubMed.
- G. Pyrgiotakis, O. E. Kundakcioglu, K. Finton, P. M. Pardalos, K. Powers and B. M. Moudgil, Ann. Biomed. Eng., 2009, 37, 1464–1473 CrossRef PubMed.
- J. F. Hsu, P. Y. Hsieh, H. Y. Hsu and S. Shigeto, Sci. Rep., 2015, 5, 17541 CrossRef CAS PubMed.
- A. Naemat, H. M. Elsheikha, R. A. Boitor and I. Notingher, Sci. Rep., 2016, 6, 20811 CrossRef CAS PubMed.
- M. Okada, N. I. Smith, A. F. Palonpon, H. Endo, S. Kawata, M. Sodeoka and K. Fujita, Proc. Natl. Acad. Sci. U. S. A., 2011, 109, 4 Search PubMed.
- F. C. Pascut, S. Kalra, V. George, N. Welch, C. Denning and I. Notingher, Biochim. Biophys. Acta, 2013, 1830, 3517–3524 CrossRef CAS PubMed.
- R. J. Swain, G. Jell and M. M. Stevens, J. Cell. Biochem., 2008, 104, 1427–1438 CrossRef CAS PubMed.
- Q. Matthews, A. Jirasek, J. Lum, X. Duan and A. G. Brolo, Appl. Spectrosc., 2010, 64, 871–887 CrossRef CAS PubMed.
- S. Takanezawa, S. Morita, Y. Ozaki and Y. Sako, Biophys. J., 2015, 108, 2148–2157 CrossRef CAS PubMed.
- G. B. Jung, Y. J. Lee, G. Lee and H. K. Park, Biomed. Opt. Express, 2013, 4, 2673–2682 CrossRef PubMed.
- R. Buckmaster, F. Asphahani, M. Thein, J. Xu and M. Zhang, Analyst, 2009, 134, 1440–1446 RSC.
- H. Yao, Z. Tao, M. Ai, L. Peng, G. Wang, B. He and Y.-q. Li, Vib. Spectrosc., 2009, 50, 193–197 CrossRef CAS.
- H. Huang, H. Shi, S. Feng, W. Chen, Y. Yu, D. Lin and R. Chen, Anal. Methods, 2013, 5, 260–266 RSC.
- A. Mailloux, K. Grenet, A. Bruneel, B. Beneteau-Burnat, M. Vaubourdolle and B. Baudin, Eur. J. Cell Biol., 2001, 80, 442–449 CrossRef CAS PubMed.
- S. Levin, Toxicol. Sci., 1998, 41, 155 CrossRef CAS PubMed.
- G. Kroemer, L. Galluzzi, P. Vandenabeele, J. Abrams, E. S. Alnemri, E. H. Baehrecke, M. V. Blagosklonny, W. S. El-Deiry, P. Golstein, D. R. Green, M. Hengartner, R. A. Knight, S. Kumar, S. A. Lipton, W. Malorni, G. Nunez, M. E. Peter, J. Tschopp, J. Yuan, M. Piacentini, B. Zhivotovsky, G. Melino and D. Nomenclature Committee on Cell, Cell Death Differ., 2009, 16, 3–11 CrossRef CAS PubMed.
- P. Weerasinghe and L. M. Buja, Exp. Mol. Pathol., 2012, 93, 302–308 CrossRef CAS PubMed.
- D.-L. Wu, Y. Xu, L.-X. Yin and H.-Z. Lu, World J. Gastroenterol., 2007, 13, 2234–2237 CrossRef CAS PubMed.
- H. Tominaga, M. Ishiyama, F. Ohseto, K. Sasamoto, T. Hamamoto, K. Suzuki and M. Watanabe, Anal. Commun., 1999, 36, 47–50 RSC.
- G. V. Tolstonog, I. V. Belichenko-Weitzmann, J.-P. Lu, R. Hartig, R. L. Shoeman, U. Traub and P. Traub, DNA Cell Biol., 2005, 24, 680–709 CrossRef CAS PubMed.
- M. B. Watson, M. J. Lind and L. Cawkwell, Anticancer Drugs, 2007, 18, 749–754 CrossRef CAS PubMed.
- Y. Zhang, A. Ye and C. Wen, Acta Opt. Sin., 2010, 30, 491–497 CrossRef CAS.
- H. Ma, Y. Zhang and A. Ye, Chin. Sci. Bull., 2013, 58, 2594–2600 CrossRef CAS.
- H. Parekh, K. Wiesen and H. Simpkins, Biochem. Pharmacol., 1997, 53, 10 CrossRef.
- C. A. Owen, J. Selvakumaran, I. Notingher, G. Jell, L. L. Hench and M. M. Stevens, J. Cell. Biochem., 2006, 99, 178–186 CrossRef CAS PubMed.
- I. Notingher, J. Selvakumaran and L. L. Hench, Biosens. Bioelectron., 2004, 20, 780–789 CrossRef CAS PubMed.
- J. De Gelder, K. De Gussem, P. Vandenabeele and L. Moens, J. Raman Spectrosc., 2007, 38, 1133–1147 CrossRef CAS.
- W. Song-jie, J. Xiao-yuan and Q. Qi-jun, J. Zhejiang Sci. Technol. Univ., 2008, 25, 573–577 Search PubMed.
- F. Draux, C. Gobinet, J. Sule-Suso, M. Manfait, P. Jeannesson and G. D. Sockalingum, Analyst, 2011, 136, 2718–2725 RSC.
- A. J. Holland and D. W. Cleveland, EMBO Rep., 2012, 13, 501–514 CrossRef CAS PubMed.
- I. Notingher, S. Verrier, S. Haque, J. M. Polak and L. L. Hench, Biopolymers, 2003, 72, 230–240 CrossRef CAS PubMed.
- N. Zamzami and G. Kroemer, Nature, 1999, 401, 127–128 CrossRef CAS PubMed.
- R. Bahar, C. H. Hartmann, K. A. Rodriguez, A. D. Denny, R. A. Busuttil, M. E. Dolle, R. B. Calder, G. B. Chisholm, B. H. Pollock, C. A. Klein and J. Vijg, Nature, 2006, 441, 1011–1014 CrossRef CAS PubMed.
- S. Takanezawa, S.-i. Morita, Y. Ozaki and Y. Sako, Biophys. J., 2015, 108, 2148–2157 CrossRef CAS PubMed.
- Ø. Hammer, D. A. T. Harper and P. D. Ryan, Palaeontol. Electron., 2001, 4, 10 Search PubMed.
Footnote |
| † Electronic supplementary information (ESI) available. See DOI: 10.1039/c7an01287j |
| This journal is © The Royal Society of Chemistry 2018 |

