A Co-doped Ni–Fe mixed oxide mesoporous nanosheet array with low overpotential and high stability towards overall water splitting†
Zhengcui
Wu
 *,
Xia
Wang
,
Jiansong
Huang
and
Feng
Gao
*
Anhui Laboratory of Molecule-Based Materials (State Key Laboratory Cultivation Base), The Key Laboratory of Functional Molecular Solids, Ministry of Education, College of Chemistry and Materials Science, Anhui Normal University, Wuhu 241000, P. R. China. E-mail: zhengcui@mail.ahnu.edu.cn; fgao@mail.ahnu.edu.cn; Fax: +86 553 3869302; Tel: +86 553 3869302
First published on 22nd November 2017
Abstract
The construction of bifunctional water splitting electrocatalysts with new and optimized chemical compositions and structures for promoting the efficiencies of both half-reactions of the water splitting process, that is, the anodic oxygen evolution reaction (OER) and cathodic hydrogen evolution reaction (HER), represents a great advancement. Herein, a Co-doped NiO/NiFe2O4 mixed oxide mesoporous nanosheet array on Ni foam with controllable composition and morphology is constructed as a bifunctional electrocatalyst by a facile solvothermal synthesis method using methanol as a solvent and a reactant, followed by annealing in air. The well-connected mesoporous nanosheet array provides a large number of catalytically active sites and buffers the large volume changes that occur during the electrochemical process. Moreover, NiFe2O4 has a catalytic active phase that plays a significant role in improving the catalytic activity, and Co2+ doping in NiO/NiFe2O4 can increase the conductivity and activate the Ni sites at lower overpotentials via charge transfer effects. As a result, the optimized Co-doped NiO/NiFe2O4 mixed oxide mesoporous nanosheet array Co6.25Fe18.75Ni75Ox exhibits excellent OER activity with a small overpotential of 186 mV at 10 mA cm−2 and a low Tafel slope of 38.5 mV dec−1. It also presents outstanding HER activity, only requiring a small overpotential of 84 mV to deliver 10 mA cm−2, along with a low Tafel slope of 53.6 mV dec−1. Moreover, this Co6.25Fe18.75Ni75Ox electrode remains stable for 1000 cyclic voltammogram cycles and 12 hours of galvanostatic measurements in both OER and HER. A two-electrode electrolyzer using bifunctional Co6.25Fe18.75Ni75Ox as both the anode and cathode demonstrates active and stable overall water splitting performance with a cell voltage of only 1.583 V at 10 mA cm−2. This study explores multimetal Ni–Fe mixed oxide as an efficient bifunctional electrocatalyst for overall water electrolysis.
1. Introduction
Hydrogen energy is one of the most promising alternative energies to diminishing fossil fuels. Water electrolysis is a simple approach to engender high-purity hydrogen via electrochemical splitting of water into hydrogen and oxygen. An effective electrocatalyst should optimize the efficiency of both the anodic oxygen evolution reaction (OER) and cathodic hydrogen evolution reaction (HER) of the water splitting process. Noble metal-based materials, such as Ir- or Ru-based oxides for OER1,2 and Pt-based materials for HER,3–5 are considered to be the benchmark due to their outstanding catalytic performance. However, the rarity and high cost of these noble-metal-based materials hamper their practical applications. It is highly desirable to construct low-cost and high-efficiency alternative electrocatalysts for water splitting. Among various promising electrocatalysts available for OER, earth-abundant, low-cost 3d transition metal oxides are considered to be attractive alternatives because active electrocatalytic performance can be acquired through precise control of their compositions and structures.Recent studies have found that 3d transition metal oxides with complex metal compositions, such as Fe–Ni, Co–Ni and Fe–Ni–Co oxides, possess higher catalytic activities for OER and/or HER than single iron, nickel or cobalt oxides. For example, NiFeOx film presented almost 10 times higher activity in 1 M NaOH than CoOx, CoPi, CoFeOx, NiOx, NiCeOx, NiCoOx, NiCuOx and NiLaOx operating at ∼3 mA cm−2.6 Ni–Fe oxide film containing 40% Fe showed OER current densities three orders of magnitude higher than that of Fe oxide film and two orders of magnitude higher than that of freshly deposited Ni oxide film in 0.1 M KOH.7 NiO/NiFe2O4 mixed oxide powder with 10 mol% Fe exhibited much higher activity in 1 M KOH than either of the pure oxides, with a Tafel slope of 40 mV dec−1.8 Ni0.9Fe0.1Ox thin film with ∼2 to 3 nm thickness showed the most active OER performance compared with NiOx, CoOx, NiyCo1−yOx, IrOx, MnOx, and FeOx films, requiring an overpotential of 336 mV to drive 10 mA cm−2 with a Tafel slope of 30 mV dec−1 in 1 M KOH.9 An amorphous Fe40Ni60Ox film exhibited the best catalytic parameters among amorphous metal oxide films, including iron, cobalt and nickel, requiring an overpotential of 250 ± 30 mV at 1 mA cm−2 with a Tafel slope of 34 ± 8 mV dec−1 in 0.1 M KOH.10 Mesoporous Ni1−xFexOy nanorods with 33 at% Fe presented a small overpotential of 302 mV at 10 mA cm−2 with a low Tafel slope of ∼42 mV dec−1 in 1 M KOH.11 Amorphous Ni0.69Fe0.31Ox nanoparticles/C exhibited a 280 mV overpotential at 10 mA cm−2 and a Tafel slope of 30 mV dec−1 in 1.0 M KOH solution.12 Mesoporous amorphous NiFe hydroxide nanosheets required an overpotential of 200 mV to initiate the reaction; they could deliver high current densities of 500 and 1000 mA cm−2 at overpotentials of 240 and 270 mV, respectively, in 10 M KOH for OER.13 NiFe2O4–NiOOH nanosheet arrays could deliver an OER current density of 30 mA cm−2 with a small overpotential of 240 mV; they required an overpotential of only 410 mV to achieve a remarkably high current density of 3000 mA cm−2.14 Oxygen vacancy-rich NiCo2O4 ultrathin nanosheets provided a large current density of 285 mA cm−2 at a small overpotential of 320 mV for OER in 1 M KOH.15 The oxygen vacancy-rich NiCo2O4 nanowire arrays exhibited a large current density of 360 mA cm−2 with an overpotential of only 317 mV for HER in 1.0 M KOH.16 Nanoporous NiCo2O4 nanowires with cobalt–nickel layered oxide nanosheets produced a current density of 10 mA cm−2 at an overpotential of 340 mV for OER in 0.1 M KOH and a current density of 10 mA cm−2 at an overpotential of 52 mV for HER in 0.5 M H2SO4.17 Amorphous FeCoNi ternary oxide nanosheets obtained by anodization of an alloy plate and subsequent low-temperature annealing showed superior electrocatalytic activity toward the oxygen evolution reaction, with an overpotential of 170 mV at 5 mA cm−2 and a low Tafel slope of 37 mV dec−1 in 0.1 M KOH.18 Amorphous FeCoNi hydroxide nanosheets prepared by electrodeposition on nickel foam exhibited a high current density of 300 mA cm−2 at an overpotential of 370 mV in 10 M KOH.19 Despite outstanding OER performance in alkaline electrolyte, the CoFeNi ternary oxide that can effectively catalyze hydrogen evolution in alkaline media has rarely been reported. The use of a CoFeNi ternary oxide as a state-of-the-art electrocatalyst for overall water splitting would represent a great advancement in this field. Optimizing the compositions and structures of transition metal compound catalysts is a promising method to further promote their OER and HER performances.16,20 Constructing freestanding 3D porous nanostructure catalysts on conductive substrates and directly employing them as electrodes can provide abundant exposed active sites and cushion volume changes during reversible redox reactions, thus promoting their electrocatalytic activity and stability. More interestingly, the incorporation of Co2+ ions into Ni–Fe mixed oxide can manipulate its electronic structure, thereby greatly improving its electrocatalytic performance. Herein, a Co-doped NiO/NiFe2O4 mixed oxide mesoporous nanosheet array on Ni foam with controllable composition and morphology was constructed by a facile solvothermal approach using methanol as solvent and reactant, followed by an annealing process. The well-connected mesoporous nanosheet array provides a large number of catalytically active sites and cushions the large volume changes that occur during the electrochemical process. Moreover, the catalytic active phase of NiFe2O4 plays a crucial role in improving the catalytic activity, while Co2+ doping increases conductivity and activates the Ni sites at a lower overpotential via charge transfer effects. As a result, the optimal Co-doped NiO/NiFe2O4 mesoporous nanosheet array, Co6.25Fe18.75Ni75Ox, exhibits excellent OER activity, with small overpotentials of 186, 219 and 228 mV at 10, 50 and 100 mA cm−2, respectively, and can achieve 220.7 mA cm−2 at a small overpotential of 235 mV. Interestingly, this Co6.25Fe18.75Ni75Ox electrode also demonstrates outstanding HER activity, with small overpotentials of 84, 155 and 192 mV to reach 10, 50 and 100 mA cm−2, respectively. A two-electrode alkaline electrolyzer using Co6.25Fe18.75Ni75Ox as both anode and cathode requires a cell voltage of only 1.583 V to drive 10 mA cm−2, along with good durability. This work furthers the development of multimetal Co–Ni–Fe mixed oxides for enhanced OER and HER electrocatalysis.
2. Experimental
Synthesis of Co-doped Ni–Fe mixed oxide mesoporous nanosheet array on Ni foam
Ni foam with dimensions of 2 × 3 cm was soaked in 6 M hydrochloric acid for 15 min and washed with deionized water and absolute ethanol. 3 mmol of Ni(NO3)2·6H2O, 0.25 mmol of CoCl2·6H2O, 0.75 mmol of Fe(NO3)3·9H2O and 1.5 mmol of CO(NH2)2 were dissolved in 40 mL of methanol; then, the solution was transferred into a 50 mL Teflon-lined stainless steel autoclave. The cleaned Ni foam was immersed in the solution, which was then heated at 120 °C for 6 h. The precipitate deposited on Ni foam was rinsed with deionized water and absolute ethanol three times, then dried in vacuum at 50 °C for 6 h. Afterward, the Ni foam covered by the precursor was annealed at 350 °C in air for 2 h to acquire Co-doped Ni–Fe mixed oxide on Ni foam (CoyFezNi100−y−zOx). For other Co and Fe contents, the amounts of CoCl2·6H2O and Fe(NO3)3·9H2O were changed to 0.5 and 0.5 mmol and 0.75 and 0.25 mmol, respectively. Co-doped NiO (CoyNi100−yOx), Ni–Fe mixed oxide (FeyNi100−yOx), and pure NiO on Ni foam was prepared by the same method used for CoyFezNi100−y−zOx except with the addition of only Co source, only Fe source, or no Co and Fe source, respectively. The elemental ratios of the metals in CoyFezNi100−y−zOx, CoyNi100−yOx and FeyNi100−yOx were calculated according to their energy-dispersive X-ray spectra; the ratios were found to be similar to the feeding ratios. Therefore, the samples were designated with their feeding ratios.Characterization
X-ray diffraction (XRD) patterns were acquired on a D8 advance diffraction system with high-intensity Cu Kα radiation. The field-emission scanning electron microscope (FESEM) images were acquired on a Hitachi S-4800 field-emission scanning electron microscope. The transmission electron microscopy (TEM)/scanning transmission electron microscopy (STEM) images were acquired on a JEOL JEM-ARF200F instrument. Raman spectra were measured on a M-9836-3991-04-A Raman spectrometer. X-ray photoelectron spectroscopy (XPS) spectra were obtained on an ESCALAB MK II X-ray photoelectron spectrometer.Electrochemical measurements
All electrochemical measurements were performed on a CHI 660D electrochemical working station (Chenhua Corp., China) at room temperature (25 °C). The catalysts were measured in 1.0 M KOH aqueous solution using a typical three-electrode configuration, in which CoyFezNi100−y−zOx/NF, CoyNi100−yOx/NF, FeyNi100−yOx/NF and NiO/NF (cut into 1 × 1 cm pieces with a loading of ∼4 mg cm−2) were used as the working electrode; platinum wire and Ag/AgCl electrode were used as the counter and reference electrodes, respectively. Cyclic voltammograms (CVs) were acquired at a scan rate of 50 mV s−1. Linear sweep voltammetry (LSV) polarization curves were acquired at a scan rate of 5 mV s−1 with 90% iR-compensation unless otherwise mentioned. The mass activity of the catalyst was calculated by the measured current density (mA cm−2) divided by the loading amount of catalyst (mg cm−2).21 The electrochemical impedance spectroscopy (EIS) tests were measured at the open-circuit potential in the frequency range of 100 kHz to 0.01 Hz. Chronoamperometric curves were recorded at a constant current density without iR-compensation. The electrochemical active surface areas (ECSAs) were determined from the capacitance measurements in the potential region of no faradic process at different scan rates of 2, 4, 6, 8, 10 and 12 mV s−1. Commercial RuO2 and Pt/C-loaded electrodes were fabricated as benchmarks for comparison of the OER and HER performance of the catalyst, respectively. 20 mg of RuO2 or Pt/C was ultrasonically scattered in 0.2 mL of Nafion solution (0.5 wt%) and 0.8 mL of ethanol. The dispersion was transferred onto Ni foam by a controlled drop casting approach to obtain a loading of 4 mg cm−2. Overall water splitting tests were performed in a two-electrode configuration with Co6.25Fe18.75Ni75Ox as both anode and cathode by acquiring linear sweep voltammetry (LSV) polarization curves with 90% iR-compensation at a scan rate of 5 mV s−1 and chronoamperometric curves at a constant current density without iR-compensation.3. Results and discussion
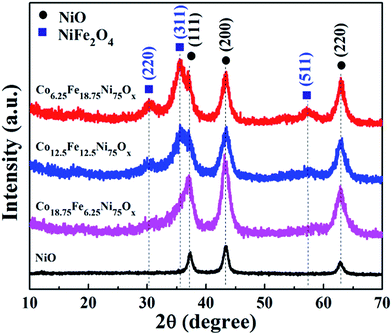
X-ray diffraction (XRD) patterns were first applied to examine the effects of the Fe/Co ratio on the crystalline phases and compositions of the samples. As shown in Fig. 1, when the feeding ratio of Fe/Co was 1![[thin space (1/6-em)]](https://www.rsc.org/images/entities/char_2009.gif) :
:![[thin space (1/6-em)]](https://www.rsc.org/images/entities/char_2009.gif) 3, the sample primarily showed the reflections of cubic NiO (JCPDS No. 78-0643). As the feeding ratio of Fe/Co was increased to 1
3, the sample primarily showed the reflections of cubic NiO (JCPDS No. 78-0643). As the feeding ratio of Fe/Co was increased to 1![[thin space (1/6-em)]](https://www.rsc.org/images/entities/char_2009.gif) :
:![[thin space (1/6-em)]](https://www.rsc.org/images/entities/char_2009.gif) 1, in addition to the reflections of cubic NiO, two peaks at 2θ about 30.3° and 35.7° appeared; these can be attributed to the diffraction peaks of the (220) and (311) planes of spinel NiFe2O4, respectively (JCPDS No. 74-2081), indicating the formation of NiO/NiFe2O4 mixed oxide. When the feeding ratio of Fe/Co was further increased to 3
1, in addition to the reflections of cubic NiO, two peaks at 2θ about 30.3° and 35.7° appeared; these can be attributed to the diffraction peaks of the (220) and (311) planes of spinel NiFe2O4, respectively (JCPDS No. 74-2081), indicating the formation of NiO/NiFe2O4 mixed oxide. When the feeding ratio of Fe/Co was further increased to 3![[thin space (1/6-em)]](https://www.rsc.org/images/entities/char_2009.gif) :
:![[thin space (1/6-em)]](https://www.rsc.org/images/entities/char_2009.gif) 1, the diffraction peaks at 30.3° and 35.7° were stronger, and another diffraction peak at 57.4° attributed to the (511) plane of NiFe2O4 appeared; this suggests that more NiFe2O4 phase was formed. Meanwhile, without addition of Fe and Co sources, the sample was pure NiO. Moreover, the diffraction peaks of the Co-doped NiO/NiFe2O4 samples showed no noticeable shifts.
1, the diffraction peaks at 30.3° and 35.7° were stronger, and another diffraction peak at 57.4° attributed to the (511) plane of NiFe2O4 appeared; this suggests that more NiFe2O4 phase was formed. Meanwhile, without addition of Fe and Co sources, the sample was pure NiO. Moreover, the diffraction peaks of the Co-doped NiO/NiFe2O4 samples showed no noticeable shifts.
To reveal the roles of the Co and Fe sources in determining the final phases of the samples, contrast experiments with addition of only Co or Fe source were carried out. When only Co source was introduced, the XRD patterns of the samples could be all readily indexed to cubic NiO (Fig. S1a†); no apparent peak shift was observed, demonstrating that the similar radii of Co and Ni atoms enable Co atoms to substitute Ni atoms in the lattice of NiO without noticeable changes in the lattice constants. When only Fe source was introduced, the reflections of the XRD patterns could be indexed to cubic NiO with the addition of 0.25 mmol Fe source (Fig. S1b†); the reflections showed a slight shift to lower 2θ angles, revealing that the lattice constants are shifted to higher values and implying substitutional incorporation of some Fe ions into the cubic NiO structure. The XRD patterns of the samples with addition of 0.5 and 0.75 mmol Fe source presented NiFe mixed oxides of cubic NiO and spinel NiFe2O4. It can be seen that the diffraction peaks of Co-doped NiO/NiFe2O4 samples with addition of 0.5 and 0.75 mmol Fe source showed no peak shifts compared with the corresponding NiO/NiFe2O4 samples, further suggesting that Co doping has no effect on the lattice constants of NiO/NiFe2O4.
Raman spectroscopy is an excellent complement to XRD because it can also detect small amounts of crystalline nanoparticles and amorphous phases that cannot be detected by XRD. Raman spectroscopy was utilized to investigate the as-prepared oxide phases. As shown in Fig. 2, a broad peak at 490 cm−1 was present in the spectrum of the pure NiO sample, in agreement with the literature.22 After addition of Co and Fe sources, the samples exhibited three Raman bands at about 470, 550 and 680 cm−1, indicative of spinel NiFe2O4 phase.8 Although the sample with the feeding ratio of Fe/Co 1![[thin space (1/6-em)]](https://www.rsc.org/images/entities/char_2009.gif) :
:![[thin space (1/6-em)]](https://www.rsc.org/images/entities/char_2009.gif) 3 only showed the reflections of cubic NiO in its XRD pattern, Raman spectroscopy detected the presence of spinel NiFe2O4 phase. With the addition of only Co source, the peak attributed to NiO was shifted to higher wavenumbers at about 530 cm−1 (Fig. S2a†). When only Fe source was added, the samples exhibited three Raman bands at about 480, 560 and 690 cm−1 (Fig. S2b†), from which we can deduce that the bands of the Co-doped NiO/NiFe2O4 samples were negatively shifted; this demonstrates that Co doping can adjust the electronic structure of the samples.
3 only showed the reflections of cubic NiO in its XRD pattern, Raman spectroscopy detected the presence of spinel NiFe2O4 phase. With the addition of only Co source, the peak attributed to NiO was shifted to higher wavenumbers at about 530 cm−1 (Fig. S2a†). When only Fe source was added, the samples exhibited three Raman bands at about 480, 560 and 690 cm−1 (Fig. S2b†), from which we can deduce that the bands of the Co-doped NiO/NiFe2O4 samples were negatively shifted; this demonstrates that Co doping can adjust the electronic structure of the samples.
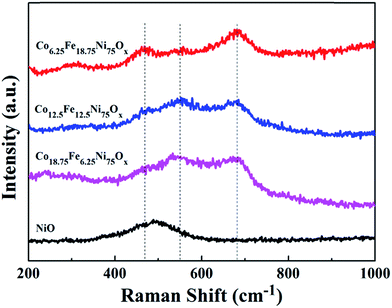 | ||
Fig. 2 Raman spectra of the Co-doped NiFe mixed oxides and pure NiO. From bottom to top: pure NiO; Co-doped NiFe mixed oxide samples fabricated with Fe/Co ratios of 1![[thin space (1/6-em)]](https://www.rsc.org/images/entities/char_2009.gif) : :![[thin space (1/6-em)]](https://www.rsc.org/images/entities/char_2009.gif) 3, 1 3, 1![[thin space (1/6-em)]](https://www.rsc.org/images/entities/char_2009.gif) : :![[thin space (1/6-em)]](https://www.rsc.org/images/entities/char_2009.gif) 1 and 3 1 and 3![[thin space (1/6-em)]](https://www.rsc.org/images/entities/char_2009.gif) : :![[thin space (1/6-em)]](https://www.rsc.org/images/entities/char_2009.gif) 1, respectively. 1, respectively. | ||
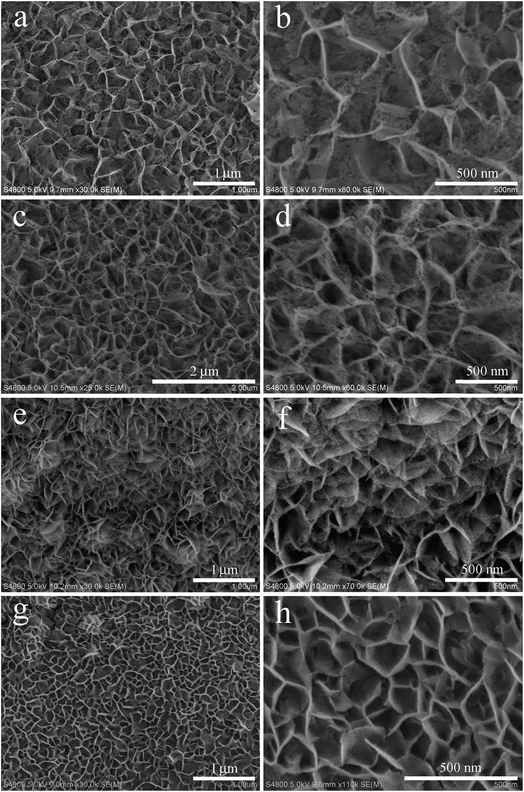
The morphologies of the Co-doped NiFe mixed oxide samples were investigated by scanning electron microscope (SEM). A pure NiO mesoporous nanosheet array on Ni foam without addition of Fe and Co sources was obtained (Fig. 3a and b) in which the average lateral size of the nanosheets was about 450 nm. Careful observation reveals that many mesopores are distributed on the surface of the nanosheets. After introduction of Fe and Co sources with a Fe/Co ratio of 1![[thin space (1/6-em)]](https://www.rsc.org/images/entities/char_2009.gif) :
:![[thin space (1/6-em)]](https://www.rsc.org/images/entities/char_2009.gif) 3, the sample exhibited a denser mesoporous nanosheet array structure, with smaller lateral nanosheet size of about 300 nm (Fig. 3c and d). When the Fe/Co ratio was increased to 1
3, the sample exhibited a denser mesoporous nanosheet array structure, with smaller lateral nanosheet size of about 300 nm (Fig. 3c and d). When the Fe/Co ratio was increased to 1![[thin space (1/6-em)]](https://www.rsc.org/images/entities/char_2009.gif) :
:![[thin space (1/6-em)]](https://www.rsc.org/images/entities/char_2009.gif) 1, the sample showed much a denser mesoporous nanosheet array structure in which the lateral size of the nanosheets was about 250 nm (Fig. 3e and f). When the Fe/Co ratio was further increased to 3
1, the sample showed much a denser mesoporous nanosheet array structure in which the lateral size of the nanosheets was about 250 nm (Fig. 3e and f). When the Fe/Co ratio was further increased to 3![[thin space (1/6-em)]](https://www.rsc.org/images/entities/char_2009.gif) :
:![[thin space (1/6-em)]](https://www.rsc.org/images/entities/char_2009.gif) 1, a uniformly distributed mesoporous nanosheet array with the smallest nanosheets (about 180 nm) was formed (Fig. 3g and h). These results clearly indicate that the introduction of Fe and Co atoms can effectively modulate the density and size of Co-doped NiFe mixed oxide nanosheets on Ni foam. The EDX results (Fig. S3†) revealed that the chemical elements of Co, Fe, Ni and O were present in all the Co-doped NiFe mixed oxides; the atomic ratios of Co, Fe and Ni were calculated from these results and were basically consistent with the feeding ratios. When only Co source was introduced, the samples were all sparse mesoporous nanosheet arrays composed of large nanosheets (Fig. S4a–c†); as more Co atoms were introduced, the samples became more sparse. Meanwhile, when only Fe source was added, the samples were all dense nanosheet arrays with small nanosheets (Fig. S4d–f†); as more Fe atoms were introduced, the samples became denser. In addition, large cracks began to appear in the NiFe mixed oxides upon addition of 0.75 mmol Fe source (Fig. S4f†). Herein, methanol was selected as the solvent to control the hydrolysis of Ni2+ and Fe3+ and obtain well-constructed nanosheet array structure precursors. Taking Co6.25Fe18.75Ni75Ox precursor as an example, in the contrast experiment in 40 mL of deionized water, some nonuniform nanosheets-assembled flower-like structures appeared on the nanosheet array (Fig. S5†). Therefore, 40 mL of methanol was selected as the solvent to obtain the desired nanosheet array precursors. The EDX results revealed that the atomic ratios of Co and Ni in the Co-doped NiO samples as well as Fe and Ni in the NiFe mixed oxide samples were all essentially consistent with their feeding ratios (Fig. S6†).
1, a uniformly distributed mesoporous nanosheet array with the smallest nanosheets (about 180 nm) was formed (Fig. 3g and h). These results clearly indicate that the introduction of Fe and Co atoms can effectively modulate the density and size of Co-doped NiFe mixed oxide nanosheets on Ni foam. The EDX results (Fig. S3†) revealed that the chemical elements of Co, Fe, Ni and O were present in all the Co-doped NiFe mixed oxides; the atomic ratios of Co, Fe and Ni were calculated from these results and were basically consistent with the feeding ratios. When only Co source was introduced, the samples were all sparse mesoporous nanosheet arrays composed of large nanosheets (Fig. S4a–c†); as more Co atoms were introduced, the samples became more sparse. Meanwhile, when only Fe source was added, the samples were all dense nanosheet arrays with small nanosheets (Fig. S4d–f†); as more Fe atoms were introduced, the samples became denser. In addition, large cracks began to appear in the NiFe mixed oxides upon addition of 0.75 mmol Fe source (Fig. S4f†). Herein, methanol was selected as the solvent to control the hydrolysis of Ni2+ and Fe3+ and obtain well-constructed nanosheet array structure precursors. Taking Co6.25Fe18.75Ni75Ox precursor as an example, in the contrast experiment in 40 mL of deionized water, some nonuniform nanosheets-assembled flower-like structures appeared on the nanosheet array (Fig. S5†). Therefore, 40 mL of methanol was selected as the solvent to obtain the desired nanosheet array precursors. The EDX results revealed that the atomic ratios of Co and Ni in the Co-doped NiO samples as well as Fe and Ni in the NiFe mixed oxide samples were all essentially consistent with their feeding ratios (Fig. S6†).
The TEM image of the Co6.25Fe18.75Ni75Ox sample in Fig. 4a shows that it consisted of flexible and nearly transparent mesoporous nanosheets. The magnified TEM image of part of an individual nanosheet in Fig. 4b reveals that numerous mesopores with an average diameter of 2 nm were evenly distributed on the surface of the nanosheet. Therefore, the high number of exposed active edge sites could be anticipated to facilitate the dissociation of water. The HRTEM image of Co6.25Fe18.75Ni75Ox in Fig. 4c revealed that one set of adjacent fringes was 0.25 nm, corresponding to the d-spacing of the (311) planes of NiFe2O4; another set of adjacent fringes was 0.21 nm, corresponding to the d-spacing of the (200) planes of NiO. Fig. 4d presents a high-angle annular dark-field STEM image of a Co6.25Fe18.75Ni75Ox nanosheet, which further displays abundant mesoporosities on the nanosheet. The corresponding elemental mapping images suggested the homogeneous distribution of Co, Fe, Ni and O elements across the nanosheet.
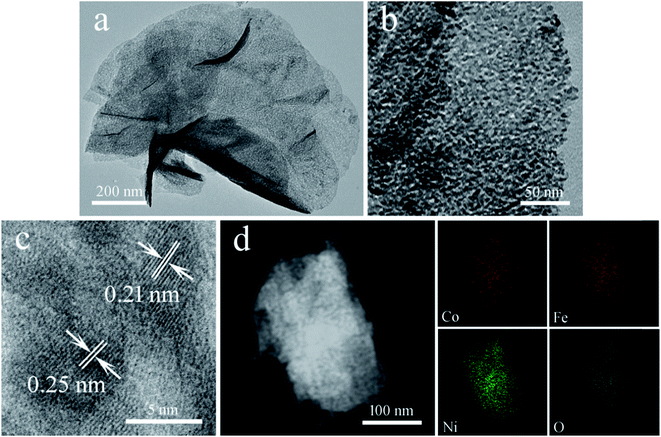 | ||
| Fig. 4 (a and b) Low- and high-magnification TEM images, (c) HRTEM image, (d) STEM image and corresponding elemental mapping images of Co6.25Fe18.75Ni75Ox. | ||
The surface chemical valence states on Co6.25Fe18.75Ni75Ox were examined by X-ray photoelectron spectroscopy (XPS). As shown in Fig. 5a, the Ni 2P XPS spectrum showed two peaks located at 855.3 and 873.1 eV, which can be ascribed to Ni 2p3/2 and Ni 2p1/2, respectively, while the peaks at 861.7 and 880.2 eV can be assigned to the Ni satellite peaks of NiO.23 The fitting peaks of the Fe 2p spectrum showed a peak at 705.2 eV (Fig. 5b), which is the Ni auger peak.24 The peaks at 711.6 and 724.8 eV correspond to Fe 2p3/2 and Fe 2p1/2, respectively, which are typical for Fe3+.8,22,25 The missing shakeup satellites at 719 and 732 eV excluded the presence of a separate Fe2O3 phase.8 As shown in Fig. 5c, the deconvolved peaks of Co 2p with binding energies at 781.3 and 796.4 eV can be ascribed to Co2+ 2p3/2 and Co2+ 2p1/2, respectively, and the peaks at 786.8 and 803.8 eV can be individually assigned to the satellite peaks of Co2+ 2p3/2 and Co2+ 2p1/2, suggesting the presence of Co2+.26,27 The O 1s spectrum in Fig. 5d exhibited two binding energies of 530.2 and 531.7 eV, which correspond to the lattice oxygen and surface hydroxyl oxygen, respectively.28,29 The XPS spectra of three Co-doped NiO samples presented the binding energies of Ni 2p without obvious shifts (Fig. S7a†); however, those of Co 2p (Fig. S7b†) and O 1s (Fig. S7c†) were negatively shifted with increasing Co content, indicating that Co doping can promote electron transfer from Ni atoms to Co atoms in Co-doped NiO. The XPS spectra of the three Co-doped NiO/NiFe2O4 samples showed the binding energies of Ni 2p (Fig. S8a†) and Fe 2p (Fig. S8b†) without noticeable shifts; however, those of Co 2p (Fig. S8c†) and O 1s (Fig. S8d†) were positively shifted with decreasing Co content. Moreover, the peak positions of Co 2p in Co-doped NiO/NiFe2O4 shifted slightly to higher binding energies compared with those in Co-doped NiO. These results indicate that electrons were transferred from Ni atoms to Co atoms and Fe atoms in Co-doped NiO/NiFe2O4.
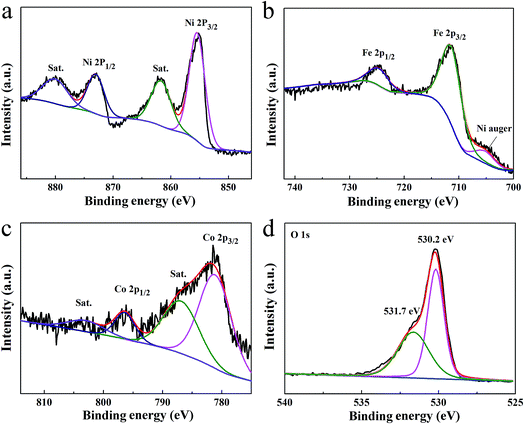 | ||
| Fig. 5 High-resolution XPS spectra of Ni 2p (a), Fe 2p (b), Co 2p (c), and O 1s (d) of Co6.25Fe18.75Ni75Ox. | ||
The effective electrochemical surface areas (ECSAs) of the Co-doped NiFe mixed oxide samples were estimated by measuring their double layer capacitances (Cdl) (without faradaic processes) by cyclic voltammetry at different scan rates (Fig. S9†). The Cdl increased from 3.48 mF cm−2 for pure NiO to 3.92 mF cm−2 for Co18.75Fe6.25Ni75Ox and increased to 5.62 mF cm−2 for Co12.5Fe12.5Ni75Ox; then, the Cdl increased to a maximum of 8.39 mF cm−2 for Co6.25Fe18.75Ni75Ox. These results demonstrate that introduction of Co and Fe atoms is a feasible method to modulate the ECSAs of Co-doped NiFe mixed oxide samples.
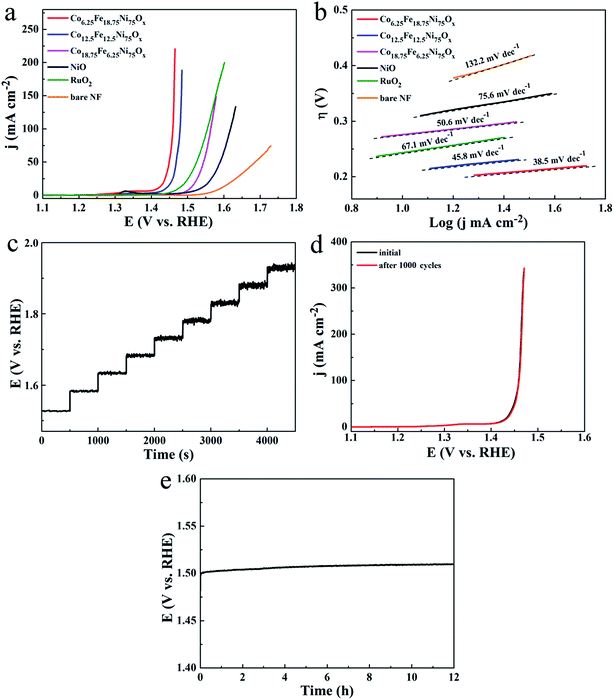
The electrocatalytic activities of the Co-doped NiFe mixed oxides for OER were evaluated. The polarization curves in Fig. 6a showed that all the Co-doped NiFe mixed oxide mesoporous nanosheet arrays demonstrated higher OER activity than pure NiO; among the arrays, the Co6.25Fe18.75Ni75Ox sample exhibited the highest OER activity, with the lowest overpotentials of 186, 219 and 228 mV at 10, 50 and 100 mA cm−2, respectively, and could achieve 220.7 mA cm−2 at a quite small overpotential of 235 mV. For RuO2 catalyst, the required overpotentials to reach 10, 50 and 100 mA cm−2 were 244, 294 and 323 mV, respectively. Remarkably, Co6.25Fe18.75Ni75Ox exhibited better OER catalytic activity than RuO2. The Ni foam substrate had poor OER activity and contributed only slightly to the catalytic performance of the Co-doped NiFe mixed oxide mesoporous nanosheet array. The corresponding OER LSV curves of Co6.25Fe18.75Ni75Ox electrode with and without iR correction are shown in Fig. S10.† The OER mass activity of Co6.25Fe18.75Ni75Ox (Fig. S11†) was 55.2 A g−1 at a quite small overpotential of 235 mV, which is 84-fold higher than that of NiO. The variation of the OER catalytic activity for different Co-doped NiFe mixed oxides should be related to the different Fe and Co contents as well as the change of ECSAs. The superior OER activity of Co6.25Fe18.75Ni75Ox was confirmed by its smallest Tafel slope of 38.5 mV dec−1 (Fig. 6b), which is indicative of prominent electrocatalytic performance. The low overpotential and small Tafel slope of Co6.25Fe18.75Ni75Ox demonstrated its outstanding catalytic activity for OER; these values are comparable to or better than those of other state-of-the-art Ni-based OER catalysts, as listed in Table S1.†
To reveal the roles of Co and Fe atoms in the Co-doped NiFe mixed oxide for the enhanced OER activity, comparative experiments with individual addition of Co or Fe source to the reaction system were carried out. When only Co source was added, the OER catalytic activity of Co-doped NiO was somewhat enhanced compared to that of pure NiO; the Co14.3Ni85.7Ox electrode exhibited the highest catalytic activity, with overpotentials of 270, 317 and 338 mV at 10, 50 and 100 mA cm−2, respectively (Fig. S12a†). These values are obviously much larger than those of the Co6.25Fe18.75Ni75Ox electrode. When only Fe source was added, the OER catalytic activity of NiFe mixed oxide was significantly improved compared to that of pure NiO; the Fe14.3Ni85.7Ox electrode showed the highest catalytic activity, with overpotentials of 204, 238 and 247 mV to afford 10, 50 and 100 mA cm−2, respectively (Fig. S12b†). However, these values were also inferior to those of the Co6.25Fe18.75Ni75Ox electrode. These results indicate that the Co and Fe atoms play a synergistic role in enhancing the OER catalytic activity of NiO. Fig. 6c presents a multi-step chronopotentiometric curve for the Co6.25Fe18.75Ni75Ox electrode. The potential instantaneously levels off at 1.527 V at 50 mA cm−2 and remains constant for the next 500 s; the other steps present similar results up to 500 mA cm−2, demonstrating the outstanding mass transport properties and mechanical robustness of the Co6.25Fe18.75Ni75Ox electrode. Stability is a crucial parameter to assess the quality of an electrocatalyst. Long-term potential cycling tests of the Co6.25Fe18.75Ni75Ox electrode were conducted by acquiring continuous cyclic voltammograms between 1.0 and 1.6 V (vs. RHE) at a scanning rate of 50 mV s−1 for 1000 cycles. The polarization curve of this catalyst displayed negligible loss of anodic current after 1000 cycles (Fig. 6d). The long-term durability of Co6.25Fe18.75Ni75Ox for OER was assessed by continuous galvanostatic measurement for 12 h at 20 mA cm−2 (Fig. 6e). The overpotential of this electrode slightly increased by about 10 mV during 12 h of continuous galvanostatic electrolysis, manifesting its outstanding stability for OER. The morphology and phase of the sample were well preserved after the long-term durability test, as indicated by SEM and TEM images, XRD patterns and XPS spectra (Fig. S13†).
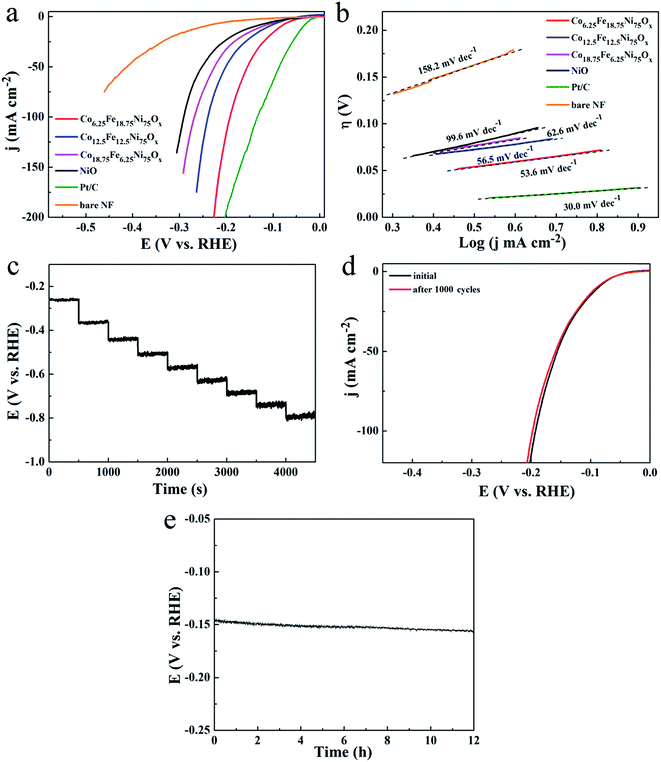
The catalytic activity for hydrogen evolution displayed a similar trend on the Co-doped NiFe mixed oxide mesoporous nanosheet arrays. The polarization curves of the Co-doped NiFe mixed oxide electrodes all showed improved HER activity compared to the NiO electrode (Fig. 7a); the Co6.25Fe18.75Ni75Ox electrode presented the highest HER activity, exhibiting a rapid increase in current density with applied potential. The overpotentials of the Co6.25Fe18.75Ni75Ox electrode required to deliver cathodic current densities of 10, 50 and 100 mA cm−2 were 84, 155 and 192 mV, respectively, which are much smaller than those for NiO (146, 251 and 291 mV at 10, 50 and 100 mA cm−2, respectively). The corresponding HER LSV curves of Co6.25Fe18.75Ni75Ox electrode with and without iR correction are shown in Fig. S14.† The HER mass activity of Co6.25Fe18.75Ni75Ox was 6.8 A g−1 at an overpotential of 125 mV (Fig. S15†), which is 3.5 times higher than that of NiO. Although Pt/C electrode manifested prominent activity for HER, the overpotentials of the Co6.25Fe18.75Ni75Ox electrode were comparable to or smaller than those of other state-of-the-art Ni-based HER catalysts, as listed in Table S2,† indicating that the present Co6.25Fe18.75Ni75Ox electrode also exhibits excellent catalytic performance for HER. The corresponding Tafel slopes, shown in Fig. 7b, reveal a value of 53.6 mV dec−1 for Co6.25Fe18.75Ni75Ox, which is smaller than that of the other Co-doped NiFe mixed oxides and NiO and comparable to or better than most Ni-based catalysts for HER (Table S2†). The Tafel slope is generally determined at a small overpotential where the apparent increase in current density begins. The current density of the Pt/C electrode increased more greatly than that of the Co6.25Fe18.75Ni75Ox electrode in the overpotential range where the current density began to evidently increase, leading to a lower Tafel slope of the Pt/C electrode (30.0 mV dec−1). However, the overpotential of the Pt/C electrode increased quickly at high current density because the glued Pt/C catalyst tends to readily detach from the substrate. Similar results for glued Pt/C electrodes were observed in other studies.16,30 The comparative experiments with Co-doped NiO catalysts showed that their HER catalytic activities were slightly enhanced compared to NiO, and the Co doping content had no obvious effect on the HER activity (Fig. S16a†). Meanwhile, the HER catalytic activities of the NiFe mixed oxide catalysts were significantly improved; Fe14.3Ni85.7Ox manifested the highest activity, with overpotentials of 115, 216 and 262 mV at 10, 50 and 100 mA cm−2, respectively (Fig. S16b†). However, these values are obviously inferior to those of the Co6.25Fe18.75Ni75Ox electrode. These results indicate that the concurrent introduction of Co and Fe atoms can significantly enhance the HER catalytic performance of NiO.
Tafel slopes are commonly used to distinguish the predominant HER mechanism. In alkaline electrolyte, this can be either the Volmer–Heyrovsky or Volmer–Tafel pathway. When the rate-limiting step is the Volmer, Heyrovsky, or Tafel reaction, the Tafel slope will be ∼120, ∼40, or ∼30 mV dec−1, respectively.31 Therefore, the HER over the Co-doped NiFe mixed oxide nanosheet array proceeded via a Volmer–Heyrovsky mechanism, where rapid discharge of a proton is followed by the rate-limiting electrochemical step of recombination with an additional proton.
A multi-step chronopotentiometric curve of the Co6.25Fe18.75Ni75Ox electrode from 50 mA cm−2 to 500 mA cm−2 demonstrated good voltage response vs. current density (Fig. 7c), manifesting that this electrode also has outstanding mass transport properties and mechanical robustness for HER. To assess the HER stability of the Co6.25Fe18.75Ni75Ox electrode, a deterioration experiment was conducted by applying potential sweeps from −0.3 to +0.3 V for 1000 cycles. The polarization curve after the sweeps showed only a slight increase in overpotential (Fig. 7d). The long-term electrochemical stability of this electrode was further evaluated by galvanostatic measurement at 20 mA cm−2 for 12 h. The potential increased by only 9.7 mV at the end of 12 h of electrolysis (Fig. 7e), indicating the superior stability of the Co6.25Fe18.75Ni75Ox electrode for HER in the long-term electrochemical process. The durability test presented no obvious effects on the morphology or phase of the catalyst (Fig. S17†), demonstrating that the Co6.25Fe18.75Ni75Ox electrode is also cathodically stable in strongly alkaline media.
Because EIS provides information relating to the internal resistance of an electrode material and the resistance between the electrode and the electrolyte, EIS measurements were performed to further elucidate the superior electrochemical performance of the Co-doped NiFe mixed oxide mesoporous nanosheet array. Fig. 8 presents the Nyquist plots of the Co-doped NiFe mixed oxides and NiO electrodes; all the plots are composed of a depressed semicircle in the high-frequency region, which can be assigned to the charge transfer resistance of the electrode/electrolyte interface. It can be seen that the semicircles of the Co-doped NiFe mixed oxide electrodes are all much smaller than that of NiO; this indicates the greatly increased conductivity of the Co-doped NiFe mixed oxide electrode, which can improve the charge transfer kinetics and contribute to superior electrochemical performance in OER and HER. The EIS of the Co-doped NiO and NiFe mixed oxide electrodes all manifested greatly increased conductivity compared to NiO (Fig. S18†), in which the Co-doped NiO electrodes presented better electrical conductivity than the NiFe mixed oxide electrodes. The results also showed that the conductivities of the Co-doped NiFe mixed oxides were better than those of the NiFe mixed oxides, which contributed to their better electrochemical activities.
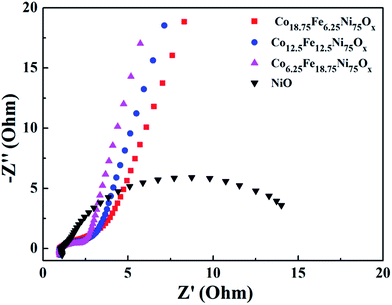 | ||
| Fig. 8 Nyquist plots of the Co-doped NiFe mixed oxide electrodes. As a comparison, the plot of NiO is also presented. | ||
The excellent electrocatalytic performance of the Co-doped NiFe mixed oxide nanosheet array electrode for OER and HER can be ascribed to its unique architecture, including the mesoporous nanosheet array structure, the introduction of NiFe2O4 active phase and Co2+ doping. The open spaces between the nanosheets and the mesopores within the nanosheets offer rich accessible electroactive sites, superior electron collection efficiency and buffering of the large volume changes during reversible redox reactions. The enhancement of the OER and HER activities of the NiFe mixed oxides in comparison to NiO can be attributed to the introduction of NiFe2O4 active phase.32 The further enhancement of the OER and HER performances of the Co-doped NiFe mixed oxides can be ascribed to conductivity and charge-transfer effects. The enhanced conductivity of Co-doped NiO/Ni2FeO4 elevates its charge transfer kinetics and contributes to the superior electrochemical performance of OER and HER. The Co doping in NiFe mixed oxides enables electron transfer from Ni atoms to Co atoms and Fe atoms. The electron-deficient Ni atoms can readily adsorb hydroxyl or oxyhydroxyl groups, which is beneficial for OER kinetics. The charge-transfer effects of Co promote oxidation of Ni to the more conductive NiOOH phase at lower overpotentials.33 Meanwhile, electron-enriched Co atoms are prone to obtain electrons and react with adsorbed water molecules to produce hydrogen atoms, resulting in efficient HER activity. As the OER and HER kinetics are most favorable with moderate coverage of the intermediates, the appropriate electron transfer in Co6.25Fe18.75Ni75Ox endows this catalyst with superior activity for both OER and HER.
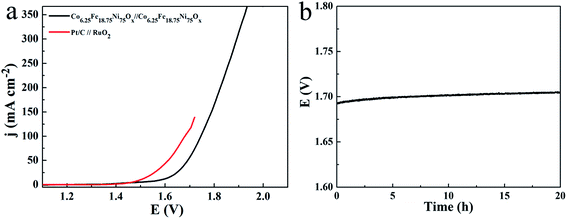
Because the Co6.25Fe18.75Ni75Ox mesoporous nanosheet array can be used as an active and durable catalyst for both OER and HER in 1.0 M KOH, a two-electrode electrolyzer was assembled with Co6.25Fe18.75Ni75Ox as both the anode and cathode. The linear sweep voltammogram curve of the overall water electrolysis on Co6.25Fe18.75Ni75Ox is presented in Fig. 9a. For comparison, the Pt/C‖RuO2 couple was also investigated. As expected, the Pt/C‖RuO2 couple produced an excellent catalytic system at low current density. However, the Pt/C‖RuO2 couple tended to readily detach from the Ni foam substrate at high current density because Pt/C and RuO2 were glued on the Ni foam. Therefore, the single-cell water electrolyzer tested with the Pt/C‖RuO2 couple provided a current density of less than 150 mA cm−2. The Co6.25Fe18.75Ni75Ox‖Co6.25Fe18.75Ni75Ox couple only required 1.583 V to reach 10 mA cm−2. This excellent low potential is comparable to or lower than the values for recently reported state-of-the-art catalysts, such as 1.68 V for Ni(OH)2 nanosheets/NF,34 1.66 V for NiSe2 nanoparticle film/Ti,35 1.60 V for NiFe-LDH ultrathin sheets/NiCo2O4 nanowires,36 1.6 V for Co–Ni–Se/C/NF,30 1.63 V for NiSe nanowire film/NF,37 1.61 V for CoNi2Se4 on carbon fiber paper,38 1.62 V for Co0.13Ni0.87Se2/Ti,39 1.59 V for NiCoP/rGO/CFP,40 and 1.612 V for Ni3Se2 nanoforest/NF.41 A chronopotentiometric test at 20 mA cm−2 for 20 h showed a slight overpotential loss of 12 mV (Fig. 9b), suggesting that the catalyst is very stable after long-term operation. Therefore, the Co-doped NiFe mixed oxide mesoporous nanosheet array is a promising low cost, highly active, and stable bifunctional electrocatalyst for overall water splitting.
The actual amounts of generated O2 and H2 were determined by gas chromatography in an H-type electrolytic cell with a separate anode and cathode. The amounts of experimentally quantified gases produced during electrolysis at 20 mA cm−2 are presented in Fig. 10 and are roughly in agreement with theoretically calculated values, with faradic efficiencies over 92% for both OER and HER.
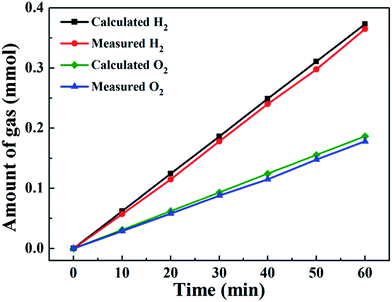 | ||
| Fig. 10 Amounts of gas experimentally measured and theoretically calculated vs. time for Co6.25Fe18.75Ni75Ox at 20 mA cm−2. | ||
4. Conclusions
A Co-doped NiFe mixed oxide mesoporous nanosheet array with controllable composition and morphology has been constructed on Ni foam by a simple solvothermal reaction in methanol followed by an annealing process. The optimized Co6.25Fe18.75Ni75Ox can be used as a novel active and durable bifunctional electrocatalyst for both OER and HER. The small overpotentials of 186, 219, and 228 mV at 10, 50 and 100 mA cm−2 for OER are lower than those of most reported Ni-based compounds, while the small overpotentials of 84, 155 and 192 mV at 10, 50 and 100 mA cm−2 for HER manifest that Co6.25Fe18.75Ni75Ox can also serve as an efficient HER electrode. As a result, a two-electrode water electrolyzer using this Co6.25Fe18.75Ni75Ox electrode provides a current density of 10 mA cm−2 at a cell voltage of 1.583 V and shows long durability. The mesoporous nanosheet array structure offers a large number of catalytically active sites and open channels for ion and electron transport. Moreover, NiFe2O4 is a catalytic active phase. In addition, Co2+ doping in NiO/NiFe2O4 can increase its conductivity and activate the Ni sites at lower overpotentials via charge transfer effects. This work may encourage the design and exploration of new cost-effective multimetal bifunctional electrodes for enhanced OER and HER electrocatalysis.Conflicts of interest
There are no conflicts to declare.Acknowledgements
The financial support of the Natural Science Foundation of China (2157050547 and 21671006) is greatly acknowledged.References
- N. Danilovic, R. Subbaraman, K. C. Chang, S. H. Chang, Y. Kang, J. Snyder, A. P. Paulikas, D. Strmcnik, Y. T. Kim, D. Myers, V. R. Stamenkovic and N. M. Markovic, Angew. Chem., Int. Ed., 2014, 53, 14016–14021 CrossRef CAS PubMed.
- Y. Lee, J. Suntivich, K. J. May, E. E. Perry and Y. Shao-Horn, J. Phys. Chem. Lett., 2012, 3, 399–404 CrossRef CAS PubMed.
- Y. Jiao, Y. Zheng, M. Jaroniec and S. Z. Qiao, Chem. Soc. Rev., 2015, 44, 2060–2086 RSC.
- S. Bai, C. Wang, M. Deng, M. Gong, Y. Bai, J. Jiang and Y. Xiong, Angew. Chem., Int. Ed., 2014, 53, 12120–12124 CrossRef CAS PubMed.
- N. Du, C. Wang, X. Wang, Y. Lin, J. Jiang and Y. Xiong, Adv. Mater., 2016, 28, 2077–2084 CrossRef CAS PubMed.
- C. C. L. McCrory, S. Jung, J. C. Peters and T. F. Jaramillo, J. Am. Chem. Soc., 2013, 135, 16977–16987 CrossRef CAS PubMed.
- M. W. Louie and A. T. Bell, J. Am. Chem. Soc., 2013, 135, 12329–12337 CrossRef CAS PubMed.
- J. Landon, E. Demeter, N. İnoğlu, C. Keturakis, I. E. Wachs, R. Vasić, A. I. Frenkel and J. R. Kitchin, ACS Catal., 2012, 2, 1793–1801 CrossRef CAS.
- L. Trotochaud, J. K. Ranney, K. N. Williams and S. W. Boettcher, J. Am. Chem. Soc., 2012, 134, 17253–17261 CrossRef CAS PubMed.
- R. D. Smith, M. S. Prevot, R. D. Fagan, S. Trudel and C. P. Berlinguette, J. Am. Chem. Soc., 2013, 135, 11580–11586 CrossRef CAS PubMed.
- G. Liu, X. Gao, K. Wang, D. He and J. Li, Nano Res., 2017, 10, 2096–2105 CrossRef CAS.
- Y. Qiu, L. Xin and W. Li, Langmuir, 2014, 30, 7893–7901 CrossRef CAS PubMed.
- X. Lu and C. Zhao, Nat. Commun., 2015, 6, 6616 CrossRef CAS PubMed.
- F. Zhang, Y. Shi, T. Xue, J. Zhang, Y. Liang and B. Zhang, Sci. China Mater., 2017, 60, 324–334 CrossRef.
- J. Bao, X. Zhang, B. Fan, J. Zhang, M. Zhou, W. Yang, X. Hu, H. Wang, B. Pan and Y. Xie, Angew. Chem., Int. Ed., 2015, 54, 7399–7404 CrossRef CAS PubMed.
- D. Liu, C. Zhang, Y. Yu, Y. Shi, Y. Yu, Z. Niu and B. Zhang, Nano Res., 2017 DOI:10.1007/s12274-017-1670-8.
- J. Yin, P. Zhou, L. An, L. Huang, C. Shao, J. Wang, H. Liu and P. Xi, Nanoscale, 2016, 8, 1390–1400 RSC.
- J. Fan, Z. Chen, H. Shi and G. Zhao, Chem. Commun., 2016, 52, 4290–4293 RSC.
- Y. Li, S. Yang, H. Li, G. Li, M. Li, L. Shen, Z. Yang and A. Zhou, Colloids Surf., A, 2016, 506, 694–702 CrossRef CAS.
- T. Tang, W. J. Jiang, S. Niu, N. Liu, H. Luo, Y. Y. Chen, S. F. Jin, F. Gao, L. J. Wan and J. S. Hu, J. Am. Chem. Soc., 2017, 139, 8320–8328 CrossRef CAS PubMed.
- X. Han, Y. Yu, Y. Huang, D. Liu and B. Zhang, ACS Catal., 2017, 7, 6464–6470 CrossRef CAS.
- K. Fominykh, P. Chernev, I. Zaharieva, J. Sicklinger, G. Stefanic, M. Döblinger, A. Müller, A. Pokharel, S. Böcklein, C. Scheu, T. Bein and D. Fattakhova-Rohlfing, ACS Nano, 2015, 9, 5180–5188 CrossRef CAS PubMed.
- K. Xu, H. Ding, K. Jia, X. Lu, P. Chen, T. Zhou, H. Cheng, S. Liu, C. Wu and Y. Xie, Angew. Chem., Int. Ed., 2016, 55, 1710–1713 CrossRef CAS PubMed.
- L. Wang, J. Geng, W. Wang, C. Yuan, L. Kuai and B. Geng, Nano Res., 2015, 8, 3815–3822 CrossRef CAS.
- J. Yan, Y. Huang, X. Chen and C. Wei, Synth. Met., 2016, 221, 291–298 CrossRef CAS.
- C. Sun, Q. Dong, J. Yang, Z. Dai, J. Lin, P. Chen, W. Huang and X. Dong, Nano Res., 2016, 9, 2234–2243 CrossRef CAS.
- T. Liu, Q. Liu, A. M. Asiri, Y. Luo and X. Sun, Chem. Commun., 2015, 51, 16683–16686 RSC.
- J. Wang, G. Yang, L. Wang and W. Yan, J. Mater. Chem. A, 2016, 4, 8620–8629 CAS.
- J. Lu, X. Wei, Y. Chang, S. Tian and Y. Xiong, J. Chem. Technol. Biotechnol., 2016, 91, 985–993 CrossRef CAS.
- F. Ming, H. Liang, H. Shi, X. Xu, G. Mei and Z. Wang, J. Mater. Chem. A, 2016, 4, 15148–15155 CAS.
- H. Zhang, B. Yang, X. Wu, Z. Li, L. Lei and X. Zhang, ACS Appl. Mater. Interfaces, 2015, 7, 1772–1779 CAS.
- Y.-F. Li and A. Selloni, ACS Catal., 2014, 4, 1148–1153 CrossRef CAS.
- M. K. Bates, Q. Jia, H. Doan, W. Liang and S. Mukerjee, ACS Catal., 2016, 6, 155–161 CrossRef CAS.
- Y. Rao, Y. Wang, H. Ning, P. Li and M. Wu, ACS Appl. Mater. Interfaces, 2016, 8, 33601–33607 CAS.
- Z. Pu, Y. Luo, A. M. Asiri and X. Sun, ACS Appl. Mater. Interfaces, 2016, 8, 4718–4723 CAS.
- Z. Wang, S. Zeng, W. Liu, X. Wang, Q. Li, Z. Zhao and F. Geng, ACS Appl. Mater. Interfaces, 2017, 9, 1488–1495 CAS.
- C. Tang, N. Cheng, Z. Pu, W. Xing and X. Sun, Angew. Chem., Int. Ed., 2015, 54, 9351–9355 CrossRef CAS PubMed.
- B. G. Amin, A. T. Swesi, J. Masud and M. Nath, Chem. Commun., 2017, 53, 5412–5415 RSC.
- T. Liu, A. M. Asiri and X. Sun, Nanoscale, 2016, 8, 3911–3915 RSC.
- J. Li, M. Yan, X. Zhou, Z.-Q. Huang, Z. Xia, C.-R. Chang, Y. Ma and Y. Qu, Adv. Funct. Mater., 2016, 26, 6785–6796 CrossRef.
- R. Xu, R. Wu, Y. Shi, J. Zhang and B. Zhang, Nano Energy, 2016, 24, 103–110 CrossRef CAS.
Footnote |
| † Electronic supplementary information (ESI) available. See DOI: 10.1039/c7ta07956g |
| This journal is © The Royal Society of Chemistry 2018 |

