Effect of surfactant tail length and ionic strength on the interfacial properties of nanoparticle–surfactant complexes†
Stephanie M.
Kirby
,
Shelley L.
Anna
 and
Lynn M.
Walker
 *
*
Department of Chemical Engineering, Center for Complex Fluids Engineering, Carnegie Mellon University, Pittsburgh, PA 15213, USA. E-mail: lwalker@andrew.cmu.edu
First published on 29th November 2017
Abstract
Mixed nanoparticle–surfactant systems are effective foam stabilizing agents, but the lack of colloidal stability of the bulk dispersions makes interfacial characterization challenging. This study investigates the adsorption of CnTAB/SiO2 complexes at air/water interfaces through surface tension and interfacial rheology measurements. The effects of surfactant tail length, ionic strength, and interfacial processing on the surface properties are measured utilizing a bulk reservoir exchange methodology to avoid bulk destabilization. The surfactant structure controls the surface tension of the system, but has minimal impact on particle surface coverage or interfacial mechanics. Once adsorbed, nanoparticles remain pinned at the surface, while the surfactant is able to desorb upon bulk exchange with deionized water. Particle packing on the interface governs the interfacial mechanics, which can be modified by increasing the ionic strength of the bulk solution. Fully rigid interfaces can be generated at low particle coverages by controlling the ionic strength and interfacial processing. These findings contribute to the understanding of mixed particle–surfactant systems and inform formulation and process design to achieve the desired interfacial mechanical properties.
Introduction
Nanoparticles are well known to stabilize foams by adsorbing at air/water interfaces.1,2 Particle adsorption lends steric stability to interfaces not provided by classical stabilizers such as surfactants, reducing the rate of bubble coalescence and emulsion coarsening.3–6 The energy required to adsorb a particle at an air/water interface is estimated by E = πR2γ(1 ± cos![[thin space (1/6-em)]](https://www.rsc.org/images/entities/char_2009.gif) θ)2, where R is the radius of the particle, γ is the air/water surface tension, and θ is the particle contact angle at the interface.7 Values of adsorption energy for 10 nm nanoparticles with partial wettability at air/water interfaces can range from 102–103kT, offsetting thermal motion and resulting in particles that adsorb irreversibly to the interface. The adsorption energy can be directly tuned by modifying the contact angle of the particle through the addition of modifiers, such as electrostatically bound surfactants or covalently-grafted thiols.8–14
θ)2, where R is the radius of the particle, γ is the air/water surface tension, and θ is the particle contact angle at the interface.7 Values of adsorption energy for 10 nm nanoparticles with partial wettability at air/water interfaces can range from 102–103kT, offsetting thermal motion and resulting in particles that adsorb irreversibly to the interface. The adsorption energy can be directly tuned by modifying the contact angle of the particle through the addition of modifiers, such as electrostatically bound surfactants or covalently-grafted thiols.8–14
In particular, the combination of negatively-charged silicon oxide nanoparticles and cationic surfactant has been previously investigated due to the relative ease of modifying contact angle by adsorbing oppositely charged surfactant on the interface.15–20 The nanoparticles alone are hydrophilic, with an estimated contact angle of θ ∼ 20–37°.21,22 Surfactant is added to hydrophobize the nanoparticles and render them surface-active, increasing the contact angle to θ ∼ 60–80° depending on surfactant coverage.17,23 Without surfactant, the hydrophilic nanoparticles are ineffective stabilizing agents, but the surfactant–nanoparticle complexes yield extremely stable foams that persist for months.18 Understanding the interfacial behavior of the complexes is important for practical formulation design. However, complications arise when characterizing the adsorption of these systems at air/water interfaces. While increasing the surfactant concentration in a dispersion of nanoparticles is an effective way to increase particle hydrophobicity, it has the effect of simultaneously reducing the net charge of the particles.8,16 This leads to destabilization of the bulk suspension, with flocculation rates increasing as concentration increases.24 As the electrostatic repulsion that keeps the particles dispersed in solution is reduced, the particles flocculate and sediment.25 Often the foams with the greatest stability are formed at or near compositions that result in bulk flocculation.
The inherently unstable nature of these systems adds difficulty to conventional interfacial characterization methods. Conflicting measurements have been reported on the effect of surfactant–nanoparticle complexes on surface tension. In some cases, the complexes reduce the surface tension below the equivalent concentration of pure surfactant;18,19,26,27 in others, no synergistic effect is observed.15,17,28,29 Measurements of the interfacial mechanics also vary; Yazhgur et al.30 measure elasticity values that span almost an order of magnitude depending on experimental conditions. It is likely that the discrepancies can be attributed to bulk flocculation impacting adsorption and interfacial behavior.
In this study, we avoid bulk flocculation as much as possible. Instead of increasing the surfactant concentration to modify particle hydrophobicity, we instead alter the surfactant tail length at a constant, low concentration. By operating at a low surfactant concentration, the nanoparticles retain a negative surface charge, preventing the rapid bulk destabilization that can cause irreproducible adsorption behavior. The work presented here aims to characterize the dynamics of adsorption of surfactant–nanoparticle complexes using a combination of surface tension and interfacial rheology measurements. Adsorption is measured at a constant dispersion concentration and is studied as a function of surface age. The approach of using dilute dispersions is expected to yield adsorption of single complexes rather than adsorption of aggregates of complexes. We assess adsorption reversibility and the effect of ionic strength on the interfacial properties by using a controlled bulk solution exchange procedure.
Materials and methods
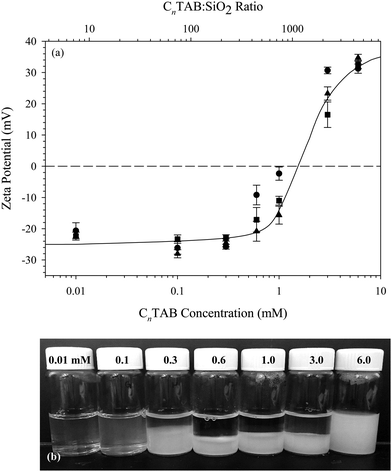
The particles used throughout this study are dispersions of Ludox® TMA SiO2 nanoparticles (Sigma, St. Louis, MO), purchased as a 34 wt% dispersion. The surfactants tetradecyltrimethylammonium bromide (C14TAB), hexadecyltrimethylammonium bromide (C16TAB), and octadecyltrimethylammonium bromide (C18TAB) (Sigma, St. Louis, MO) are purchased at 99% purity and are recrystallized twice in ethanol to remove impurities. Sodium chloride (VWR, Batavia, IL) is purchased at 99% purity and is baked at 400 °C for 5 hours to remove hydrates and impurities. A 0.5 M NaCl stock solution is prepared with deionized water immediately after baking. Deionized water is prepared by a Barnstead Ultrapure water purification system to 18.2 MΩ cm resistivity.All interfacial studies presented here are conducted on 10 wt% (∼4.5 vol%) SiO2 dispersions with 0.1 mM CnTAB added. Using the manufacturer reported particle radius of 11 nm and density of 2.2 g cm−3, this corresponds to a ratio of approximately 8 CnTAB molecules per SiO2 particle, which is 1–2 orders of magnitude lower than the ratios used in previous studies.15,17,31 The effect of varying the surfactant to nanoparticle ratio on the zeta potential of the CnTAB/SiO2 complexes is shown in Fig. 1(a). Measurements are performed on 1 wt% SiO2 dispersions with a Malvern Zetasizer ZSP using the Smoluchowski approximation. Bare Ludox TMA SiO2 nanoparticles in 10 mM NaCl have a zeta potential of −25 ± 1.8 mV. No increase in zeta potential is observed for concentrations below 0.6 mM CnTAB added to 1 wt% SiO2 (443 CnTAB molecules per particle). Above 0.6 mM CnTAB, the zeta potential of the complexes increases with added surfactant.
Images of the C16TAB/SiO2 dispersions measured in Fig. 1(a) are shown in Fig. 1(b). Despite a lack of measurable increase in zeta potential with the addition of 0.3 mM C16TAB, there is significant sedimentation observed in the bulk suspension. Dispersions with 0.1 mM C16TAB added show a slight increase in turbidity, indicating the formation of aggregates that remain suspended in solution. Dispersions with higher C16TAB concentrations exhibit even more sedimentation as the electrostatic stabilization between the nanoparticles is negated by cationic surfactant. Only the lowest concentration tested, 0.01 mM C16TAB with 1 wt% SiO2, does not result in visible sedimentation or flocculation. We therefore use an equivalent ratio in the interfacial studies presented here: 0.1 mM CnTAB with 10 wt% SiO2 in 10 mM NaCl solution. The total complex concentration is increased from 1 wt% to 10 wt% for the interfacial measurements to enhance the rate of adsorption at the air/water interface.
The CnTAB/SiO2 samples are prepared via dropwise addition of 0.2 mM CnTAB solution into a 20 wt% SiO2 dispersion using a method modified from Ravera et al.32 The dispersion is held in a sonication bath and gently mixed during CnTAB addition to aid in even surfactant distribution and avoid bulk aggregation. Once combined, the CnTAB/SiO2 dispersions are kept in the sonication bath for 30 minutes to reduce flocculation. Dispersions are aged for 24 hours before use to facilitate uniform surfactant distribution, and measurements are taken within 48 hours of sample preparation. Dynamic light scattering measurements taken on the samples diluted to 1 wt% immediately prior to measuring indicate no change in average particle size over the 48 hour measurement window. While the overall ratio of surfactant to silica particle is constant and efforts are made to generate a uniform distribution, this is an irreversible adsorption, so the potential for a distribution of surfactant molecules per particle centered around the average value and heterogeneous coverage of particles is considerable.
A microtensiometer is used to measure the surface tension and modulus of the air/water interfaces. The device has been described in detail previously.33–36 Briefly, it consists of a capillary filled with air, placed in a 3D printed thermoplastic cell and submerged in aqueous solution. A spherical cap bubble is formed at the capillary tip. The radius of the bubble is measured using an inverted light microscope, while the pressure jump across the curved interface is measured simultaneously by a pressure transducer in line with the capillary. The instantaneous surface tension, γ(t), is determined using the Laplace equation for a spherical cap, γ(t) = (P1(t) − P2)R(t)/2, where P1 is the pressure in the capillary, P2 is the hydrostatic pressure of the aqueous solution at the capillary, and R is the radius of the interface. P2 is held constant and is determined from the height of the aqueous solution in the reservoir. The uncertainty in the calculated surface tension is Δγ = ± 0.5 mN m−1 from the propagation of random errors in the pressure and radius measurements. Exchange of the bulk solution is achieved via two reservoir ports connected to a peristaltic pump, as described previously.37,38 The residence time of the reservoir is approximately 10 s.
The capillaries are purchased from World Precision Instruments, Inc. (Sarasota, FL) and are pulled to a tip radius of 35–38 μm using custom settings on a PMP-100 capillary puller (MicroData Instrument, Inc., South Plainfield, NJ). The interior of the capillaries is acid washed and coated with an arylalkoxysilane XIAMETER OFS-6124 hydrophobic coating from Dow Corning (Midland, MI) according to manufacturer instructions. The hydrophobic coating ensures that the air/water interface is pinned at the tip of the capillary for the duration of the experiment.
The interfacial mechanics are probed in two ways, through small amplitude oscillations to measure the dilatational modulus, and through large amplitude compressions to measure the Gibbs modulus. The dilatational modulus E is defined as  , where PS is the surface stress that includes the surface pressure as well as stresses that arise due to the deformation of the interface. A is the interfacial area of the spherical cap,
  , where Rc is the radius of the capillary. The magnitude of the dilatational modulus can be calculated directly from the measured pressure and radius39 as
  , where
  and
and  . Peq is the equilibrium pressure, Req is the equilibrium radius, Pa is the amplitude of the pressure oscillations, Ra is the amplitude of the radial oscillations, and ϕR1 is the phase angle of the radial oscillations. Small amplitude oscillations are ensured by verifying that the amplitude of any higher harmonics present in the data are less than 10% of the amplitude of the primary harmonic.
The Gibbs modulus is defined as  , and is measured by decreasing the pressure behind the interface with a syringe pump (BS-8000, Braintree Scientific, Inc.) at a constant rate of 15 Pa s−1. Due to the geometry of the spherical cap interface, the areal compression rate is not constant, but has an average value of 1000 μm2 min−1. The compression rate is five orders of magnitude slower than compressions performed on similar systems using a Langmuir trough.19 Before selecting the constant compression rate, control experiments were performed at rates of 5, 10, and 20 Pa s−1; we observe no effect of compression rate on the results presented here.
Results
Effect of surfactant
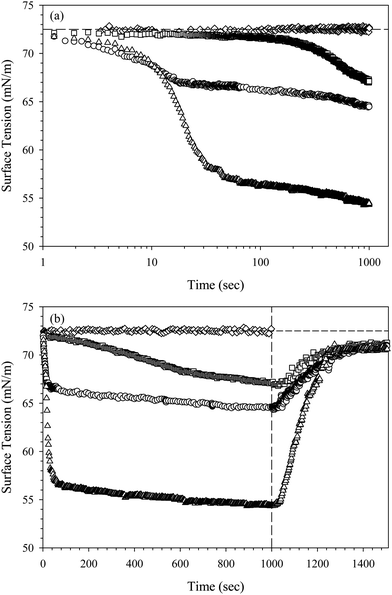
The adsorption of the CnTAB/SiO2 complexes is initially characterized by measuring the dynamic surface tension. Fig. 2 shows the surface tension as a function of time for three suspensions of 10 wt% SiO2 nanoparticles in 10 mM NaCl solution with 0.1 mM CnTAB added, where n = 14, 16, and 18. The surface tension begins at a clean air/water value of γ0 = 72.5 ± 0.5 mN m−1, indicated by the horizontal dashed line, and decreases with time as the surfactant–nanoparticle complexes adsorb to the interface. A dispersion of 10 wt% SiO2 nanoparticles in 10 mM NaCl does not decrease the surface tension, indicating that the nanoparticles without added surfactant are not surface active. The overall change in the magnitude of surface tension increases monotonically with the tail length of the surfactant: C14TAB/SiO2 complexes have the smallest effect on surface tension, while C18TAB/SiO2 complexes have the largest effect. All dispersions are generated at a ratio of approximately 8 CnTAB molecules per SiO2 particle, which corresponds to just over 1% of the maximum possible coverage of CnTAB on SiO2.32 At low coverages, the CnTA+ molecules bind strongly to the SiO2 surface.40 We assume total depletion of the CnTAB to the nanoparticle surface, as verified by Ravera et al.15 for C16TAB adsorption on similar SiO2 nanoparticles. The decrease in surface tension seen in Fig. 2 is therefore presumed to be a result of the combined nanoparticle–surfactant complex adsorption, not due to free surfactant adsorption from solution.The results shown in Fig. 2 suggest that the surface tension is dictated by the adsorbed surfactant. The average diffusion coefficient of the CnTAB/SiO2 complexes does not change with surfactant tail length. Measured using DLS, all three complexes exhibit an average diffusion coefficient of D = (1.5 ± 0.5) × 10−11 m2 s−1 in 10 mM NaCl, equivalent to the measured diffusion coefficient of bare SiO2 nanoparticles. The rate of transport to the surface should therefore be independent of surfactant tail length, and the surface tension decrease is attributed to differences in CnTAB/SiO2 complex behavior at the interface.
The effect of tail length on the surface pressure of the CnTAB/SiO2 complexes is consistent with the effect of tail length on pure CnTAB surfactant adsorption at air/water interfaces. The values of surface pressure Π = γ − γ0 after 1000 seconds of adsorption for pure CnTAB and for the CnTAB/SiO2 complexes are shown in Table 1. For all three surfactants, the value of the surface pressure due to complex adsorption is less than the value of the surface pressure of the pure surfactant at a concentration of 0.1 mM, indicating a weaker effect of the complexes. The lower surface pressure values are expected for the surfactant–nanoparticle complexes, as the added surfactant has completely depleted to the SiO2 surface. These results contradict those observed by Maestro et al.18 on the same SiO2 nanoparticle system, who identified a larger effect of the particle–surfactant complexes on the surface tension, but confirm several other studies that observed no such increased effect.15–17 Air/water interfaces are negatively charged at neutral pH;41,42 hydrophilic, negatively charged nanoparticles should not adsorb to the interface.43,44 We do not expect an additive effect on the surface tension, as the SiO2 nanoparticles themselves are not surface active and have no effect on the surface tension once adsorbed at the interface.
| Π 1000 (mN m−1) | Π ∞ (mN m−1) | |||
|---|---|---|---|---|
| 10 wt% SiO2 | without SiO2 | 10 wt% SiO2 | without SiO2 | |
| 0.1 mM C14TAB | 5.5 | 8.1 | 1.3 | 0.3 |
| 0.1 mM C16TAB | 7.9 | 21.3 | 1.6 | 1.3 |
| 0.1 mM C18TAB | 18.1 | 40.4 | 1.9 | 2.0 |
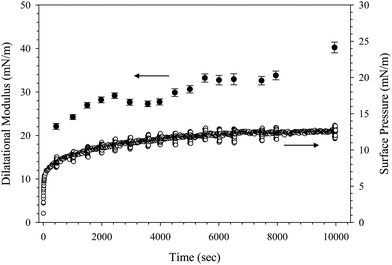
The dynamics of adsorption can be further characterized using interfacial rheology measurements. Fig. 3 shows the dilatational modulus and surface pressure as a function of time during the adsorption of 10 wt% SiO2 with 0.1 mM C16TAB in 10 mM NaCl. The interface is oscillated at a frequency of 1.9 rad s−1 at various time intervals to probe the dilatational modulus at different stages of adsorption.38 Each oscillation appears as a vertical “bar” in the surface pressure data in Fig. 3 since the timescale of the oscillation is short compared with the timescales of the interfacial relaxation. We report the magnitude of the complex modulus extracted from this measurement, |E*|, and refer to this as the dilatational modulus here. The modulus increases slowly with time, reaching a value of 40.2 ± 1.2 mN m−1 after 104 seconds. Similar values of the dilatational modulus are observed for complexes formed with C14TAB (46.4 ± 2.4 mN m−1) and C18TAB (39.4 ± 1.3 mN m−1) after 104 s of adsorption. The small amplitude oscillations during adsorption do not impact the surface pressure or dilatational modulus measurements. This is verified in a control experiment where the adsorption is repeated without periodic oscillations. Equivalent dilatational moduli are obtained within measurement uncertainty after 104 seconds of adsorption.
The values of the dilatational modulus obtained from CnTAB/SiO2 complex adsorption are low compared to many particle-covered interfaces. Previous studies have reported modulus values more than an order of magnitude larger for systems with higher concentrations of CnTAB than considered here.20,30,31 The adsorption of 0.1 mM C16TAB in 10 mM NaCl with no particles present yields a dilatational modulus value of 33.0 ± 1.8 mN m−1 at an oscillation frequency of 1.9 rad s−1, similar to the value obtained for the CnTAB/SiO2 complexes. The low modulus values again suggest that the dynamics of adsorption are dominated by the surfactant behavior and that the particles have little to no influence.
To differentiate between surfactant and nanoparticle behavior at the air/water interface, we assess the irreversibility of adsorption through a rinsing experiment. After allowing the complexes to adsorb for 1000 s, the bulk suspension is exchanged with deionized water, indicated in Fig. 2(b) by the vertical dashed line. The surface tension increases with time during the rinse for each CnTAB/SiO2 mixture, approaching the value of a clean air/water interface (72.5 ± 0.5 mN m−1). The surface tension does not fully reach the value for a clean air/water interface, maintaining a surface pressure of about 2 mN m−1 after 500 s of rinsing (approximately 50 residence times). The increase in surface tension indicates desorption of species from the interface. Assuming a contact angle of 90° and a radius of 11 nm, we estimate the adsorption energy of the nanoparticles as E ∼ 1800kT, suggesting that particle adsorption is irreversible. Therefore, the observed increase in surface tension is likely due solely to surfactant desorption, or the desorption of weakly bound surfactant–nanoparticle complexes, while strongly bound nanoparticles or complexes remain pinned at the interface. CnTAB desorbs from air/water interfaces in the presence of SiO2 as well as in pure surfactant systems. Table 1 shows the rinsed surface pressure values of the CnTAB/SiO2 complexes compared with equivalent concentrations of CnTAB surfactant alone after 1000 s of adsorption and 500 s of rinsing. The values of surface pressure obtained after rinsing are less than 2 mN m−1, both with and without SiO2 nanoparticles present, suggesting surfactant desorption. We note that while C14TAB exhibits completely reversible adsorption, interfaces exposed to 0.1 mM C16TAB and C18TAB maintain a small but measurable surface pressure after rinsing. This is comparable to the rinsed surface pressure of the C16TAB/SiO2 and C18TAB/SiO2 complexes, indicating partially incomplete surfactant desorption for the longer surfactant tail lengths.
From the dynamic surface tension and dilatational modulus measurements shown in Fig. 2 and 3, the CnTAB/SiO2 complexes appear to exhibit surfactant-like adsorption behavior, with no evidence of the expected enhanced interfacial mechanics due to the presence of adsorbed nanoparticles. However, the interfaces considered in this study have relatively short ages; similar systems with 1 wt% SiO2 nanoparticles do not reach maximum particle coverage until surface ages of 104 seconds or longer.30 We have used 10 wt% SiO2 suspensions to increase the rate of transport to the interface and increase nanoparticle adsorption, but 1000 s may still be insufficient to generate fully coated interfaces that exhibit the mechanical properties expected for particle–laden interfaces.
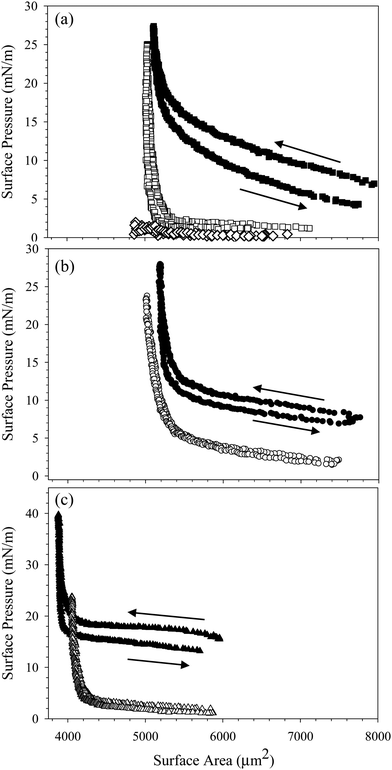
To increase the concentration of nanoparticles adsorbed at the interface, we compress the interface by slowly decreasing the pressure behind the bubble. Assuming the particles are irreversibly adsorbed, decreasing the surface area of the interface decreases the available area per particle. We measure the surface pressure during the compression to assess the effect of changing surface area on the interfacial mechanics. Fig. 4(a) shows the surface pressure as a function of surface area during the compression and expansion of an interface exposed to a dispersion of 10 wt% SiO2 in 10 mM NaCl with 0.1 mM C14TAB for 1000 seconds. Filled symbols indicate the presence of the bulk solution in the reservoir; empty symbols indicate the compression was performed after the bulk solution was exchanged with deionized water. In both cases, the interface starts at a large area and low surface pressure. The rinsed interface has a lower initial surface pressure due to the surfactant desorption observed in Fig. 2(b). As the interface is compressed, the surface area decreases and the surface pressure increases slightly, until a critical area is reached, below which the surface pressure increases rapidly. After the compression, the interface is expanded slowly to the initial area maintained during species adsorption, A0. The dramatic increase in surface pressure at the critical area of 5500 μm2 is evidence that particles are adsorbed at the air/water interface. The increase in surface pressure is observed for the compression of the interface with the bulk dispersion present in the reservoir as well as after bulk solution exchange, evidence that the nanoparticles persist at the interface despite rinsing. Purely surfactant-coated interfaces do not exhibit the substantial change in surface pressure over a relatively small change in area, nor do interfaces exposed to nanoparticles without added surfactant. The compression of an interface exposed to 10 wt% SiO2 nanoparticles in 10 mM NaCl with no CnTAB added is shown in Fig. 4(a), where the surface pressure remains below 2 mN m−1 throughout the compression.
The compression shown in Fig. 4(a) is performed on an interface exposed to 10% SiO2 with 0.1 mM C14TAB in 10 mM NaCl. Similar results are obtained for complexes formed with C16TAB and C18TAB, as shown in Fig. 4(b) and (c). There is a small (<5 mN m−1) hysteresis observed between the compression and expansion of the interface exposed to the bulk CnTAB/SiO2 complexes, but no hysteresis is observed for the rinsed interfaces, indicating that complexes do not desorb due to the compression, nor do they interact strongly as a function of surface concentration. The small hysteresis observed before rinsing is likely due to the presence of additional surfactant at the interface.
The area corresponding to the rapid increase in surface pressure is not constant across all experiments shown in Fig. 4 due to variations in capillary size and initial area. To quantify the effect of particle adsorption on the interfacial properties during the compression, the Gibbs modulus is calculated from the data in Fig. 4 and is plotted as a function of the fractional area change, ξ = (A0 − A)/A0, in Fig. 5. The fractional area change is defined to normalize by the different initial areas used across experiments due to variations in capillary size. For all interfaces, the value of the Gibbs modulus is <50 mN m−1 until a critical absolute area change of about 32% is reached, above which the modulus increases much more rapidly. The critical area change is consistent across all interfaces, despite differences in initial area, surfactant tail length, and rinsing conditions. The modulus reaches values approaching 1000 mN m−1, characteristic of particle adsorption at interfaces and consistent with measured values reported previously for similar systems.19,30
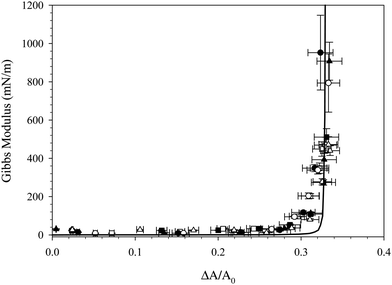 | ||
| Fig. 5 Gibbs modulus as a function of fractional area change resulting from the compression of interfaces exposed to CnTAB/SiO2 complexes for 1000 s where n = 14 (□), n = 16 (○), and n = 18 (△). Open symbols show compressions performed with nanoparticles present in the reservoir, empty symbols show compressions performed after bulk dispersion exchange with deionized water. Solid line is a best fit to eqn (1). | ||
The increase in modulus is attributed to the interparticle interactions on the surface. Once the nanoparticles reach a sufficiently high surface concentration, repulsive interactions between the particles prevent further compression. The critical area change required for the increase in Gibbs modulus is constant before and after bulk solution exchange, indicating that the nanoparticles remain irreversibly adsorbed despite rinsing. If the number of particles on the interface remains fixed, then the fractional decrease in area is equivalent to the ratio of surface concentrations,  , where ϕ is the fractional particle coverage on the surface. Here, ϕ = NAp/A, where N is the number of adsorbed nanoparticles and Ap is the cross-sectional area of a single nanoparticle. The collapse of the modulus data in Fig. 5 at a constant fractional area change suggests that the increase in modulus occurs at a critical particle coverage on the surface, ϕc. Above ϕc, repulsive interactions prevent further compression of the surface and result in large values of the Gibbs modulus. Since the initial area varies in different experiments, the collapse also suggests that the initial particle coverage is constant, set by the exposure time of the interface to the bulk dispersion. A simple model is chosen to relate the Gibbs modulus and imposed fractional area change, shown as a solid line in Fig. 5 and described further in the Discussion.
From the results shown in Fig. 4 and 5, it is clear that surface tension alone is an insufficient measure of the adsorption of surfactant–nanoparticle complexes. The values of the surface pressure in Table 1 for the CnTAB/SiO2 systems span nearly 20 mN m−1, yet the compressions for each surfactant system all yield an increase in Gibbs modulus at a similar fractional area change of about ξ = 32%. This result suggests that the particle coverage established at a fixed time point of 1000 s of adsorption is approximately constant, independent of surface tension and surfactant tail length. This result is somewhat surprising, given the substantial differences in the surface tension for the three surfactant systems. However, the systems measured here contain only a small amount of CnTAB per SiO2 particle. The average CnTAB coverage is less than 8 molecules per particle, whereas previous studies have used ratios 1–2 orders of magnitude larger to achieve adsorption of the complexes.15,17,31 At this low surfactant to nanoparticle ratio, the compression results suggest that the surfactant tail lengths do not change the effective adsorption of the nanoparticles at the air/water interface. The trend of decreasing interfacial tension with increase in tail length of surfactant, even though the composition of surfactant at the interface (same ratio of surfactant to nanoparticle), is consistent and allows the interfacial tension to be controlled separately from the dynamics. This supports the hypothesis that the surfactant alone is responsible for the changing surface tension, while the nanoparticles alone contribute to the diffusion timescale for adsorption to the interface and the mechanical properties of the interface. However, it is also possible that the nanoparticles remaining on the interface after rinsing could represent the more surface active (higher ratio of surfactant to particle) tail of a distribution of surfactant:particle ratio among the complexes.
The results presented above were collected on interfaces aged for 1000 s in the presence of the CnTAB/SiO2 dispersions, resulting in a constant particle fraction on the interface for all three systems. However, the systems are not at equilibrium after only 1000 s of adsorption. The surface tension continues to decrease slowly with time beyond 104 s, suggesting that additional adsorption or surface reorientation may be occurring. Long-time adsorption kinetics measured by ellipsometry by Yazhgur et al.30 indicate that steady state is not obtained for greater than 20 × 104 s for some C16TAB/SiO2 systems. Controlling the age of the interface prior to compression therefore offers an additional method to control surface coverage.
Fig. 6 shows the Gibbs modulus as a function of fractional area change, ξ, for the compression of six distinct interfaces, where each compression was performed at a different time during the adsorption of C16TAB/SiO2 complexes, from 250 s up through 104 s. The value of the critical fractional area change at which the Gibbs modulus increases rapidly is seen to decrease with interfacial age, consistent with the hypothesis that the degree of adsorption increases with interfacial age. Compressing after only 250 s results in no measurable increase in the Gibbs modulus, while compressing after 104 s results in a critical fractional area change of about 29%. The critical fractional area change is plotted in the inset as a function of adsorption time. The critical area increases roughly as a function of t−1/2, consistent with long-time diffusion-limited adsorption of other particle systems.45–48 Extrapolating the linear fit to find the intercept of t−1/2 provides an estimate of the minimum critical fractional area change in the long time limit of about ξ = 27.5%, suggesting that even after 104 seconds of adsorption equilibrium has not been reached. From Fig. 6 we obtain an estimate of the evolution of particle coverage with time that does not rely on dynamic surface tension measurements, but rather is obtained by probing the interfacial mechanics, a more reliable measure of particle adsorption behavior.
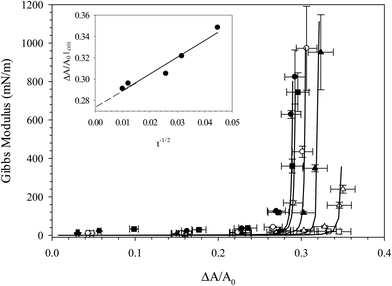 | ||
Fig. 6 Gibbs modulus as a function of fractional area change for compressions of interfaces exposed to 10 wt% SiO2 with 0.1 mM CnTAB in 10 mM NaCl for 250 s (□), 500 s (△), 1000 s (▲), 1500 s (○), 7000 s (■), and 10![[thin space (1/6-em)]](https://www.rsc.org/images/entities/char_2009.gif) 000 s (●). Solid lines are fits to eqn (1) and are added to guide the eye. Inset: Critical fractional area change as a function of adsorption time. 000 s (●). Solid lines are fits to eqn (1) and are added to guide the eye. Inset: Critical fractional area change as a function of adsorption time. | ||
The interfacial mechanics of surfaces coated with nanoparticle–surfactant complexes suggest that repulsive interactions between particles are responsible for the increase in Gibbs modulus at a critical particle areal coverage. Further, the adsorption of the particles appears to be irreversible due to the collapse of the curves in Fig. 5, where both surfaces with complexes in the bulk solution and those that have been rinsed with deionized water exhibit the same critical fractional area change. The nature of interparticle interactions can be further probed by performing multiple compressions on the same complex-coated interface. Fig. 7 shows the surface pressure as a function of surface area for multiple compression/expansion cycles of an interface exposed to 10 wt% SiO2 nanoparticles with 0.1 mM C16TAB in 10 mM NaCl for 1000 seconds, followed by bulk dispersion exchange with deionized water. Each consecutive compression/expansion cycle traces the same surface pressure–surface area curve, indicating that there is no particle desorption or change in interparticle interactions. This contributes further evidence that the particles adsorb irreversibly and interact as hard-spheres to modify the interfacial mechanics of the air/water interface.
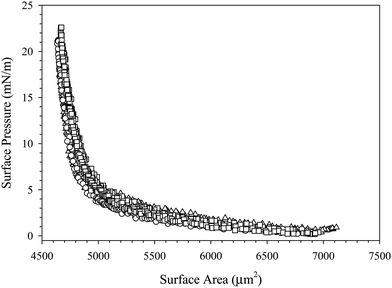 | ||
| Fig. 7 Surface pressure as a function of surface area for three compression–expansion cycles of a C16TAB/SiO2-coated interface after bulk dispersion exchange with deionized water. | ||
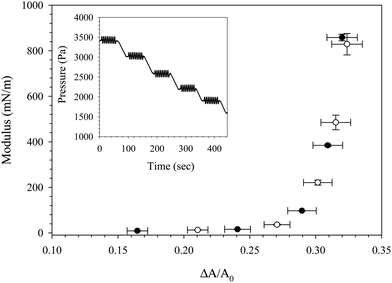
The Gibbs modulus probed via a slow, large-amplitude compression in Fig. 5 and 6 is a quasi-thermodynamic quantity, characterizing the sensitivity of the surface pressure to changes in surface concentration. Another measure of the interfacial mechanics can be made by measuring the total dilatational modulus, which can contain contributions from the Gibbs modulus as well as other intrinsic extra stresses. A comparison of the Gibbs modulus (obtained from a large amplitude, slow compression) and the dilatational modulus (obtained from small amplitude oscillations) is shown in Fig. 8 for an interface exposed to C16TAB/SiO2 complexes for 1000 seconds followed by bulk dispersion exchange with deionized water. At five different time points during the compression of the rinsed interface, the compression was paused (shown in the Fig. 8 inset) and the pressure was oscillated at a frequency of 1.9 rad s−1 and amplitude of 90 Pa to measure the dilatational modulus as a function of fractional area change. The Gibbs modulus and dilatational modulus trace the same curve, indicating that no extra stresses are present in the total dilatational modulus, and that the modulus is dominated by thermodynamic contributions. The values of both the Gibbs and dilatational modulus approach 1000 mN m−1 as expected for particle–laden interfaces, and both measurements exhibit a critical fractional area change of ξ = 32%. The values of the dilatational modulus obtained during compression are more than one order of magnitude larger than those obtained during free adsorption of the CnTAB/SiO2 complexes (as seen in Fig. 3), highlighting the effect of particle concentration on the interfacial mechanics.
Effect of ionic strength
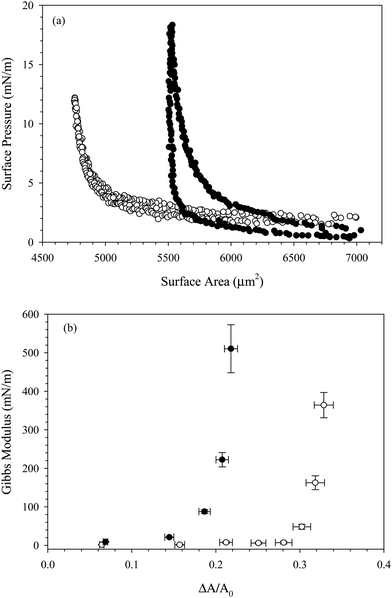
The data presented thus far was obtained for suspensions formulated in 10 mM NaCl solution. The ionic strength was chosen to enhance CnTAB adsorption on the SiO2 nanoparticles, as well as to increase adsorption at the air/water interface. Many previous studies of similar CnTAB/SiO2 systems are formulated in 1 mM NaCl solution,17–19 but we have found that this ionic strength is insufficient to achieve complex adsorption at reasonable timescales. Fig. S1 in the ESI,† shows the surface tension as a function of time for 10 wt% SiO2 with 0.1 mM C16TAB in either 1 mM NaCl or 10 mM NaCl. The suspension in 10 mM NaCl reaches a lower surface tension than the suspension in 1 mM NaCl, indicating more efficient C16TAB adsorption. Upon bulk suspension exchange with deionized water, both systems return to similar surface tensions near the clean air/water value. Fig. S2 (ESI†) shows the surface pressure as a function of surface area during the compression and expansion of the rinsed interfaces from Fig. S1 (ESI†). The C16TAB/SiO2 complexes do not adsorb at high enough concentrations in 1 mM NaCl to significantly increase the surface pressure upon compression. Increasing the bulk suspension ionic strength to 10 mM helps to screen the electrostatic repulsion between the nanoparticles, increasing adsorption at the air/water interface.To further increase adsorption of nanoparticle complexes to the air/water interface, the ionic strength of the bulk suspension could be increased above 10 mM. However, additional increases in ionic strength lead to bulk destabilization.25 The electrostatic repulsion between nanoparticles is reduced with added salt, causing the nanoparticles to flocculate and fall out of solution. To avoid destabilization while still probing the effect of ionic strength on the mechanics of particle-coated interfaces, a sequential rinsing procedure can be utilized. Sequential exchange of the reservoir enables control over bulk conditions without inducing undesired bulk flocculation; the technique has been used previously to characterize multi-species adsorption.37,38 In this case, C16TAB/SiO2 complexes formulated in 10 mM NaCl are allowed to adsorb at the air/water interface for 1000 s, then the bulk suspension is exchanged with deionized water, as seen in Fig. 2. The air/water interface is therefore coated with irreversibly-adsorbed SiO2 nanoparticles with no species present in the reservoir. A compression experiment is performed to quantify nanoparticle adsorption. The deionized water in the reservoir is then replaced with 100 mM NaCl, and the compression is repeated.
Fig. 9(a) shows the surface pressure as a function of surface area of a complex-coated interface with either deionized water or with 100 mM NaCl solution in the reservoir. While the interface exposed to deionized water exhibits no hysteresis between compression and expansion, the same interface compressed in 100 mM NaCl exhibits significant hysteresis, and the rapid increase in surface pressure shifts to a larger critical area change. Fig. 9(b) shows the Gibbs modulus as a function of fractional area change for the compression shown in Fig. 9(a). The compression of the interface when exposed to deionized water returns a critical fractional area change of about ξ = 32% as expected. Compression of the interface exposed to 100 mM NaCl exhibits a much lower critical fractional area change of only ξ = 21%. Since the compressions are performed on the same interface, the particle coverage is fixed, and the change in critical fractional area is attributed to a change in particle packing structure at the surface. To estimate the change in particle packing, we calculate the change in effective particle area due to the decrease in Debye length. At the initial adsorption conditions (10 mM NaCl), κ−1 = 3 nm. In 100 mM NaCl, the Debye length is reduced to a value of κ−1 = 1 nm. The effective area per particle on the interface is therefore reduced by 26%, from an estimated π(R + κ−1)2 = 615 nm2 to 453 nm2 for a particle where R = 11 nm and θ = 90°.
If particles were able to form a random close packed structure in 100 mM NaCl, the predicted fractional area change needed to increase the modulus would increase to over 50% due to the smaller effective particle area on the surface. Instead of requiring a larger change in area, however, the actual critical area change observed in 100 mM NaCl shifts to a lower value of 21%, which suggests that the particles are not forming a random close packed structure at high ionic strength.
The effect of ionic strength on particle structure has been studied optically for larger particles. At low ionic strengths, charged SiO2 particles form ordered arrays at the air/water interface; at higher ionic strengths, the particles aggregate on the interface, eventually forming percolated networks.49,50 We hypothesize that similar behavior is occurring with the SiO2 nanoparticles. Increasing the ionic strength screens the electrostatic repulsion between particles on the interface, inducing flocculation and the formation of a loosely packed network of aggregated particles. The formation of this network results in an increase in Gibbs modulus at lower fractional coverage than needed for non-interacting spheres, which can be compressed to a much larger areal particle fraction.
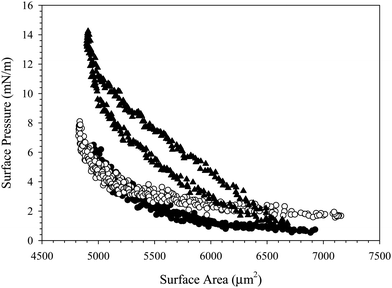
To identify the critical salt concentration needed for the formation of a percolated network, the experiment described in Fig. 9 is repeated for multiple lower salt concentrations. For each concentration, an interface is exposed to 10 wt% SiO2 nanoparticles with 0.1 mM C16TAB in 10 mM NaCl solution for 1000 s before the bulk dispersion is exchanged with deionized water. The reservoir is then filled with either 1 mM, 10 mM, or 30 mM NaCl and the interface is compressed. The surface pressure as a function of surface area for each concentration is shown in Fig. 10. The addition of 1 mM and 10 mM NaCl does not shift the critical surface area, but the addition of 30 mM NaCl changes the shape of the compression curve and exhibits slight hysteresis upon expansion. The ability of the 30 mM NaCl solution to alter the critical surface area during compression is highly sensitive to experimental conditions, including the length of time the interface is exposed to the salt solution, suggesting that the formation of the percolated network is stochastic and rate dependent.
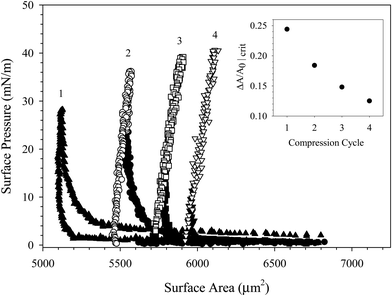
The different nature of interparticle interactions at high ionic strength is further illustrated through multiple compression cycles of the same interface. Fig. 11 shows the surface pressure as a function of surface area for four sequential compression/expansion cycles of a particle-coated interface in 100 mM NaCl. The critical fractional area required to increase the surface pressure shifts to smaller values with each subsequent compression cycle, shown in the inset of Fig. 11. By the fourth compression, the critical fractional change in surface area is reduced to 12.5%.
Further, during the second through fourth compressions the interface becomes fully incompressible: the surface area no longer responds to the imposed pressure decrease. Instead, attempts to further compress the interface result in a distortion of the spherical cap at the tip of the capillary, shown in Fig. S3 (ESI†). This corresponds to poor fit of the radius to a circle, which assumes a spherical cap geometry. As a result, the surface area is over predicted, altering the shape of the compression curves in Fig. 11. Once the interface rigidifies, the interface is no longer fluid and the Laplace equation can no longer be used to calculate a surface pressure. Data obtained after the distortion of the interface is plotted in Fig. 11 as empty symbols.
The data in Fig. 11 was collected on a single interface with a fixed number of adsorbed particles. Therefore, the shift in critical fractional area change is entirely due to the change in interparticle interactions in the presence of salt. We hypothesize that repeated compressions at high ionic strength induce increasing amounts of flocculation on the surface, forming larger space-filling aggregates with each compression. The flocculation events are irreversible; once formed, the particle aggregates remain associated. Attempting to compress the interface beyond the incompressible limit results in a distortion of the surface until the surface buckles and collapses.
Discussion
To interpret the response to large amplitude compression in Fig. 5, we choose a simple constitutive equation for the interface. A thermodynamic isotherm model is chosen because the response of the interface appears to be dominated by the Gibbs modulus and not extra stresses, as shown in Fig. 8. The modulus as a function of particle coverage can be modeled by the Volmer equation of state, which assumes non-interacting hard spheres on an interface,1 as | (1) |
Much of the interpretation of the adsorption and desorption in this work has assumed that there is the same ratio of surfactant molecules to nanoparticle that reflects the bulk ratio. Since the adsorption of CnTAB to silica is irreversible, it is likely that there is a distribution of number of surfactant molecules to particle within a sample and that on an individual particle, the surfactant is not uniformly distributed. This would result in a distribution of adsorption strength of complexes, from weakly adsorbed complexes with few surfactant molecules to strongly adsorbed complexes with either more surfactant or an island of surfactant on the surface. With this in mind, the timescales of adsorption would be driven by this distribution of complexes and the result of desorption would be to leave only the strongly adsorbed CnTAB/SiO2 complexes on the fluid–fluid interface. This model changes and perhaps simplifies the interpretation of the adsorption/desorption but does not alter the assessment of the mechanics. Again, direct measurements of the interfacial composition would address this, but would require different techniques following a similar processing procedure.
Conclusions
We have used surface tension and interfacial rheology measurements to characterize the adsorption of CnTAB/SiO2 complexes at air/water interfaces. The nanoparticles alone are not surface active, but the addition of 0.1 mM CnTAB is sufficient to induce surface adsorption. The surface tension of the complexes depends on surfactant tail length, with the most hydrophobic surfactant resulting in the largest reduction in surface tension. However, the particle coverage remains constant for all surfactants, independent of surface tension. We conclude that surface tension is an insufficient measure of surface coverage of the CnTAB/SiO2 complexes; interfacial mechanics are necessary to quantify particle adsorption. When the bulk suspension is exchanged with deionized water, the surface tension approaches the value for a clean air/water interface, indicating significant surfactant desorption upon rinsing. The interfacial mechanics remain unchanged before and after rinsing, confirming the irreversible adsorption of some of the nanoparticles.The interfacial mechanics are determined by interparticle interactions, and can be tuned by manipulating the ionic strength of the bulk solution. A nanoparticle-coated interface exposed to deionized water can be compressed and expanded repeatedly with no hysteresis in the interfacial mechanics, with the nanoparticles acting as non-interacting hard spheres. The same interface exposed to 100 mM NaCl, however, exhibits significant hysteresis upon multiple compressions. At high ionic strength, the electrostatic repulsion between the particles is screened by counter ions, allowing the nanoparticles to flocculate on the surface and alter the interfacial mechanics. Repeated compressions of the interface at high ionic strength ultimately result in the formation of a rigid, incompressible interface at relatively low fractional particle coverages.
This study highlights the importance of processing history on creating interfaces with desired interfacial mechanics. Surfaces with identical particle coverages exhibit substantially different mechanical properties when exposed to environments of different ionic strengths and deformation histories. These results contribute to the understanding of particle behavior at air/water interfaces for the informed formulation of particle stabilized foams.
Conflicts of interest
There are no conflicts to declare.Acknowledgements
Funding for this work was provided by the National Science Foundation (CBET 1437864). We appreciate the bulk stability measurements performed by Andres Ramirez through funding from the Berg undergraduate research program. We would also like to thank the reviewers for insightful comments on potential mechanisms.References
- B. P. Binks, Curr. Opin. Colloid Interface Sci., 2002, 7, 21–41 CrossRef CAS.
- T. N. Hunter, R. J. Pugh, G. V. Franks and G. J. Jameson, Adv. Colloid Interface Sci., 2008, 137, 57–81 CrossRef CAS PubMed.
- B. P. Binks and T. S. Horozov, Angew. Chem., Int. Ed., 2005, 44, 3722–3725 CrossRef CAS PubMed.
- D. E. Tambe and M. M. Sharma, J. Chem. Inf. Model., 1993, 157, 244–253 Search PubMed.
- A. Stocco, W. Drenckhan, E. Rio, D. Langevin and B. P. Binks, Soft Matter, 2009, 5, 2215–2222 RSC.
- T. S. Horozov, Curr. Opin. Colloid Interface Sci., 2008, 13, 134–140 CrossRef CAS.
- S. Levine, B. D. Bowen and S. J. Partridge, Colloids Surf., 1989, 38, 325–343 CrossRef CAS.
- B. P. Binks, M. Kirkland and J. A. Rodrigues, Soft Matter, 2008, 4, 2373 RSC.
- V. Garbin, I. Jenkins, T. Sinno, J. C. Crocker and K. J. Stebe, Phys. Rev. Lett., 2015, 114, 1–5 CrossRef PubMed.
- Y. L. Lee, Z. C. Du, W. X. Lin and Y. M. Yang, J. Colloid Interface Sci., 2006, 296, 233–241 CrossRef CAS PubMed.
- R. Pichot, F. Spyropoulos and I. T. Norton, J. Colloid Interface Sci., 2012, 377, 396–405 CrossRef CAS PubMed.
- L. R. Arriaga, W. Drenckhan, A. Salonen, J. A. Rodrigues, R. Íñiguez-Palomares, E. Rio and D. Langevin, Soft Matter, 2012, 8, 11085 RSC.
- H. Vatanparast, A. Samiee, A. Bahramian and A. Javadi, Colloids Surf., A, 2017, 513, 430–441 CrossRef CAS.
- J. Reguera, E. Ponomarev, T. Geue, F. Stellacci, F. Bresme and M. Moglianetti, Nanoscale, 2015, 7, 5665–5673 RSC.
- F. Ravera, E. Santini, G. Loglio, M. Ferrari and L. Liggieri, J. Phys. Chem. B, 2006, 110, 19543–19551 CrossRef CAS PubMed.
- B. P. Binks, J. A. Rodrigues and W. J. Frith, Langmuir, 2007, 23, 3626–3636 CrossRef CAS PubMed.
- A. Maestro, E. Guzmán, E. Santini, F. Ravera, L. Liggieri, F. Ortega and R. G. Rubio, Soft Matter, 2012, 8, 837–843 RSC.
- A. Maestro, E. Rio, W. Drenckhan, D. Langevin and A. Salonen, Soft Matter, 2014, 10, 6975–6983 RSC.
- A. Maestro, O. S. Deshmukh, F. Mugele and D. Langevin, Langmuir, 2015, 31, 6289–6297 CrossRef CAS PubMed.
- E. Santini, J. Krägel, F. Ravera, L. Liggieri and R. Miller, Colloids Surf., A, 2011, 382, 186–191 CrossRef CAS.
- M. Safouane, D. Langevin and B. P. Binks, Langmuir, 2007, 23, 11546–11553 CrossRef CAS PubMed.
- T. N. Hunter, G. J. Jameson and E. J. Wanless, Aust. J. Chem., 2007, 60, 651–655 CrossRef CAS.
- A. Maestro, E. Guzmán, F. Ortega and R. G. Rubio, Curr. Opin. Colloid Interface Sci., 2014, 19, 355–367 CrossRef CAS.
- W. Russel, D. Saville and W. Schowalter, Colloidal Dispersions, Cambridge University Press, Cambridge, 1989 Search PubMed.
- C. O. Metin, L. W. Lake, C. R. Miranda and Q. P. Nguyen, J. Nanopart. Res., 2011, 13, 839–850 CrossRef CAS.
- Q. Lan, F. Yang, S. Zhang, S. Liu, J. Xu and D. Sun, Colloids Surf., A, 2007, 302, 126–135 CrossRef CAS.
- H. Ma, M. Luo and L. L. Dai, Phys. Chem. Chem. Phys., 2008, 10, 2207 RSC.
- B. P. Binks and J. A. Rodrigues, Langmuir, 2007, 23, 7436–7439 CrossRef CAS PubMed.
- P. Somasundaran, E. D. Snell and Q. Xu, J. Colloid Interface Sci., 1991, 144, 165–173 CrossRef CAS.
- P. Yazhgur, B. Noskov, L. Liggieri, S.-Y. Lin, G. Loglio, R. Miller and F. Ravera, Soft Matter, 2013, 9, 3305 RSC.
- L. Liggieri, E. Santini, E. Guzmán, A. Maestro and F. Ravera, Soft Matter, 2011, 7, 7699 RSC.
- F. Ravera, M. Ferrari, L. Liggieri, G. Loglio, E. Santini and A. Zanobini, Colloids Surf., A, 2008, 323, 99–108 CrossRef CAS.
- N. J. Alvarez, L. M. Walker and S. L. Anna, Langmuir, 2010, 26, 13310–13319 CrossRef CAS PubMed.
- N. J. Alvarez, L. M. Walker and S. L. Anna, Phys. Rev. E, 2010, 82, 11604 CrossRef PubMed.
- M. D. Reichert and L. M. Walker, Langmuir, 2013, 29, 1857–1867 CrossRef CAS PubMed.
- N. J. Alvarez, D. R. Vogus, L. M. Walker and S. L. Anna, J. Colloid Interface Sci., 2012, 372, 183–191 CrossRef CAS PubMed.
- S. M. Kirby, S. L. Anna and L. M. Walker, Langmuir, 2015, 31, 4063–4071 CrossRef CAS PubMed.
- S. M. Kirby, X. Zhang, P. S. Russo, S. L. Anna and L. M. Walker, Langmuir, 2016, 32, 5542–5551 CrossRef CAS PubMed.
- A. P. Kotula and S. L. Anna, J. Rheol., 2015, 59, 85–117 CrossRef CAS.
- W. Wang, B. Gu, L. Liang and W. A. Hamilton, J. Phys. Chem. B, 2004, 108, 17477–17483 CrossRef CAS.
- A. Graciaa, G. Morel, P. Saulner, J. Lachaise and R. S. Schechter, J. Colloid Interface Sci., 1995, 172, 131–136 CrossRef CAS.
- P. Creux, J. Lachaise, A. Graciaa, J. K. Beattie and A. M. Djerdjev, J. Phys. Chem. B, 2009, 113, 14146–14150 CrossRef CAS PubMed.
- K. Larson-Smith, A. Jackson and D. C. Pozzo, Langmuir, 2012, 28, 2493–2501 CrossRef CAS PubMed.
- Y. Zhang, S. Wang, J. Zhou, R. Zhao, G. Benz, S. Tcheimou, J. C. Meredith and S. H. Behrens, Langmuir, 2017, 33, 4511–4519 CrossRef CAS PubMed.
- V. Pauchard, J. P. Rane, S. Zarkar, A. Couzis and S. Banerjee, Langmuir, 2014, 30, 8381–8390 CrossRef CAS PubMed.
- N. Bizmark, M. A. Ioannidis and D. E. Henneke, Langmuir, 2014, 30, 710–717 CrossRef CAS PubMed.
- K. Schwenke and E. Del Gado, Faraday Discuss., 2015, 181, 261 RSC.
- K. Schwenke, L. Isa and E. Del Gado, Langmuir, 2014, 30, 3069–3074 CrossRef CAS PubMed.
- R. Aveyard, J. H. Clint, D. Nees and V. N. Paunov, Langmuir, 2000, 16, 1969–1979 CrossRef CAS.
- D. F. Williams and J. C. Berg, J. Colloid Interface Sci., 1992, 152, 218–229 CrossRef CAS.
- B. J. Park, J. Pantina, E. M. Furst, M. Oettel and S. Reynaert, Langmuir, 2008, 24, 1686–1694 CrossRef CAS PubMed.
Footnote |
| † Electronic supplementary information (ESI) available: Fig. S1 in the supplementary information shows the surface tension as a function of time for 10 wt% SiO2 with 0.1 mM C16TAB in either 1 mM NaCl or 10 mM NaCl. Fig. S2 shows the surface pressure as a function of surface area during the compression and expansion of the rinsed interfaces from Fig. S1. Images of the interface before and after rigidification with comparison to a hemispherical cap are shown in Fig. S3. See DOI: 10.1039/c7sm01806a |
| This journal is © The Royal Society of Chemistry 2018 |

