DOI:
10.1039/C7SM01681F
(Paper)
Soft Matter, 2018,
14, 83-91
Colloidal transport within nematic liquid crystals with arrays of obstacles†
Received
21st August 2017
, Accepted 24th October 2017
First published on 24th October 2017
Abstract
We have investigated the gravity-driven transport of spherical colloids suspended in the nematic liquid crystal 4-cyano-4′-pentylbiphenyl (5CB) within microfluidic arrays of cylindrical obstacles arranged in a square lattice. Homeotropic anchoring at the surfaces of the obstacles created periodic director-field patterns that strongly influenced the motion of the colloids, whose surfaces had planar anchoring. When the gravitational force was oriented parallel to a principal axis of the lattice, the particles moved along channels between columns of obstacles and displayed pronounced modulations in their velocity. Quantitative analysis indicates that this modulation resulted from a combination of a spatially varying effective drag viscosity and elastic interactions engendered by the periodic director field. The interactions differed qualitatively from a sum of pair-wise interactions between the colloids and isolated obstacles, reflecting the distinct nematic environment created by confinement within the array. As the angle α between the gravitational force and principal axis of the lattice was varied, the velocity did not follow the force but instead locked into a discrete set of directions commensurate with the lattice. The transitions between these directions occurred at values of α that were different from those observed when the spheres were in an isotropic liquid, indicating the ability of the liquid crystal forces to tune the lateral displacement behavior in such devices.
1. Introduction
When colloidal particles are suspended in a liquid crystal, the anisotropic viscous and elastic properties of the liquid crystal introduce a host of novel phenomena. For example, in a nematic liquid crystal, the boundary conditions created by the anchoring of the nematic director at the particle surface introduce distortions and defects in the surrounding director field, with corresponding costs in the free energy of the liquid crystal.1–7 The minimization of these energy costs can, in turn, engender forces on the particles that lead to remarkable and unexpected results, such as the levitation of particles in opposition to gravity4,8–10 and the formation of stable colloidal crystals.11–16 In addition, the anisotropy of the nematic, and the effects of flow on the orientational order, can make the mobility of inclusions both velocity and direction dependent, and can cause striking dynamical phenomena not seen in isotropic fluids.9,10,17–32 Such observations have made inclusions in liquid crystals valuable for exploring fundamental issues of liquid-crystal viscoelasticity and interfacial phenomena, particularly as they relate to topological aspects of the liquid-crystal order. They have also motivated interest in employing the interactions within liquid crystals as a mechanism for colloidal manipulation and self-assembly that is intrinsically anisotropic.23,29,30,33–40
Recently, research has expanded on this theme of colloidal manipulation and assembly through liquid crystal elastic forces to investigate the behavior of colloids within patterned director fields.35,41–44 In addition, spatially modulated colloidal transport has been demonstrated previously in liquid crystals with intrinsically periodic structures, such as cholesterics.45,46 Here, we bridge these ideas by addressing the possibility of engineering colloidal transport behavior through patterned anchoring by exploiting the periodic director-field configurations that form within arrays of obstacles in microfluidic devices. The obstacles, cylindrical posts arranged in a square lattice, have surfaces that promote homeotropic anchoring of the nematic director, thereby creating periodic director-field patterns in the surrounding nematic that strongly influence the mobility of colloids through the fluid. These studies build on research on colloidal transport in simple liquids in such microfluidic devices containing arrays of obstacles that drive the particles on size-dependent paths.47–56 We find similarities between the behavior of the colloids in the nematic and that in the isotropic liquids but also some notable differences. The velocity of the colloids through the nematic displays a pronounced modulation that we identify as the consequence of the combined effects of spatially varying viscous drag and elastic forces. We also observe how the interactions experienced by the colloids in the nematic can alter their path as they move past an isolated obstacle, resulting in irreversible trajectories. Most significantly, and in contrast to the behavior observed in simple liquids, the trajectories exhibited by the colloidal particles inside the array cannot be described as the result of pair-wise additive particle–obstacle interactions. This qualitative difference indicates a new mechanism in such devices for separation technologies.
2. Experimental procedures
2.1 Device fabrication
Colloidal motion through the microfluidic post arrays was characterized by classic “falling ball” experiments in which particles whose density was larger than that of the surrounding fluid were driven through the array by gravity, as illustrated in Fig. 1(a). The arrays were fabricated from polydimethylsiloxane (PDMS) using standard lithographic techniques. Briefly, a square lattice of circular holes was created in a film of photoresist (SU8 2050, Microchem Corp., MA) that had been spin-coated on a silicon wafer. This array was then employed as a mold for making the arrays of circular posts on a PDMS film. A top view of an array is shown in Fig. 1(b). The height of the posts, determined by the thickness of the photoresist, was approximately 40 μm, as illustrated in Fig. 1(c), which displays an image of a region of an array obtained from confocal microscopy. The radius of the posts was 17.5 μm, and the lattice spacing was H = 60 μm. Additional arrays of posts with the same height and with radius 15 μm and a lattice spacing of several hundred micrometers were also fabricated using the same method in order to study the trajectories of colloids in the vicinity of isolated cylindrical obstacles. The arrays were surrounded on the films by walls of PDMS that had the same height as the posts and provided an enclosed environment when a top surface was added.
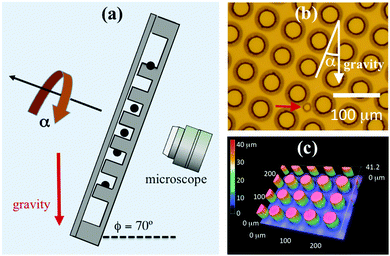 |
| | Fig. 1 Experimental arrangement and microfluidic devices. (a) Schematic of the experiment. The microfluidic device was placed on the rotation stage of an inverted optical microscope that was tilted at ϕ = 70° with respect to the horizontal. (b) Micrograph of a micropost array filled with nematic 5CB containing silica microspheres. The arrow points to a sphere. (c) Image of an array of cylindrical posts obtained with confocal microscopy. | |
Since bare PDMS imposes weak planar anchoring of the nematic director, the PDMS containing the post arrays was functionalized with N,N-dimethyl-N-octadecyl-3-aminopropyltrimethoxysilyl chloride (DMOAP) to achieve strong homeotropic anchoring on the post and substrate surfaces. The PDMS with the post arrays was then bonded to a sheet of flat PDMS by oxygen plasma treatment to create an enclosed environment. During the plasma activation, the region of the PDMS containing the post array was shielded to preserve the DMOAP functionalization on the posts and bottom substrate such that only the tops of the walls surrounding the array were activated. The flat sheet of PDMS forming the top of the device was left unfunctionalized and hence imposed weak, degenerate planar anchoring. Two small holes punched into the top sheet prior to the bonding served as channels for introducing the 5CB, which is nematic at room temperature. Untreated silica spheres with density ρs = 2 g cm−3 and radii between approximately 6 and 9 μm were premixed with 5CB at low concentration, and the mixture was then introduced through the channels while the device and 5CB were heated to 40 °C, which is above the isotropic-nematic transition temperature of 5CB (TNI ≈ 34 °C). After filling, the device was allowed to cool slowly to room temperature to so that the director field was unaffected by the flow during the filling.
2.2 Director field characterization
The anchoring conditions on the PDMS surfaces created a periodic director-field configuration within the array that we characterized using polarization microscopy images like those shown in Fig. 2(a) and (b). Schematic representations of the director field inferred from the images and based on the boundary conditions are shown in Fig. 2(c) and (d). Fig. 2(c) depicts the director field in a vertical plane between two nearest neighbor posts, and Fig. 2(d) displays the director field near the top substrate with degenerate planar anchoring. As discussed by Cavallaro et al.,41 an important factor dictating the director field in geometries like that in the microfluidic devices is the field's configuration near the corners where the cylinders and bottom substrate meet. Specifically, on going around a corner between a right cylinder with homeotropic anchoring and a flat substrate also with homeotropic anchoring, the director assumes a winding number of either −1/4 or +1/4. In geometries with an array of cylinders and a second flat substrate that imposes degenerate planar anchoring, like in the microfluidic devices, configurations in which the winding numbers at the corners of nearest neighbor posts have the same sign necessitate the formation of disclination lines in the director field, with corresponding elastic energy cost to the nematic. In contrast, the configuration in Fig. 2(c), in which nearest neighbor posts have opposite winding number, avoids the formation of disclinations, consistent with our observations. We note that the nearest neighbor posts assuming winding numbers of opposite sign in this way imparts an interesting broken symmetry to the director field. While this symmetry breaking does not have significant consequences for the colloidal mobility we report in this study, where the spherical colloids have planar anchoring, we believe it might under different circumstances that will be the focus of future studies.
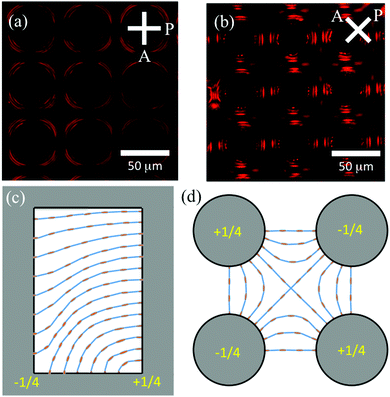 |
| | Fig. 2 Director field of nematic 5CB within microfluidic array. (a and b) Polarization microscopy images of a device. (c) Schematic representation of the director field between nearest neighbor posts. (d) Schematic representation of the director field near the top substrate. The winding number of the director at the base of the posts alternates between +1/4 and −1/4 in a checkerboard pattern. | |
2.3 Measurement of colloidal transport
To conduct the transport measurements, we mounted the microfluidic devices on a rotatable stage of an inverted optical microscope (Nikon Eclipse TS100). The microscope was tilted so that the focal plane was at an angle ϕ = 70° with respect to gravity, as depicted in Fig. 1(a). By rotating the stage through an angle α, the direction of the component of gravity in the focal plane could be varied with respect to the principal axes of the post array. Images of colloids moving through the arrays, such as in Fig. 1(b), were collected at a rate of 24 frames per second. Analysis of the images to obtain trajectories of the colloids was performed using a custom Python-based implementation57 of widely used particle-tracking algorithms58 that identify circular objects in the video images and connect their positions frame-to-frame.
3. Results
3.1 Trajectory of colloid near isolated cylindrical obstacle
To understand better the trajectories experienced by colloids in the micropost arrays, we first consider the trajectory of a colloid near an isolated cylindrical post. Fig. 3 displays a micrograph of a silica sphere with 8.5 μm radius and planar surface anchoring translating under the force of gravity in the vicinity of a post with radius of 15 μm and homeotropic surface anchoring. The solid blue line in Fig. 3 depicts the path of the sphere center. The deviation of the sphere's trajectory from a straight line near the obstacle is qualitatively similar to that experienced in a simple fluid due to hydrodynamic interactions.59 Closer comparison, however, indicates contributions to the forces on the sphere that cannot be attributed to hydrodynamic effects seen in an isotropic fluid and instead reflect interactions mediated by the nematic order. First, since low-Reynolds-number Stokes flow is time reversal invariant, the trajectory as the colloid moves past the obstacle would have fore-aft symmetry in the absence of non-hydrodynamic interactions. In contrast, the trajectory shown in Fig. 3 breaks this symmetry. (See Fig. S1 in the ESI,† for additional examples of colloid trajectories past isolated posts that display this broken symmetry.) Although irreversible trajectories can also be observed in simple fluids, they are typically associated with short-range non-hydrodynamic forces, such as solid-contact forces due to surface roughness. In contrast, the trajectory shown in Fig. 3 indicates that the sphere experiences a relatively long-range repulsive force on passing the isolated post, as the minimum separation between the colloid and post is dmin ≈ 6 μm. This repulsion is consistent with elastic forces expected for a sphere with planar anchoring and a post with incompatible, homeotropic anchoring. As the results in the next section illustrate, the situation becomes subtler under the confined conditions of the micropost array. (We note that in addition to an elastic interaction, the nematic could induce a lateral force on the sphere through backflow. Specifically, the proximity of the post breaks the left-right symmetry of the director about the sphere, and hence also that of backflow associated with director reorientation as the sphere translates through the nematic. The possible significance of backflow on the colloid mobility in the microfluidic array is discussed below.)
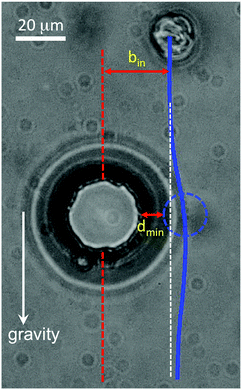 |
| | Fig. 3 Micrograph of a sphere with radius 8.5 μm and planer surface anchoring translating in 5CB under the force of gravity past a cylindrical post with homeotropic anchoring. The path of the sphere's center, shown by the solid blue line, lacks symmetry about the mid-height of the post, indicating the presence of a non-hydrodynamic repulsive interaction mediated by the nematic. | |
3.2 Colloidal mobility in micropost array at α = 0
3.2.1 Periodic velocity modulation.
In examining the mobility of colloids in the micropost arrays, we first consider the case when the arrays were oriented so that the gravitational force and principal axis of the lattice were parallel (α = 0). In this case, we observed that the colloids traversed the lattice unobstructed by the posts by translating along the midline between two columns of posts. This motion, which is depicted in the micrographs in Fig. 4(a)–(d) showing a sphere with radius 6.1 μm descending through an array, led to essentially straight-line trajectories. (In addition to following a straight-line path in the focal plane, the colloids displayed no measurable variation in their distance from the device substrate as they descended; see Supplementary Video SV1 (ESI†).) However, interactions between the spheres and posts mediated by the liquid crystal, as well as a spatially varying viscous drag, led to a pronounced modulation in the speed of the colloids as they followed these paths. For example, Fig. 5(a) displays the velocity v of the colloid shown in Fig. 4(a)–(d) as a function of its height y as it traversed three periods of the array. Fig. 5(b) shows the velocity through a single period of the lattice on an expanded scale. The colloid's vertical position h within the unit cell of the lattice in Fig. 5(b) is measured with respect to that of the post centers, as indicated by the dashed line in Fig. 4(d), and increasing h is taken to be downward. As the colloid approached the midpoint between adjacent posts (h = 0), the speed increased, and reached a maximum at a value of h slightly less than 0. After the colloid passed between the posts, the velocity decreased until it reached a minimum slightly before the sphere reached the midway point between two rows of posts (h = H/2 = 30 μm). Additional examples of the velocity vs. height for other particles displaying the same trend are shown in Fig. S2 of the ESI.†
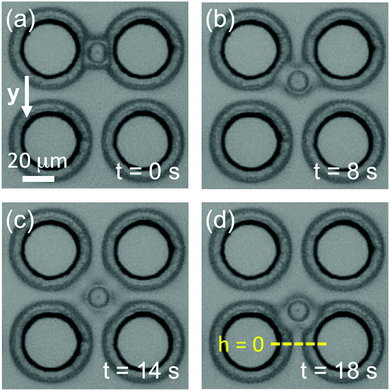 |
| | Fig. 4 Series of micrographs depicting a sphere translating within an array of obstacles at α = 0. The time lapse from image in (a) is indicated in each panel. The dashed line in (d) indicates the vertical position taken as h = 0, with h increasing in the downward direction. | |
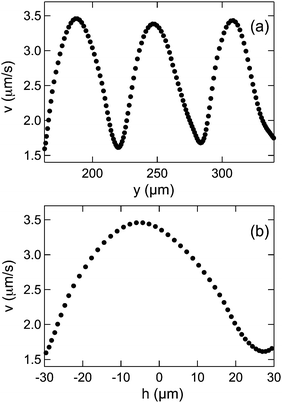 |
| | Fig. 5 (a) Velocity of the colloidal sphere shown in Fig. 4 as a function of its height y in the obstacle array. Increasing y is taken to be downward, and the origin of y is set as the particle position when we started to record the motion. Included in the plot is the velocity over three periods of the array after the motion was stable. (b) Velocity of the sphere within one period of the array as a function of its vertical position h within the unit cell. Again, increasing h is taken to be downward, and the origin of h is taken to be the position of the post centers. | |
As the results in Fig. S2 (ESI†) indicate, the large modulation in speed seen in Fig. 5, where v oscillates by more than a factor of two, was typical of colloids in 5CB traversing the arrays with α = 0. To test that the modulation was the result of the nematic order of the solvent, we performed the same measurements on colloids in water and in glycerol. In the isotropic liquids, the colloids’ speed also oscillated as they traversed the array, but the magnitude in the variation was typically no more than 10% the mean speed, and the minimum speed coincided with the colloids’ passing through h = 0, consistent with a slightly enhanced hydrodynamic drag when the colloids were closest to the posts. (See Fig. S3 of the ESI,† for example results for the velocity of a sphere in water as a function of height in an array.) In contrast, as shown in Fig. 5, the speed of the colloids traversing the array within 5CB surprisingly reached a maximum near h = 0.
3.2.2 Extraction of spatially-varying elastic and viscous forces.
Analysis of the height-dependent velocity of the colloids, like in Fig. 5, allows us to disentangle the forces acting on the colloids as they descend through the microfluidic array under the force of gravity Fg. Specifically, we identify two contributions from the liquid crystal that cause the velocity modulation, (i) the viscous drag force Fdrag, which varies spatially due to the patterned director field, and (ii) an elastic force Fel associated with the position-dependent energy cost Eel of the distortion the colloids impose on the director field. (As discussed above for the colloid passing the isolated post, backflow induced by the reorientation of the director as the colloid descends the lattice could also contribute a spatial varying force due to the patterned director field. Such contributions would have the same symmetry with respect to the lattice as the elastic force, as described below, and hence should be considered incorporated into Fel.) Because the motion is at low Reynolds numbers (Re ∼ 10−6), these three forces sum to zero,Taking account of the buoyancy force and the tilt angle, ϕ = 70°, of the microscope,| |  | (2) |
where R is the sphere radius, ρs is the density of silica, ρlc is the density of 5CB, and g is the acceleration of gravity.
The viscous drag on a sphere in a nematic is significantly subtler than in an isotropic liquid. For instance, the flow created by a colloid with sufficient velocity can alter the director field, leading to nonlinear effects. The importance of these effects is parameterized by the Ericksen number Er, which is the ratio of the viscous to elastic forces. For a translating sphere of radius R, the Ericksen number can be taken as Er = ηRv/K, where η ≈ 35 mPa s is an average viscosity60 and K ≈ 4 pN is the average Frank elastic constant of 5CB.61 For the velocities in Fig. 5, we find Er < 0.25, which is within the range in which the flow is expected to have little if any effect on the director field.62,63 However, even at low Ericksen number the anisotropic nature of the nematic complicates its viscous properties,64,65 and complete description of the drag requires a tensorial form of Stokes equation.65 Further, motion of defects in the liquid crystal induced by the colloidal motion can contribute to the drag.46 Because we observe that the colloids at α = 0 follow a straight path along a line of symmetry bisecting columns of posts, we employ a simplified Stokes law with a height-dependent effective drag viscosity ηeff to account for the effects of the patterned director field on the drag. We further assume that both ηeff and the elastic interactions have the periodicity of the lattice. The same is thus the case also for the elastic force, Fel = −dEel/dh, and eqn (1) can hence be written as
| | | Fg − 6πRηeff(h)ν(h) + Fel(h) = 0, | (3) |
where each term is expressed as a scalar. Given the mirror symmetry of the lattice about
h = 0, we conclude that
ηeff(h) and
Eel(
h) are even functions of
h, and therefore
Fel(
h) is an odd function of
h. Hence, evaluating
eqn (3) when the colloid is at position –
h, we have
| | | Fg − 6πRηeff(h)ν(−h) − Fel(h) = 0, | (4) |
and subtracting
eqn (4) from
eqn (3), we get:
| | | 2Fel(h) = 6πRηeff(h)Δν(h), | (5) |
where Δ
ν(
h) =
ν(
h) −
ν(−
h).
Results for Δν(h) obtained from the data in Fig. 5(b) are shown in Fig. 6(a). With these results and eqn (5), we can obtain the spatially varying drag viscosity and elastic force experienced by the colloids as they traversed the array. Specifically, solving eqn (5) for ηeff(h) and inserting it back into eqn (3), we get a relationship for the elastic force:
| |  | (6) |
Results for
Fel(
h), again obtained from the velocity data in
Fig. 5(b), are shown in
Fig. 6(b). As expected from symmetry,
Fel = 0 when
h = 0 and
h = ±
H/2. At any point in the particle's trajectory, the force is directed toward the midpoint between posts (
h = 0), so that at
h < 0 the force is downward (positive), and at
h > 0 it is upward (negative). Over a broad range of positions centered at
h = 0, the force is linear in the displacement from
h = 0, indicating an effective Hookean interaction.
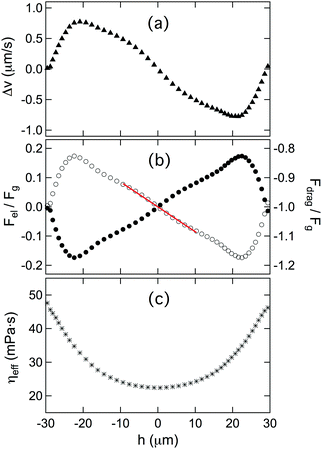 |
| | Fig. 6 (a) The velocity difference Δv(h) = v(h) – v(−h) obtained from the results in Fig. 5(b). (b) The elastic force Fel (open circles) and drag force Fdrag (filled circles) acting on the sphere as a function of vertical position. The red line shows the result to a linear fit to Fel over the range −10 < h < 10 μm. (c) The position-dependent effective drag viscosity obtained from the velocity and Fdrag. | |
Furthermore, the Stokes drag and effective viscosity are obtained as:
| |  | (7) |
| |  | (8) |
The spatially varying drag force and effective viscosity obtained from
eqn (7) and (8) are plotted in
Fig. 6(b) and (c), respectively. The effective viscosity
ηeff is largest at
h = ±
H/2 and decreases as the colloid translates toward the passage way between two posts, reaching a minimum at
h = 0, before increasing again after it passes through. The variation in the effective viscosity,

, is about 1.5. A spatially varying viscous drag can be expected since the colloid experiences a changing local director field as it traverses the array.
64,66,67 The minimum in the drag at
h = 0 is somewhat surprising, however, since the director is primarily perpendicular to the colloid's velocity at that point, which is the orientation of maximum drag in a uniform director. We attribute the increasing drag on approaching the points
h = ±
H/2 to the presence of the surface defect at those points, as illustrated in
Fig. 2(d). Any motion of the defect induced by the colloid will contribute to the viscous dissipation, and as shown previously such dissipation can lead to anomalously large effective drag viscosities.
46
3.2.3 Discussion of elastic force.
Quantitative modeling of Fel, which as mentioned above potentially contains contributions from both elasticity and backflow, would require detailed calculations of the director field in the vicinity of the colloids and posts as a function of colloid position. However, we can assess on dimensional grounds whether the force is at a scale expected for an elastic interaction. Specifically, the magnitude of such a force should be set by the Frank elastic constants of the liquid crystal, so that in the Hookean region at small h, the force has a form| |  | (9) |
where K ≈ 4 pN is an average elastic constant of 5CB and L is a length scale related to the region of the liquid crystal in which the director-field distortion by the colloid costs energy. The solid line in Fig. 6(b) shows the result of a linear fit to the force over the range −10 μm < h < 10 μm. The slope gives K/L ≈ 0.08 pN μm−1, or L ≈ 50 μm, a scale similar to that of the dimensions of the array, indicating the non-viscous contribution to the force on the colloids indeed results primarily from elastic interactions. More interesting than the precise size of the force, however, is its dependence on the position of the colloids with respect to the posts. As discussed in Section 3.1, the trajectory of a colloid in the vicinity of an isolated post reveals a repulsive pair interaction, consistent with expectations based on the incompatible anchoring conditions at the colloid and post surfaces. In contrast, the mobility of a colloid in the micropost array shows how the force on the colloid in this confined environment cannot be treated simply in terms of pair-wise additive interactions. Specifically, while the tendency of the colloids to follow a path that bisects columns of posts is consistent with repulsion from the posts, the Hookean force implies an attraction to the height h = 0, where the colloids are at their closest point to the posts, that indicates a subtler spatial dependence of the force. Qualitatively, the attraction to h = 0 can be understood in terms of the director field configuration depicted in Fig. 2(c) and (d). The relatively uniform director field near h = 0 is more compatible with the planar anchoring on the sphere surfaces than is the divergent director field at h = ±H/2, implying a gradient in the elastic energy caused by the colloid with an energy minimum at h = 0.
3.3 Directional locking
As mentioned above, a key motivation for investigating the transport of colloidal particles in nematics within microfluidic post arrays was the transport behavior observed in such arrays containing a simple isotropic liquid. Specifically, as Drazer and coworkers51–54,56,68 have explored in detail, when the angle α between the driving force (gravity) and the columns of posts is varied continuously, the direction of propagation of the colloids through the lattice changes discretely. In particular, Risbud and Drazer56 modeled this directional locking and showed how it depends on geometric considerations – specifically the relative sizes of the posts, lattice spacing, and colloids – and on the nature of the non-hydrodynamic interactions between the sphere and post, which in simple, isotropic liquids presumably involve short-range (contact) forces. In order to understand how this behavior might be varied and potentially controlled through the forces on colloids mediated by the nematic, we investigated the propagation of silica spheres through 5CB within the arrays as a function of α and compared the behavior to that seen in equivalent measurements performed in water.
Employing spheres with radii around 6.3 μm, we found that the colloids exhibited directional locking by selecting among only three propagation directions through the lattice as α was varied from 0 to 45°. These directions, which can be labeled based on their lattice vectors as [0,1], [1,2] and [1,1], are illustrated in Fig. 7(a)–(c). Fig. 8 shows the migration angle θ, defined as the angle between the propagation direction and the [0,1] direction, as a function of α. When the angle between the force and [0,1] direction was small, the particles’ trajectories remained locked with the lattice in the [0,1] direction (θ = 0), and when the angle between force and lattice [0,1] direction was close to 45°, the trajectories were locked with the lattice in the [1,1] direction (θ = 45°). Finally, when α as at intermediate values, the trajectories locked to the [1,2] direction (θ = 26.6°) and exhibited doubly periodic motion, as illustrated in Fig. 7(b). (For examples of colloidal propagation along the each direction, see ESI† Videos SV1, SV2, and SV3, which show colloids descending through arrays oriented at α = 0, 18°, and 32°, respectively.) The first transition angle θF at which the trajectories changed from the [0,1] to the [1,2] direction was θF ≈ 12°, and the second, or last, transition angle θL from [1,2] to [1,1] was θL ≈ 25°. We note that the Peclet number in the experiment, Pe = FgR/kBT, where kB is the Boltzman constant and T is temperature, was approximately 2 × 10⁴, indicating that diffusion was negligible and this particle motion was essentially deterministic.
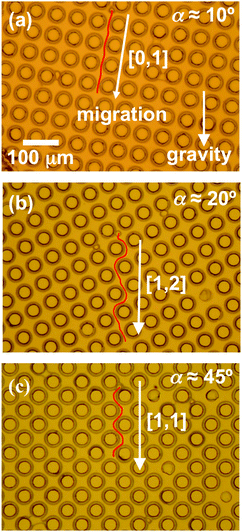 |
| | Fig. 7 Micrographs illustrating directional locking of silica microspheres descending under gravity through the post array within nematic 5CB as the angle α between the principal axis and gravity is varied. Three locking directions are observed: (a) at small α colloids migrate along [0,1], (b) at intermediate α they migrate along [1,2], and (c) at large α they migrate along [1,1]. | |
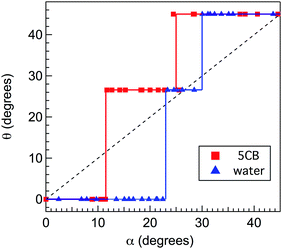 |
| | Fig. 8 The average angle θ of the colloid velocity with respect to the principal axis of the array as a function of the angle α between the principal axis and gravity for colloids in nematic 5CB (red squares) and in water (blue triangles). The solid lines are guides to the eye, and the dashed line shows θ = α. | |
For comparison, we performed the same set of measurements on silica spheres of the same size translating through an isotropic liquid (15 mM KOH aqueous solution). The results for the propagation directions are also shown in Fig. 8. In the isotropic liquid, the spheres assumed the same three locking directions as in nematic 5CB; however, the transition angles from [0,1] to [1,2] and from [1,2] to [1,1] were different. Specifically, θF = 23° and θL = 30°, respectively, in the isotropic fluid. The values of these angles agree closely with a prediction of the model of Risbud and Drazer,56
| |  | (10) |
In contrast, the transition angles seen in 5CB,
θF ≈ 12° and
θL ≈ 25°, strongly disagree with this prediction. Similarly, the relatively long-range irreversible interactions observed in the motion of a colloid past a single post would indicate a first transition angle that is significantly larger than the observed
θF ≈ 12°. Specifically, Risbud and Drazer identify a critical offset
bc between the sphere and post such that for
bin <
bc, where
bin is the incoming offset as shown in
Fig. 3, non-hydrodynamic interactions become important and find sin(
θF) =
bc/
H. Based on the trajectories of colloids past isolated posts like in
Fig. 3, we would estimate
bc ≥ 26 μm, implying
θF ≥ 25°, in strong contrast with the value measured in the post array.
We identify this disagreement with two approximations in the model of Risbud and Drazer that the nematic array violates. First, the model incorporates non-hydrodynamic interactions between the sphere and obstacles by assigning a hard-core effective radius to the obstacles, an approximation that is suitable for short-range interactions related to surface roughness, etc. that dominate in simple isotropic liquids but is apparently not appropriate for the softer, longer-range interactions mediated by the nematic. Second, the model assumes the sphere's trajectory through the array is dictated by isolated, pair-wise interactions with the obstacles. As comparison of the results in Sections 3.1 and 3.2 shows, such an approximation would lead to a qualitatively incorrect description of the motion in the array. One source of the breakdown in the pair-wise approximation is the extended range of the interaction between posts and colloids, implying the colloids interact with multiple posts simultaneously. More fundamentally, however, the differing boundary conditions on the nematic director introduced by a post in isolation versus by an array such posts lead to different director-field configurations that result in qualitatively different nematic forces on the colloids.
4. Conclusions
In conclusion, these experiments to investigate the mobility of colloidal particles in nematics containing obstacle arrays have illustrated the unique forms of interactions that can be mediated by liquid crystals, particularly in confined geometries. The key contribution of the post arrays is their ability to engineer broken translational symmetry within a fluid by patterning the nematic director field. An interesting future direction for this research would take advantage of technologies to pattern director fields via substrate anchoring, where recent advances have demonstrated the formation of intricate defect patterns within the bulk.69 Combined with capabilities to reconfigure director fields, for example with applied electric fields, these approaches could form the basis for dynamic and addressable arrays that steer colloidal particles without relying on physical obstacles, thereby opening new avenues for applications in areas of colloidal separations and self-assembly.
Conflicts of interest
There are no conflicts to declare.
Acknowledgements
We gratefully acknowledge Martin Haase, David Rivas, Francesca Serra, and Lisa Tran for helpful discussions. Funding was provided by the NSF (DMR-1610875 and DMR-1262047) and by a Simons Investigator grant from the Simons Foundation to R. D. K.
References
- Y. D. Gu and N. L. Abbott, Phys. Rev. Lett., 2000, 85, 4719–4722 CrossRef CAS PubMed.
- H. Stark, Phys. Rep., 2001, 351, 387–474 CrossRef CAS.
- D. Andrienko, M. P. Allen, G. Skacej and S. Zumer, Phys. Rev. E: Stat., Nonlinear, Soft Matter Phys., 2002, 65, 041702 CrossRef PubMed.
- C. Lapointe, A. Hultgren, D. M. Silevitch, E. J. Felton, D. H. Reich and R. L. Leheny, Science, 2004, 303, 652–655 CrossRef CAS PubMed.
- F. R. Hung, O. Guzman, B. T. Gettelfinger, N. L. Abbott and J. J. de Pablo, Phys. Rev. E: Stat., Nonlinear, Soft Matter Phys., 2006, 74, 011711 CrossRef PubMed.
- F. R. Hung, Phys. Rev. E: Stat., Nonlinear, Soft Matter Phys., 2009, 79, 021705 CrossRef PubMed.
- C. P. Lapointe, T. G. Mason and I. Smalyukh, Science, 2009, 326, 1083–1086 CrossRef CAS PubMed.
- C. Lapointe, N. Cappallo, D. H. Reich and R. L. Leheny, J. Appl. Phys., 2005, 97, 10Q304 CrossRef.
- O. P. Pishnyak, S. Tang, J. R. Kelly, S. V. Shiyanovskii and O. D. Lavrentovich, Phys. Rev. Lett., 2007, 99, 127802 CrossRef CAS PubMed.
- O. D. Lavrentovich, Soft Matter, 2014, 10, 1264–1283 RSC.
- V. G. Nazarenko, A. B. Nych and B. I. Lev, Phys. Rev. Lett., 2001, 87, 075504 CrossRef CAS PubMed.
- I. Musevic, M. Skarabot, U. Tkalec, M. Ravnik and S. Zumer, Science, 2006, 313, 954–958 CrossRef CAS PubMed.
- M. Skarabot, M. Ravnik, S. Zumer, U. Tkalec, I. Poberaj, D. Babic, N. Osterman and I. Musevic, Phys. Rev. E: Stat., Nonlinear, Soft Matter Phys., 2007, 76, 051406 CrossRef CAS PubMed.
- U. Ognysta, A. Nych, V. Nazarenko, I. Musevic, M. Skarabot, M. Ravnik, S. Zumer, I. Poberaj and D. Babic, Phys. Rev. Lett., 2008, 100, 217803 CrossRef CAS PubMed.
- A. Nych, U. Ognysta, M. Škarabot, M. Ravnik, S. Žumer and I. Muševič, Nat. Commun., 2013, 4, 1489 CrossRef CAS PubMed.
- H. Mundoor, B. Senyuk and I. I. Smalyukh, Science, 2016, 352, 69–73 CrossRef CAS PubMed.
- S. Khullar, C. F. Zhou and J. J. Feng, Phys. Rev. Lett., 2007, 99, 237802 CrossRef PubMed.
- A. Jakli, B. Senyuk, G. Liao and O. D. Lavrentovich, Soft Matter, 2008, 4, 2471–2474 RSC.
- O. D. Lavrentovich, I. Lazo and O. P. Pishnyak, Nature, 2010, 467, 947–950 CrossRef CAS PubMed.
- J. B. Rovner, C. P. Lapointe, D. H. Reich and R. L. Leheny, Phys. Rev. Lett., 2010, 105, 228301 CrossRef PubMed.
- C. P. Lapointe, S. Hopkins, T. G. Mason and I. I. Smalyukh, Phys. Rev. Lett., 2010, 105, 178301 CrossRef PubMed.
- B. T. Gettelfinger, J. A. Moreno-Razo, G. M. Koenig, J. P. Hernandez-Ortiz, N. L. Abbott and J. J. de Pablo, Soft Matter, 2010, 6, 896–901 RSC.
- O. P. Pishnyak, S. V. Shiyanovskii and O. D. Lavrentovich, Phys. Rev. Lett., 2011, 106, 047801 CrossRef PubMed.
- T. Turiv, I. Lazo, A. Brodin, B. I. Lev, V. Reiffenrath, V. G. Nazarenko and O. D. Lavrentovich, Science, 2013, 342, 1351–1354 CrossRef CAS PubMed.
- I. Lazo and O. D. Lavrentovich, Philos. Trans. R. Soc., A, 2013, 371, 20120255 CrossRef PubMed.
- M. Škarabot, Ž. Lokar and I. Muševič, Phys. Rev. E: Stat., Nonlinear, Soft Matter Phys., 2013, 87, 062501 CrossRef PubMed.
- B. Senyuk, D. Glugla and I. I. Smalyukh, Phys. Rev. E: Stat., Nonlinear, Soft Matter Phys., 2013, 88, 062507 CrossRef PubMed.
- G. Foffano, J. S. Lintuvuori, A. Tiribocchi and D. Marenduzzo, Liq. Cryst. Rev., 2014, 2, 1–27 CrossRef CAS.
- Y. Sasaki, Y. Takikawa, V. S. R. Jampani, H. Hoshikawa, T. Seto, C. Bahr, S. Herminghaus, Y. Hidaka and H. Orihara, Soft Matter, 2014, 10, 8813–8820 RSC.
- S. Hernàndez-Navarro, P. Tierno, J. A. Farrera, J. Ignés-Mullol and F. Sagués, Angew. Chem., 2014, 126, 10872–10876 CrossRef.
- A. Eremin, P. Hirankittiwong, N. Chattham, H. Nádasi, R. Stannarius, J. Limtrakul, O. Haba, K. Yonetake and H. Takezoe, Proc. Natl. Acad. Sci. U. S. A., 2015, 112, 1716–1720 CrossRef CAS PubMed.
- M. C. M. Varney, Q. Zhang and I. I. Smalyukh, Phys. Rev. E: Stat., Nonlinear, Soft Matter Phys., 2015, 91, 052503 CrossRef PubMed.
- N. M. Silvestre, P. Patricio and M. M. T. da Gama, Phys. Rev. E: Stat., Nonlinear, Soft Matter Phys., 2004, 69, 061402 CrossRef CAS PubMed.
- F. R. Hung, B. T. Gettelfinger, G. M. Koenig, N. L. Abbott and J. J. de Pablo, J. Chem. Phys., 2007, 127, 124702 CrossRef PubMed.
- C. P. Lapointe, D. H. Reich and R. L. Leheny, Langmuir, 2008, 24, 11175–11181 CrossRef CAS PubMed.
- A. Sengupta, C. Bahr and S. Herminghaus, Soft Matter, 2013, 9, 7251–7260 RSC.
- J. K. Whitmer, X. Wang, F. Mondiot, D. S. Miller, N. L. Abbott and J. J. de Pablo, Phys. Rev. Lett., 2013, 111, 227801 CrossRef PubMed.
- M. Rahimi, T. F. Roberts, J. C. Armas-Pérez, X. Wang, E. Bukusoglu, N. L. Abbott and J. J. de Pablo, Proc. Natl. Acad. Sci. U. S. A., 2015, 112, 5297–5302 CrossRef CAS PubMed.
- Y. Luo, F. Serra, D. A. Beller, M. A. Gharbi, N. Li, S. Yang, R. D. Kamien and K. J. Stebe, Phys. Rev. E, 2016, 93, 032705 CrossRef PubMed.
- Y. Luo, F. Serra and K. J. Stebe, Soft Matter, 2016, 12, 6027–6032 RSC.
- M. Cavallaro, M. A. Gharbi, D. A. Beller, S. Čopar, Z. Shi, T. Baumgart, S. Yang, R. D. Kamien and K. J. Stebe, Proc. Natl. Acad. Sci. U. S. A., 2013, 110, 18804–18808 CrossRef CAS PubMed.
- C. Peng, T. Turiv, Y. Guo, S. V. Shiyanovskii, Q.-H. Wei and O. D. Lavrentovich, Sci. Adv., 2016, 2, e1600932 Search PubMed.
- C. Rosu, S. Jacobeen, K. Park, E. Reichmanis, P. Yunker and P. S. Russo, Langmuir, 2016, 32, 13137–13148 CrossRef CAS PubMed.
- C. Peng, T. Turiv, R. Zhang, Y. Guo, S. V. Shiyanovskii, Q.-H. Wei, D. P. Juan and O. D. Lavrentovich, J. Phys.: Condens. Matter, 2017, 29, 014005 CrossRef PubMed.
- M. C. M. Varney, Q. Zhang, M. Tasinkevych, N. M. Silvestre, K. A. Bertness and I. I. Smalyukh, Phys. Rev. E: Stat., Nonlinear, Soft Matter Phys., 2014, 90, 062502 CrossRef PubMed.
- K. Chen, L. P. Metcalf, D. P. Rivas, D. H. Reich and R. L. Leheny, Soft Matter, 2015, 11, 4189–4196 RSC.
- P. T. Korda, M. B. Taylor and D. G. Grier, Phys. Rev. Lett., 2002, 89, 128301 CrossRef PubMed.
- M. P. MacDonald, G. C. Spalding and K. Dholakia, Nature, 2003, 426, 421–424 CrossRef CAS PubMed.
- L. R. Huang, E. C. Cox, R. H. Austin and J. C. Sturm, Science, 2004, 304, 987–990 CrossRef CAS PubMed.
- D. W. Inglis, K. J. Morton, J. A. Davis, T. J. Zieziulewicz, D. A. Lawrence, R. H. Austin and J. C. Sturm, Lab Chip, 2008, 8, 925–931 RSC.
- M. Balvin, E. Sohn, T. Iracki, G. Drazer and J. Frechette, Phys. Rev. Lett., 2009, 103, 078301 CrossRef PubMed.
- J. Herrmann, M. Karweit and G. Drazer, Phys. Rev. E: Stat., Nonlinear, Soft Matter Phys., 2009, 79, 061404 CrossRef PubMed.
- T. Bowman, J. Frechette and G. Drazer, Lab Chip, 2012, 12, 2903–2908 RSC.
- R. Devendra and G. Drazer, Anal. Chem., 2012, 84, 10621–10627 CrossRef CAS PubMed.
- J. P. Gleghorn, J. P. Smith and B. J. Kirby, Phys. Rev. E: Stat., Nonlinear, Soft Matter Phys., 2013, 88, 032136 CrossRef PubMed.
- S. R. Risbud and G. Drazer, Phys. Rev. E: Stat., Nonlinear, Soft Matter Phys., 2014, 90, 012302 CrossRef PubMed.
-
D. B. Allan, T. A. Caswell, N. C. Keim, F. Boulogne, R. W. Perry and L. Uieda, trackpy: Trackpyv0.2.4, 2014 Search PubMed.
- J. C. Crocker and D. G. Grier, J. Colloid Interface Sci., 1996, 179, 298–310 CrossRef CAS.
- S. R. Risbud and G. Drazer, J. Fluid Mech., 2013, 714, 213–237 CrossRef CAS.
- A. G. Chmielewski, Mol. Cryst. Liq. Cryst., 1986, 132, 339–352 CrossRef CAS.
- N. V. Madhusudana and R. Pratibha, Mol. Cryst. Liq. Cryst., 1982, 89, 249–257 CrossRef CAS.
- H. Stark and D. Ventzki, Europhys. Lett., 2002, 57, 60–66 CrossRef CAS.
- C. Zhou, P. Yue and J. J. Feng, J. Fluid Mech., 2007, 593, 385–404 Search PubMed.
- H. Stark and D. Ventzki, Phys. Rev. E: Stat., Nonlinear, Soft Matter Phys., 2001, 64, 031711 CrossRef CAS PubMed.
- J. B. Rovner, D. H. Reich and R. L. Leheny, Langmuir, 2013, 29, 2104–2107 CrossRef CAS PubMed.
- J. C. Loudet, P. Hanusse and P. Poulin, Science, 2004, 306, 1525 CrossRef CAS PubMed.
- M. Skarabot and I. Musevic, Soft Matter, 2010, 6, 5476–5481 RSC.
- Z. Li and G. Drazer, Phys. Rev. Lett., 2007, 98, 050602 CrossRef PubMed.
- Y. Guo, M. Jiang, C. Peng, K. Sun, O. Yaroshchuk, O. Lavrentovich and Q.-H. Wei, Adv. Mater., 2016, 28, 2353–2358 CrossRef CAS PubMed.
Footnote |
| † Electronic supplementary information (ESI) available. See DOI: 10.1039/c7sm01681f |
|
| This journal is © The Royal Society of Chemistry 2018 |
 b,
Randall D.
Kamien
 c,
Daniel H.
Reich
a and
Robert L.
Leheny
 *a
*a


 , is about 1.5. A spatially varying viscous drag can be expected since the colloid experiences a changing local director field as it traverses the array.64,66,67 The minimum in the drag at h = 0 is somewhat surprising, however, since the director is primarily perpendicular to the colloid's velocity at that point, which is the orientation of maximum drag in a uniform director. We attribute the increasing drag on approaching the points h = ±H/2 to the presence of the surface defect at those points, as illustrated in Fig. 2(d). Any motion of the defect induced by the colloid will contribute to the viscous dissipation, and as shown previously such dissipation can lead to anomalously large effective drag viscosities.46


