Role of oversized dopant potassium on the nanostructure and thermoelectric performance of calcium cobaltite ceramics
C.
Romo-De-La-Cruz
,
L.
Liang
,
S. A. Paredes
Navia
,
Y.
Chen
,
J.
Prucz
and
X.
Song
 *
*
Department of Mechanical and Aerospace Engineering, West Virginia University, Morgantown, WV 26506, USA. E-mail: xueyan.song@mail.wvu.edu
First published on 1st February 2018
Abstract
The impact of the non-stoichiometric addition of potassium (K) on the nanostructure and thermoelectric performance of misfit layered calcium cobaltite (Ca3Co4O9) ceramics is reported. The samples were prepared with the designed nominal composition of Ca3Co4O9Kx (x = 0, 0.05, 0.1, 0.15, and 0.2). The K addition promoted the crystal growth and improved the crystal texture. The nanostructure and chemical analysis revealed the segregation of K at the Ca3Co4O9 grain boundaries, while the Ca3Co4O9 grain interior was free of K. At the optimal doping level, the dopant K grain boundary segregation reduced the electrical resistivity and simultaneously increased the Seebeck coefficient, resulting in a large increase in the power factor. At 320 K, the sample Ca3Co4O9K0.1 achieved the power factor of 930 μW K−2 m−1, which is 2.25 times higher than 412 μW K−2 m−1 from pristine Ca3Co4O9 and by far, the highest power factor at room temperature regime for the Ca3Co4O9 ceramics. The impact of the dopant segregation on the ionic diffusion along the grain boundaries and its resultant thermoelectric performance enhancement of Ca3Co4O9 ceramics are discussed.
Introduction
The mechanical, thermal, and electrical properties of oxide ceramics are profoundly dependent on the crystalline imperfections, such as the nature and concentration of point defect dopants.1 In addition to changing the intragranular stoichiometry of the ceramics, the dopants could segregate at the intergranular grain boundaries of various ceramics. The dopant segregation at the grain boundaries first affects the materials processing since the ionic diffusion along the grain boundaries dominates the grain growth, crystallographic texture development, and phase transformation occurring during the solid-state sintering reactions. As well recognized by the scientists, ceramics are unique in terms of the breadth of the compositional and structural variations that can occur within the boundaries.2 In particular, the grain boundary dopant segregation overwhelmingly affects the final performance of the sintered ceramics. For example, it has been well documented that the incorporation of the oversized dopant ions at the alumina grain boundaries can significantly influence the high-temperature mechanical behavior.3–5 In terms of electroceramics, the dopant segregation at the grain boundaries renders the formation of the space-charge layer6 adjacent to the grain boundary plane and results in the consequent redistribution of defects and solutes in the grain interiors. Thus, the enrichment or depletion of dopants and consequential mobile charge carriers adjacent to the grain boundaries has significant consequences on the transport properties. The importance of dopants in controlling the grain boundary properties has gained increasing attention in various electroceramics. However, for the thermoelectric (TE) oxide ceramics, such as Ca3Co4O9, the possible dopant segregation at the grain boundaries and its impact on the nanostructure and the TE performance have been largely unexplored.The TE materials possess the capability of converting the temperature difference into the electricity directly and could contribute to the most prominent energy production for harnessing the waste heat produced by diverse sectors, such as automobiles.7,8 Among various TE materials9–13 developed during the past several decades, metal oxides have recently gained increasing attention for high-temperature power generation due to their low-cost and high thermal stability at high temperatures in the air.14 The energy conversion efficiency of the TE materials is characterized using the figure-of-merit ZT, which is defined as ZT = S2/ρ−1κ−1T, where S, ρ, S2/ρ−1, and κ are the Seebeck coefficient, electrical resistivity, power factor and thermal conductivity, respectively. Because of the intense research efforts in the field of the TE materials during the past decades, the state-of-the-art commercial conventional TE materials such as bismuth telluride (Bi2Te3) and lead telluride (PbTe) possess the values of ZT ∼ 1, which corresponds to an energy conversion efficiency of 10% for T = 300 K.15
Misfit layered calcium cobaltite (Ca3Co4O9) has been one of the most promising p-type oxide materials for the TE power generation.12,16–18 Calcium cobaltite single crystals show an extraordinary TE performance with an extrapolated value of ZT of 0.87 at 973 K.19 Nevertheless, the development of the Ca3Co4O9 polycrystalline ceramics has been largely neglected during the past decade because of their low energy conversion efficiency.21 The TE performance of polycrystals is reported to be only ∼20% of that from the single crystal and with the commonly measured ZT of ∼0.2 at ∼900 K.20 The strategies to increase the value of ZT include increasing the magnitude of the electrical power factor, S2/ρ, and lowering the thermal conductivity κ.
Cation doping via lattice substitution, particularly partial substitution of Ca2+, remains to be one of the most promising approaches to enhance the electrical power factor and TE performance in polycrystalline Ca3Co4O9. Stoichiometric substitution at the Ca and/or Co sites using alkaline metals, alkaline earth metals, transition metals, post-transition metals, and/or rare-earth metals have been widely investigated.21,22 However, the majority of those literature reports were focused on the effect of dopant substitution of Ca and Co in the Ca3Co4O9 lattice, while the possible dopant segregation at the grain boundaries and its effect on the TE performance were largely unexplored. As mentioned previously, the grain boundary dopant segregation and the associated space charge layer could have a profound influence on the electrical transport and the TE performance of oxide electroceramics.23 Furthermore, for calcium cobaltite, there is large anisotropy with the electric conductivity much higher along the ab-plane than that along the c-axis of the monoclinic unit cell. Inasmuch as grain boundary segregation may have greater influence for polycrystalline Ca3Co4O9, the grain boundary segregation could affect the solid-state sintering and the segregation ions could be either the grain growth inhibitor or trigger, thus further affecting the crystalline texture and the resultant performance of entire ceramics.
With the attempt of understanding the possible dopant segregation at the grain boundaries of the Ca3Co4O9 ceramics, we have recently demonstrated that Bi and Ba,24–26 could be introduced into the Ca3Co4O9 ceramics to improve the texture of the crystal and simultaneously enhance the Seebeck coefficient and electrical conductivity. Doping Ca3Co4O9 with Bi results in the substitution of Ca in the lattice and GBs as well as the segregation of Bi at the grain boundaries. In contrast, in Ba-doped Ca3Co4O9, Ba only segregates at the GBs and the Ca3Co4O9 lattice is free of Ba. Both Bi3+ and Ba2+ are larger than the host ion Ca2+. Thus, the driving force for the dopant grain boundary segregation is postulated as the ionic size effect rather than the Coulomb interaction. Nevertheless, the concentrations of dopants at the grain boundaries vary from their bulk values, depending on the sign and magnitude of their charge. In other words, the aliovalent solutes of trivalent Bi3+ and isovalent divalent Ba2+ could result in the different mobile charge carrier concentrations at the grain boundaries. Accordingly, an ionic radius may not be the only simple factor for improving the crystal texture and enhancing the TE performance of the Ca3Co4O9 ceramics. Motivated by the previous results on doping trivalent Bi3+ and divalent Ba2+ and to better understand the driving force for the dopant segregation as well as its resultant TE performance, we studied the impact of oversized monovalent K+ dopants on the nanostructure and performance of the Ca3Co4O9 ceramics.
Experimental
The precursor powders with nominal chemistry of Ca3Co4O9Kx (x = 0, 0.05, 0.1, 0.15, and 0.2) were prepared by the conventional chemical sol–gel route. The precursor raw materials, Ca(NO3)2·4H2O, Co(NO3)2·6H2O, and KNO3 (99%, Alfa Aesar) were mixed in stoichiometric ratios in deionized water. Ethylene glycol and polyethylene glycol were used to polymerize the solution. Nitric acid was added to induce the decomposition of nitrate salts and facilitate the formation of a new compound. The solution was mechanically stirred at 353 K for 3 h to form a gel. The gel was ashed at 773 K for 2 h and then, the ashes were manually ground and subjected to calcination at 923 K for 4 h with an oxygen flow. The calcined powders were uniaxially pressed into pellets under 1 GPa and at 298 K. The pellets were sintered at 1233 K for 9 h in a tube furnace with an oxygen flow.The electrical resistivity ρ and absolute Seebeck coefficient S were measured using a Linseis LSR-1100 unit. The measurements were performed in the parallel direction to the pressed plane from 323 K to 1073 K under a low pressure He gas environment. X-Ray powder diffraction (XRD) analysis was performed using a PANatycal X'Pert Pro for crystal phase identification and lattice parameter determination. The powders ground from the sintered samples were used in the XRD analysis using Cu K-alpha radiation, 45 kV tension, and 40 mA current at room temperature. The cross-sectional morphology of the sintered pellets was observed using a Hitachi-S4700F scanning electron microscope (SEM). The samples for transmission electron microscopy (TEM) were prepared by mechanically polishing and ion milling in a liquid-nitrogen-cooled holder. Electron diffraction, diffraction contrast, and high-resolution TEM imaging were performed in a JEM-2100 operated at 200 kV. The chemical analysis was carried out using energy dispersive spectroscopy (EDS) under TEM with the electron probe size of ∼20 nm for EDS data acquisition.
Results
To investigate the effect of the K addition on the lattice parameter variation, the XRD patterns recorded for the powders ground from the sintered pellets of the Ca3Co4O9Kx samples are shown in Fig. 1. All characteristic XRD peaks can be indexed as those from the Ca3Co4O9 phase (PDF: #23-110) with monoclinic symmetry and the addition of K dopant does not introduce the secondary phase formation inside the Ca3Co4O9 ceramics. The calculated lattice parameter values based on the XRD patterns from each sample are listed in Table 1.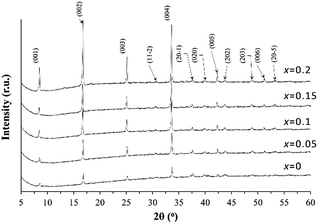 | ||
| Fig. 1 XRD powder diffraction patterns for the undoped Ca3Co4O9 and the doped Ca3Co4O9Kx (x = 0.05, 0.1, 0.15, and 0.2) samples. | ||
| Ca3Co4O9Kx | a (Å) | b 1 (Å) | b 2 (Å) | c (Å) | β |
|---|---|---|---|---|---|
| x = 0 | 4.909 | 4.525 | 2.753 | 10.516 | 99.540 |
| x = 0.05 | 4.905 | 4.521 | 2.756 | 10.557 | 99.569 |
| x = 0.10 | 4.904 | 4.523 | 2.756 | 10.575 | 99.471 |
| x = 0.15 | 4.903 | 4.523 | 2.762 | 10.572 | 99.344 |
| x = 0.20 | 4.902 | 4.521 | 2.763 | 10.550 | 99.317 |
With the increase of the K doping level up to x = 0.1 in Ca3Co4O9Kx, there is a consistent but very slight decrease in the lattice parameter a, which is accompanied by the increase in the lattice parameters of b2 and c.
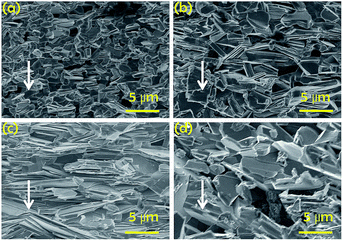
The cross-sectional SEM images taken from the fractured surface of the Ca3Co4O9Kx pellets are shown in Fig. 2 and the arrows indicate the direction for pressing pellets. All samples present micron-sized plate-shaped grains with large anisotropy and have the larger dimension parallel to the a–b plane of the monoclinic unit cell of Ca3Co4O9.27 With the increase in the potassium doping level up to x = 0.1, the size of the crystals gradually increases along the longitudinal direction of the plate-shaped grains. Furthermore, it can also be observed that the crystal texture with preference in the crystal grain orientation is developed for the Ca3Co4O9K0.1 sample. A majority of the crystals have the c-axis of the monoclinic structure parallel to the pressed direction of the Ca3Co4O9K0.1 pellet. For the pellets with the higher doping levels, the cross-sectional images display more randomly oriented grains and the crystal texture deteriorates.
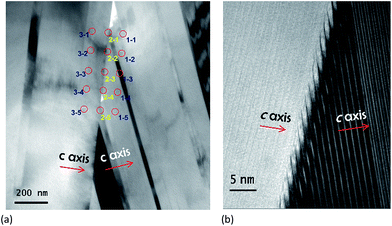
To further explore the effect of K doping on the nanostructure of the ceramics, TEM examination is performed on the Ca3Co4O9K0.1 sample having the best crystal texture. The TEM images in Fig. 3 illustrate the nanolamella structure from two adjacent grains with different c-axes. The high-resolution TEM (HRTEM) images in Fig. 3(b) reveal that there is no secondary phase formed at the grain boundaries at the nano-scale. To further characterize the chemical changes induced by K doping, EDS data were recorded from the grain interior and the grain boundary. The atomic ratio of different elements is summarized in Table 2.
| At% | 1–1 | 1–2 | 1–3 | 1–4 | 1–5 |
|---|---|---|---|---|---|
| O | 69.1 | 68.9 | 70.7 | 65.8 | 65.8 |
| Co | 17.0 | 16.4 | 16.0 | 18.4 | 18.4 |
| Ca | 13.9 | 14.7 | 13.3 | 15.8 | 15.8 |
| K | — | — | — | — | — |
| At% | 2–1 | 2–2 | 2–3 | 2–4 | 2–5 |
|---|---|---|---|---|---|
| O | 68.6 | 68.9 | 66.2 | 64.6 | 64.2 |
| Co | 17.1 | 16.5 | 17.7 | 18.4 | 19.4 |
| Ca | 13.5 | 14.1 | 15.8 | 16.5 | 16.1 |
| K | 0.8 | 0.5 | 0.3 | 0.5 | 0.3 |
| At% | 3–1 | 3–2 | 3–3 | 3–4 | 3–5 |
|---|---|---|---|---|---|
| O | 64.4 | 63.2 | 63.1 | 62.0 | 63.2 |
| Co | 19.3 | 20.4 | 20.9 | 21.0 | 20.8 |
| Ca | 16.3 | 16.4 | 16.0 | 17.0 | 16.0 |
| K | — | — | — | — | — |
The EDS results clearly indicated that the Ca3Co4O9 lattice is free of any K, while at the grain boundaries, a large amount of potassium prevails with segregation.
The overall crystalline texture development and the K segregation at the grain boundaries are schematized in Fig. 4
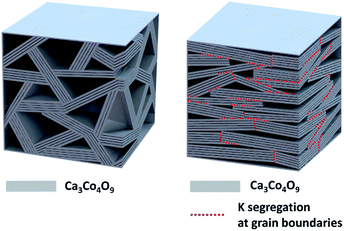 | ||
| Fig. 4 Schematic showing the crystal texture development and the dopant K segregation at the grain boundaries of the sample Ca3Co4O9K0.1. | ||
In comparison with the pristine sample that has the randomly orientated crystal grains, the Ca3Co4O9K0.1 sample has larger crystal grains that with preferred orientation along the c-axis of the monoclinic structure parallel to the pressed direction of the Ca3Co4O9K0.1 pellet. In particular, the crystal grain interior is free of dopant K, which segregated to the grain boundaries between the crystal grains with different c-axes.
The K doping also mediates the electrical transport properties of the Ca3Co4O9Kx pellets that were measured at different temperatures. The variations of ρ, S, and S2/ρ for the pellets with different K+ concentrations as a function of temperature are shown in Fig. 5. For the samples with K doping concentrations lower than x = 0.10, the predominant behaviour of the ρ–T curves is metallic-like and ρ increases as the measurement temperature increases. As the K doping level increases to x = 0.15 and 0.2, the samples exhibit a metal–semiconductor transition at around 513 K. At a low-temperature regime, the magnitude of ρ decreases with an increase in K doping concentration up to x = 0.10. At 323 K, the Ca3Co4O9K0.1 sample reaches a low ρ value of 27.6 μΩ m, thus yielding 38% reduction in comparison with that of the pristine Ca3Co4O9. As the doping concentration is increased beyond x = 0.15, ρ increases.
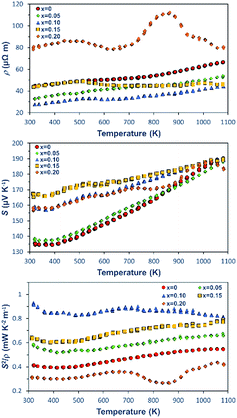 | ||
| Fig. 5 Temperature dependence of the electrical properties for Ca3Co4O9Kx (x = 0, 0.05, 0.1, 0.15, and 0.2): (a) ρ–T, (b) S–T, and (c) S2/ρ–T. | ||
In addition to decreasing ρ, the doping of K also affects S. At 323 K, the magnitude of S increases with an increase in the doping concentrations, resulting in an improvement to ∼167.5 μV K−1 for the Ca3Co4O9K0.15 sample in comparison with ∼134.5 μV K−1 for of Ca3Co4O9. It is worthwhile to point out that the substantial increase in the S values for the doped samples clearly indicates the decrease in the carrier concentration n induced by K doping. Moreover, the electrical conductivity σ is characterized by σ = neμ, where μ is the carrier mobility, e is the elementary positive charge constant and n is the number density of electrons. Thus, the increased S infers that the concomitant increase of the σ is a direct consequence of an increase in the bulk carrier mobility from the doped samples.
Benefited from the reduced ρ and increased S, at 320 K, the sample Ca3Co4O9K0.1 reaches the highest TE power factor of 930 μW K−2 m−1, which is 2.25 times higher than that of an already good performance of pristine Ca3Co4O9 (412 μW K−2 m−1). To our knowledge, the power factor S2/ρ of 930 μW K−2 m−1 is thus far the highest at the room temperature regime for the Ca3Co4O9 ceramics with different dopants and synthesized using different methods reported in the literature.20
Discussion
The above results clearly demonstrated that the dopant K segregated at the grain boundaries and affected both the crystal texture and the electrical performance of the Ca3Co4O9Kx ceramics. The driving force of K segregation at the grain boundaries can be interpreted based on the ionic size difference. The ionic radius of K+, Ca2+, and Co2+/Co3+ is 152 pm, 114 pm, and ∼80 pm, respectively. Instead of substituting Ca2+ in the lattice, the size mismatch between the K+ and host ions resulted in the segregation of K+ at the grain boundaries, which have more open sites for readily accommodating oversized dopants. For the dopants segregating at the grain boundaries, only small local distortions are required to obtain the ideal nearest neighbour distances. Such grain boundary segregation causes the relaxation of the strain around the segregant at the grain boundary.More interestingly, the oversized dopants appear to promote the crystal texture development in doped samples, such as Ca3Co4O9K0.1. The significant crystal texture development in the doped samples indicates that the segregation of K at the grain boundaries greatly alters the mass transport during the sintering process. In other words, it appears that the cation and related oxygen diffusion along the a–b basal plane of the monoclinic unit cell is greatly accelerated due to the K segregation at the grain boundaries. This result is consistent with our previous study on the dopants of trivalent Bi3+ and divalent Ba2+,25–27 showing that the segregation of these oversized ions to the grain boundaries resulted in the accelerated grain growth and the development of the crystal texture. Moreover, the diffusion kinetics is sensitive to the defect concentrations that are dominated by the doping levels; thus, over-doping beyond the optimized level results in the deterioration of the crystal texture for the crystal bundles with different c-axes. The optimum crystal texture is achieved at different doping levels for each dopant; for example, non-stoichiometric addition level is 0.07 for Ba2+ in Ca3Co4Ba0.07O9 and 0.1 for K+ in Ca3Co4O9K0.1. The incorporation of K+ at the grain boundaries is also presumably accompanied by the addition of O2− ions at the vicinity of the grain boundaries and causes the very slight increase in the lattice parameter values with the increase in the K doping level as shown in Table 1.
The present results on the segregation of the oversized dopant to the grain boundary of calcium cobaltite are somewhat consistent with those obtained for the study on other ceramics such as alumina that also has oversized dopants segregating at the grain boundaries. However, the impact of the oversized dopant on the grain boundary diffusion is different between calcium cobaltite and alumina. For example, in alumina, the oversized dopants (such as Ce, Zr, and Hf) retard the cation diffusion in the grain-boundary regime by over one order of magnitude and cause the concomitant retardation in grain growth.2 In the case of Ca3Co4O9, the cause of the accelerated diffusion along the grain boundaries and the resultant large crystal growth induced by the oversized dopants are unclear. Nevertheless, the results obtained from incorporating three different sets of the dopants K+, Ba2+, and Bi3+ (ref. 25–27) indicate that the grain boundaries of the Ca3Co4O9 ceramics apparently attract oversized cations. The segregation of the oversized dopants decreases the grain boundary energy and facilitates the fast diffusion along the grain boundaries and the crystal texture development.
The crystal texture development greatly increases the carrier mobility due to the large anisotropy of the Ca3Co4O9 unit cell. Thus, ρ of the Ca3Co4O9K0.1 sample is significantly reduced in comparison with that of the pristine Ca3Co4O9. The most important performance change is the simultaneous increase in S. In general, S can be enhanced due to the carrier filtering effect.28,29 The carrier filtering effect is caused by the strong energy dependence of the carrier relaxation time, which is caused by the band bending at the interfaces such as those between the nanoinclusions and the TE host materials. For the present study of the single-phase ceramics, the S enhancement is dramatic at room temperature regime and diminished at higher temperatures. This phenomenon could be explained in terms of the carrier filtering effect rising from the grain boundary space charge effect in various conducting oxides. The grain boundary with excess segregation of a positive or negative charge could attract point defects of opposite charge from the adjacent bulk materials and thus build up space charge layers on both sides of the boundary. Since a space charge layer corresponds to a barrier in the electrostatic potential, it will affect the charge transport. In general, the largest space layer thickness at room temperature is about ∼2 nm, which decreases with temperature. In case of cerium oxide, the influence of the space charge layer and the grain boundary effect become negligible at sufficiently high temperatures (e.g. >973 K).30 In addition, the S values show that over-addition of K+ to the samples does not further decrease the carrier concentration. There is an optimal extent to which the carrier filtering benefits the TE power factor since exceeding the optimal level of the carrier filtering could leads to an additional loss of carrier mobility due to the scattering at the interface of the crystals.31,32
Summary
This study demonstrates the enhancement of the TE performance of polycrystalline Ca3Co4O9 by the non-stoichiometric addition of an oversized dopant, viz., potassium. The optimal doping of K in Ca3Co4O9K0.1 results in the highest TE power factor of 930 μW K−2 m−1 at 320 K, which is 2.25 times higher than that of pristine Ca3Co4O9. The nanostructure examinations reveal that there is no substitution of the Ca2+ and Co2+/Co3+ sites by the dopant K. Instead, K is segregated at the Ca3Co4O9 grain boundaries. The segregation of K+ is primarily attributed to the large difference in its ionic radius in comparison with the Ca3Co4O9 lattice sites. The grain boundary segregation plays a significant role in promoting the crystal texture and grain alignment and increasing the carrier mobility in Ca3Co4O9. The addition of K+ acts as a carrier flittering barrier layer in the Ca3Co4O9 grain boundary, leading to a reduced carrier concentration and subsequently increasing the Seebeck coefficient. The present study on the effect of the monovalent K+ dopant segregation highlights the driving force for the dopant segregation and the critical role of segregating impurities in the grain boundary diffusion during the sintering. Such approach of tuning the dopant segregation appears to be versatile due to the incorporation of different dopants and opens new directions for dramatically improving the TE performance of various oxide ceramics and conventional semiconductor TE materials through controlling their grain boundary nanostructures.Conflicts of interest
There are no conflicts to declare.Acknowledgements
Cesar-Octavio Romo-De-La-Cruz, Liang Liang, and Xueyan Song greatly appreciate the Support from the National Science Foundation DMR (1254594). Sergio Andres Paredes Navia, Yun Chen, and Xueyan Song acknowledge the Support from the DOE-FE0024009.Notes and references
- G. S. Rohrer, M. Affatigato, M. Backhaus, R. K. Bordia, H. M. Chan, S. Curtarolo, A. Demkov, J. N. Eckstein, K. T. Faber and J. E. Garay, J. Am. Ceram. Soc., 2012, 95, 3699–3712 CrossRef CAS.
- P. R. Cantwell, M. Tang, S. J. Dillon, J. Luo, G. S. Rohrer and M. P. Harmer, Acta Mater., 2014, 62, 1–48 CrossRef CAS.
- J. W. Jeong, J. H. Han and D. Y. Kim, J. Am. Ceram. Soc., 2000, 83, 915–918 CrossRef CAS.
- A. Heuer, J. Eur. Ceram. Soc., 2008, 28, 1495–1507 CrossRef CAS.
- J. Cho, C. Wang, H. Chan, J. Rickman and M. Harmer, Acta Mater., 1999, 47, 4197–4207 CrossRef CAS.
- N. Sata, K. Eberman, K. Eberl and J. Maier, Nature, 2000, 408, 946–949 CrossRef CAS PubMed.
- R. Stobart, M. Wijewardane and Z. Yang, Appl. Therm. Eng., 2017, 112, 1433–1444 CrossRef CAS.
- Y. Kishita, Y. Ohishi, M. Uwasu, M. Kuroda, H. Takeda and K. Hara, J. Cleaner Prod., 2016, 126, 607–619 CrossRef CAS.
- J. Yang, L. Xi, W. Qiu, L. Wu, X. Shi, L. Chen, J. Yang, W. Zhang, C. Uher and D. J. Singh, npj Comput. Mater., 2016, 2, 15015 CrossRef CAS.
- L. Wu, J. Yang, S. Wang, P. Wei, J. Yang, W. Zhang and L. Chen, Phys. Rev. B, 2014, 90, 195210 CrossRef.
- X. Shi and L. Chen, Nat. Mater., 2016, 15, 691–692 CrossRef CAS PubMed.
- D. Kraemer, Q. Jie, K. McEnaney, F. Cao, W. Liu, L. A. Weinstein, J. Loomis, Z. Ren and G. Chen, Nat. Energy, 2016, 1, 16153 CrossRef CAS.
- E. Woermann and A. Muan, J. Inorg. Nucl. Chem., 1970, 32, 1455–1459 CrossRef CAS.
- G. J. Snyder and E. S. Toberer, Nat. Mater., 2008, 7, 105–114 CrossRef CAS PubMed.
- M. Otani, N. Lowhorn, P. K. Schenck, W. Wong-Ng, M. L. Green, K. Itaka and H. Koinuma, Appl. Phys. Lett., 2007, 91, 132102 CrossRef.
- S. Li, R. Funahashi, I. Matsubara, K. Ueno and H. Yamada, J. Mater. Chem., 1999, 9, 1659–1660 RSC.
- M. Karppinen, H. Fjellvag, T. Konno, Y. Morita, T. Motohashi and H. Yamauchi, Chem. Mater., 2004, 16, 2790–2793 CrossRef CAS.
- M. Tahashi, T. Tanimoto, H. Goto, M. Takahashi and T. Idoz, J. Am. Ceram. Soc., 2010, 93, 3046–3048 CrossRef CAS.
- M. Shikano and R. Funahashi, Appl. Phys. Lett., 2003, 82, 1851–1853 CrossRef CAS.
- J. W. Fergus, J. Eur. Ceram. Soc., 2012, 32, 525–540 CrossRef CAS.
- K. Koumoto, R. Funahashi, E. Guilmeau, Y. Miyazaki, A. Weidenkaff, Y. Wang and C. Wan, J. Am. Ceram. Soc., 2013, 96, 1–23 CrossRef CAS.
- X. Song, Y. Chen, S. Chen, E. Barbero, E. L. Thomas and P. Barnes, Solid State Commun., 2012, 152, 1509–1512 CrossRef CAS.
- X. Y. Song, G. Daniels, D. M. Feldmann, A. Gurevich and D. Larbalestier, Nat. Mater., 2005, 4, 470–475 CrossRef CAS PubMed.
- C. Boyle, P. Carvillo, Y. Chen, E. J. Barbero, D. Mcintyre and X. Song, J. Eur. Ceram. Soc., 2016, 36, 601–607 CrossRef CAS.
- C. Boyle, L. Liang, Y. Chen, J. Prucz, E. Cakmak, T. R. Watkins, E. Lara-Curzio and X. Song, Ceram. Int., 2017, 43, 11523–11528 CrossRef CAS.
- P. Carvillo, Y. Chen, C. Boyle, P. N. Barnes and X. Song, Inorg. Chem., 2015, 54, 9027–9032 CrossRef CAS PubMed.
- S. Chen, X. Song, X. Chen, Y. Chen, E. J. Barbero, E. L. Thomas and P. N. Barnes, J. Sol-Gel Sci. Technol., 2012, 64, 627–636 CrossRef CAS.
- J. Zide, D. Vashaee, Z. Bian, G. Zeng, J. Bowers, A. Shakouri and A. Gossard, Phys. Rev. B, 2006, 74, 205335 CrossRef.
- L. Hicks and M. S. Dresselhaus, Effect of quantum-well structures on the thermoelectric figure of merit, Phys. Rev. B, 1993, 47(19), 12727 CrossRef CAS.
- A. Tschöpe, S. Kilassonia, B. Zapp and R. Birringer, Solid State Ionics, 2002, 149, 261–273 CrossRef.
- P. Pichanusakorn and P. Bandaru, Mater. Sci. Eng., R, 2010, 67, 19–63 CrossRef.
- Y. Zhang, J. H. Bahk, J. Lee, C. S. Birkel, M. L. Snedaker, D. Liu, H. Zeng, M. Moskovits, A. Shakouri and G. D. Stucky, Adv. Mater., 2014, 26, 2755–2761 CrossRef CAS PubMed.
| This journal is © The Royal Society of Chemistry 2018 |

