Polyaniline based charcoal/Ni nanocomposite material for high performance supercapacitors†
Received
9th October 2017
, Accepted 16th January 2018
First published on 17th January 2018
Abstract
A facile wet chemical method was developed to synthesize a PANI/charcoal/Ni nanocomposite (PANI/AC/Ni), which was found to show significant electrochemical performance as a supercapacitor. The as-prepared sample was characterized by various spectral and analytical techniques. The newly fabricated PANI/AC/Ni nanocomposite electrode exhibited excellent specific capacitance with a maximum value of 1661 F g−1 at a discharge current density of 1 A g−1. Furthermore, the composite electrode showed a specific capacitance retention of 93% after 2000 charge–discharge cycles. Thus the PANI/AC/Ni nanocomposite was proved to be a promising electrode material for high-performance supercapacitors.
1. Introduction
The growing demand for clean and sustainable energy has stimulated intensive research directed towards the development of energy storage devices. Supercapacitors, also known as electrochemical capacitors or ultracapacitors, have attracted much attention due to their admirable properties, such as high power density, long cycle life and fast charge–discharge rate.1–3
There are two main classes of supercapacitors based on the charge-storage mechanism. One is electrochemical double layer capacitors (EDLCs), in which the capacitance rises at the electrode/electrolyte interface. And the other is pseudocapacitors, in which the pseudocapacitance arises from reversible Faradaic reactions occurring at the electrode surface. Carbonaceous materials are normally studied as electrodes for EDLCs, while transition metal oxides and conducting polymers are attractive materials for pseudocapacitors.4–6
These two kinds of supercapacitors have their unique characteristics and both exhibit excellent performance. However, their respective drawbacks could not be ignored. Therefore, the synthesis of composites to achieve synergy is promising for the development of supercapacitors. Conducting polymers have shown much higher specific capacitance, and moreover they are cost-effective.7–11 Polyaniline (PANI),12–14 polypyrrole,15,16 polythiophene,17 poly(3,4-ethylenedioxythiophene)18 and so forth have been investigated widely. Among the conducting polymers, PANI is well known as one of the most promising classes of active materials for supercapacitors, due to its high electrochemical activity, low cost, easy processing and environmental stability.19–21 Carbon materials such as activated carbon (AC), mesoporous carbon (MC) and carbon nanotubes (CNTs) usually display good stability; however the capacitance values are limited by the microstructures of the materials.22–25 Nevertheless, polyaniline has certain drawbacks such as poor cycling stability, since redox sites of the polymer backbone collapse during charge/discharge cycles, thereby limiting the number of cycles.26–29 Thus, various porous carbon materials have been commonly used as additives for fabricating PANI-based electrodes.30,31
Among the carbon materials, Activated Charcoal (AC) is widely used as an electrode material because of its high surface area, better porosity, good thermal and electrical conductivity, good anti-causticity, high stability, low cost and commercial scale availability.32 Combined with its surprising characteristics from high mechanical and elastic strength, excellent chemical and thermal robustness and distinguished electronic and optical properties, to low weight, low toxicity and low cost,33 blending PANI with carbon materials has been proved to reinforce the stability of PANI as well as to maximize the capacitance.34
A literature survey showed only a few reports on the fabrication of supercapacitors using nanocomposites of PANI with AC. In the present work, transition metal (Ni) nanoparticles have been introduced into a PANI/AC composite in order to improve the performance of the resultant nanocomposite, and also a comparative study on the supercapacitor behavior of PANI, and PANI/AC and PANI/AC/Ni nanocomposites was carried out to analyze the effect of surface area on the specific capacitance of the materials.
2. Experimental
2.1. Materials
Aniline, cetyltrimethylammonium bromide (CTAB), AC and potassium peroxodisulphate (PDS) were purchased from Merck. Nickel sulphate (NiSO4·6H2O) and ethanol were purchased from SRL (India). Carbon black, polyvinylidine difluoride (PVdF), N-methyl-2-pyrrolidone (NMP), nickel foil (0.3 mm thickness) and sodium sulfate (Na2SO4) were obtained from Sigma Aldrich and used as procured for electrode fabrication. All the reagents were of analytical grade and were used without any further purification. Double distilled water was used for all the experiments.
2.2. Preparation of PANI, and PANI/AC and PANI/AC/Ni nanocomposites
2.2.1. Preparation of PANI.
5 mM CTAB solution was prepared in 0.5 M H2SO4. Then, 40 mM aniline solution was added to the CTAB solution and the mixture was stirred for 30 min using a magnetic stirrer while the temperature was maintained below 0 °C. Afterwards, a pre-cooled solution of 50 mM PDS was added dropwise to the aniline solution and stirred for 30 min. The precipitate formed was filtered, washed several times with water and acetone, and then dried.
2.2.2. Preparation of the PANI/AC nanocomposite.
A similar procedure was followed for the preparation of PANI, and at the end of polymerization, 1 g of Activated Charcoal (AC) was added to the solution and stirring was continued for an additional 30 min while the temperature was maintained below 0 °C. The precipitate formed was filtered and washed several times with a water–acetone mixture and then dried.
2.2.3. Preparation of the PANI/AC/Ni nanocomposite.
To the reaction mixture of the PANI/AC nanocomposite, an aqueous solution of 0.5 g NiSO4·6H2O was added under stirring. The precipitate formed was filtered and washed several times with water and acetone. The purified PANI/AC/Ni nanocomposite was dried and used for further studies.
2.3. Characterization techniques
Powder X-ray diffraction patterns of all the freshly prepared PANI, and PANI/AC and PANI/AC/Ni nanocomposite materials were recorded in the 2θ range from 10 to 80° using a PANalytical X-pert PRO diffractometer with Cu-Kα radiation (λ = 0.154060 nm, 40 kV and 30 mA) with a step size of 0.07° s−1. Fourier Transform Infrared (FTIR) spectra of all the samples were recorded in the 4000 to 500 cm−1 range using a ‘Perkin-Elmer RX1’ spectrophotometer with 4 cm−1 resolution for 20 scans. Raman spectra of all the samples were collected in the 2000 to 250 cm−1 range using a ‘Confocal Raman I-11 Model’ spectrophotometer (Nanophoton Corp., Japan) with a 532 nm source from an argon ion laser. The surface morphological images, energy dispersive X-ray (EDX) spectrum and weight percentage of all the prepared samples were recorded by means of a field-emission scanning electron microscope (FE-SEM, Hitachi SU6600) operated at an accelerating voltage of 15 kV.
2.4. Electrochemical studies
The electrochemical investigation of all the freshly prepared electrode materials was carried out in a three-electrode system by using a Princeton Applied Research Potentiostat (Model VSP-1). The three-electrode system was used throughout the study with an aqueous solution of 1 M Na2SO4 as the electrolyte, platinum wire as the counter electrode, Ag/AgCl as the reference electrode and the freshly prepared PANI, and PANI/AC and PANI/AC/Ni nanocomposite electroactive materials as the working electrode, respectively. The working electrode was prepared by mixing 80% active material, 10% acetylene black and 10% polyvinylidene difluoride (PVdF) as a binder in N-methyl pyrrolidone (NMP) solvent. The resulting slurry was coated onto nickel foil using a doctor blade method and dried in a hot air vacuum oven at 80 °C for 12 h. Cyclic voltammetric (CV) measurements were carried out at different scan rates from 5 to 100 mV s−1 in the 0–1 V potential range at room temperature. Similarly, galvanostatic charge/discharge studies were carried out at five different current densities ranging from 1 to 5 A g−1. The specific capacitance of the electrodes was calculated through CV and galvanostatic charge/discharge measurements using eqn (1) and (2), respectively. Electrochemical impedance spectroscopy was also performed for the fabricated electrodes in the frequency range of 0.1 Hz to 100 kHz at 10 V AC voltage.35| |  | (1) |
| |  | (2) |
where ∫idV indicates the integral area of one complete cycle of a CV curve, ΔV the potential window (V), m the mass of the active material (mg), S the scan rate (mV s−1), I (A) the discharge current density and Δt (s) is the discharge time.
3. Results and discussion
3.1. Characterization of the PANI/AC/Ni nanocomposite
3.1.1. XRD pattern analysis.
The X-ray diffraction patterns of bare PANI, PANI/AC and PANI/AC/Ni are shown in Fig. 1. The observed X-ray diffraction pattern of pure polyaniline (PANI) showed two broad and high intensity diffraction peaks at 2θ = 20.4 and 25.3°, which indicated the semicrystalline nature of polyaniline.29,36 The PANI/AC nanocomposite also exhibited two characteristic broad peaks centered at 24.2° and 44.8°, which are commonly observed for nanosized carbon, in agreement with previously reported results.37 Furthermore, the XRD pattern of PANI/AC/Ni exhibited peaks at 26.7°, 43.5° and 78.5° corresponding to Ni nanoparticles present in the composite, in good agreement with the JCPDS card of Ni (JCPDS 01-1260).38 The average crystallite size of the resultant nanocomposite (PANI/AC/Ni) was calculated using the Scherrer formula, D = 0.9λ/β![[thin space (1/6-em)]](https://www.rsc.org/images/entities/char_2009.gif) cosθ, where D is the average crystallite size, λ the wavelength of the X-ray source, β the full-width at half maximum and θ is the angle of the diffracted peak position and it was found to be ≈3 nm.
cosθ, where D is the average crystallite size, λ the wavelength of the X-ray source, β the full-width at half maximum and θ is the angle of the diffracted peak position and it was found to be ≈3 nm.
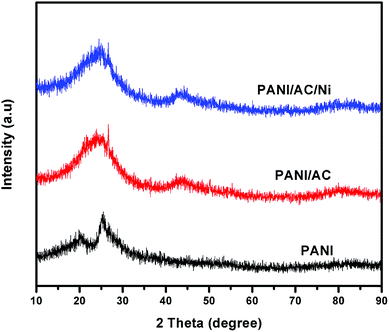 |
| | Fig. 1 XRD patterns of PANI, and PANI/AC and PANI/AC/Ni nanocomposites. | |
3.1.2. FT-IR spectral analysis.
The FTIR spectrum of PANI (Fig. 2) showed absorption peaks corresponding to ν (N–H) = 3336 cm−1, ν (aromatic C–H bond) = 2806 cm−1, ν (quinoid) = 1565 cm−1, ν (benzenoid) = 1482 cm−1, ν (C–N stretching and bending vibrations) = 1298 cm−1 and 1237 cm−1, ν (C–N double bond) = 1113 cm−1 and ν (C–H out of plane bending) = 806 cm−1, which are the characteristic vibrations of PANI, and this result is in agreement with previous reports.39 In the FT-IR spectrum of the PANI/AC material, the peak at 642 cm−1 was assigned to the C–C stretching vibration of AC. The bands observed at 1703 and 2910 cm−1 for the PANI/AC/Ni nanocomposite were due to the C![[double bond, length as m-dash]](https://www.rsc.org/images/entities/char_e001.gif) O stretching vibration and C–H interaction with the surface of the carbon respectively.32 The band at 515 cm−1 was attributed to the Ni–N stretching vibration in the PANI/AC/Ni composite. The intensity of the spectrum decreases upon the addition of AC and AC/Ni. Thus the results indicated the perfect formation of the nanocomposite.40
O stretching vibration and C–H interaction with the surface of the carbon respectively.32 The band at 515 cm−1 was attributed to the Ni–N stretching vibration in the PANI/AC/Ni composite. The intensity of the spectrum decreases upon the addition of AC and AC/Ni. Thus the results indicated the perfect formation of the nanocomposite.40
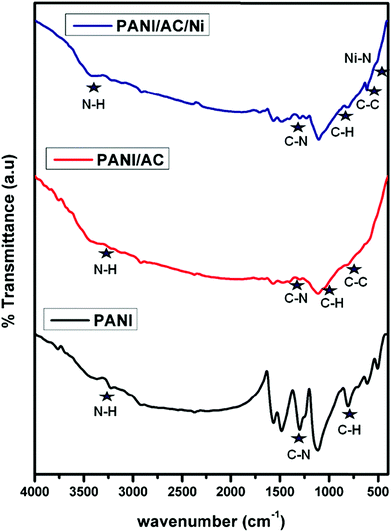 |
| | Fig. 2 FT-IR spectra of PANI, and PANI/AC and PANI/AC/Ni nanocomposites. | |
3.1.3. FT-Raman spectral analysis.
From Fig. 3, it is clear that the typical Raman spectrum of pure PANI showed vibrational bands at 430, 577, 1177 and 1354 cm−1, which are similar to and consistent with the characteristic features of reported polyaniline specimens. The typical bands observed at 430, 577, 1177 and 1354 cm−1 may correspond to phenazene-like segments, out-of-plane C–H deformation of the quinonoid ring, C–H bending deformation of the benzenoid ring and vibration of the semiquinone radicals, respectively. The peaks located at around 1360 and 1580 cm−1 are assigned to the characteristic D (defect and disorder) and G (graphitic) bands of carbon materials, respectively.29,41 The Raman spectrum of the PANI/AC/Ni nanocomposite showed no shift in peak position; however, a significant increase in the D/G intensity ratio was observed, reflecting a weakened sp2 hybridization and a comparatively strengthened sp3-bonded carbon, probably due to hybridization of d orbitals of Ni with carbon π orbitals on the surface of AC.42 The Raman bands at 343 and 439 cm−1 confirmed the incorporation of Ni nanoparticles into the PANI/AC composite.43
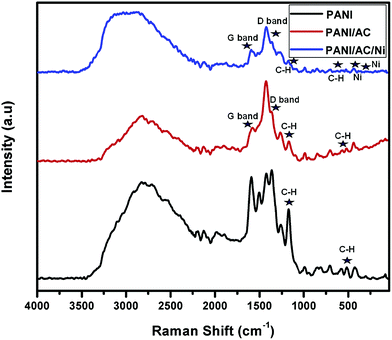 |
| | Fig. 3 Raman spectra of PANI, and PANI/AC and PANI/AC/Ni nanocomposites. | |
3.1.4. BET analysis.
Fig. 4a shows the BET analysis of the synthesized nanomaterials. PANI shows a type 1 isotherm whereas PANI/AC and PANI/AC/Ni nanocomposites show type 4 isotherms. The BET surface area of PANI was found to be 21.9295 m2 g−1 (Table 1), which closely agreed with earlier reports.19,20 After adding AC, the surface area increased to double the initial value. The surface area increased even further when nickel nanoparticles were incorporated into the resultant nanocomposite. Thus an enormous increase of surface area was observed due to the addition of constituents to PANI. Furthermore, the synthesized materials contain mesopores in their structure and the size of the mesopores decreased with an increase in the addition of constituents. This observation is also substantiated by the pore size distribution of the activated carbon as shown in Fig. 4b. The pore volume also exhibited the same trend as the pore size. Hence the increased surface area of the PANI/AC/Ni nanocomposite was considered as the reason for its enhanced specific capacitance value.44
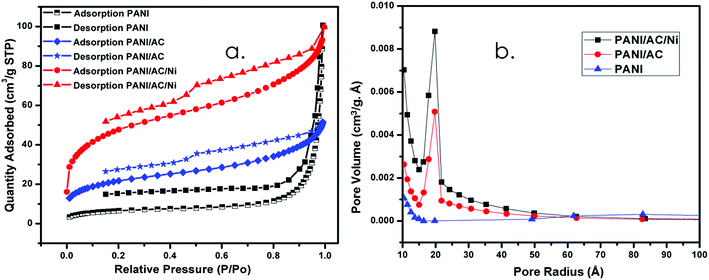 |
| | Fig. 4 (a) BET surface area and (b) pore size distribution curves of PANI, and PANI/AC and PANI/AC/Ni nanocomposites. | |
Table 1 Specific surface area (BET), pore size and pore volume of PANI, and PANI/AC and PANI/AC/Ni nanocomposites
| Sample |
Surface area (m2 g−1) (BET) |
Pore size (nm) |
Pore volume (cm3 g−1) |
| PANI |
21.9295 |
20.4219 |
0.155666 |
| PANI/AC |
78.5863 |
3.0581 |
0.154317 |
| PANI/AC/Ni |
167.0824 |
2.7585 |
0.079626 |
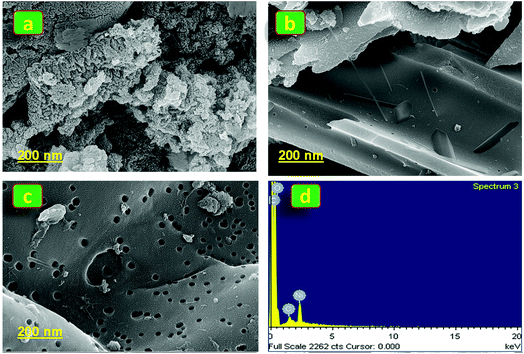
3.1.5. FE-SEM image & EDX analysis.
Fig. 5a–c display the FE-SEM images of PANI, and PANI/AC and PANI/AC/Ni nanocomposites respectively. The SEM image of PANI showed a nanocluster like structure, while PANI/AC exhibited a nanoflake morphology and the PANI/AC/Ni nanocomposite displayed a porous morphology with abundant pores, cavities and randomly distributed flakes. Moreover, the observed porous nature of the PANI/AC/Ni nanocomposite is expected to increase the number of electroactive surface sites for charge and mass transfer processes occurring at the interfaces between the electrode and the electrolyte, which may lead to enhanced and effective penetration of the electrolyte into the PANI/AC/Ni nanocomposite electrode material.29,45 Thus an enhanced specific capacitance was observed for the PANI/AC/Ni nanocomposite compared to that of PANI and PANI/AC nanomaterials. Energy dispersive X-ray spectroscopic (EDX) analysis was carried out to identify the elements present in the synthesized PANI and PANI/AC (Fig. S1(a and b)†), which further confirms the formation of nanomaterials. In addition, the PANI/AC/Ni nanocomposite (Fig. 5d) exhibited C, O and Ni elemental peaks. The ‘O’ peak appeared from the EDX spectrum of AC.32 Tables S1 to S3† list the elemental and atomic percentage of each synthesized nanomaterial.
 |
| | Fig. 5 (a–c) SEM images of PANI, and PANI/AC and PANI/AC/Ni nanocomposites. (d) EDX analysis of the PANI/AC/Ni nanocomposite. | |
3.2. Supercapacitor measurements
3.2.1. Supercapacitor measurements from CV.
The CV curves of pure PANI and nanocomposites PANI/AC and PANI/AC/Ni are shown in Fig. 6a–c. All the observed CV curves of the newly prepared samples were recorded at seven different scan rates from 5 to 100 mV s−1 over the 0–1 V potential range at room temperature. It is obvious that the area under the CV curve for the PANI/AC/Ni nanocomposite is larger than that of the PANI and PANI/AC even at a 5 mV s−1 scan rate. The specific capacitance is proportional to the area, so the PANI/AC/Ni nanocomposite has higher specific capacitance.46 The CV patterns of all the synthesized nanomaterials show an almost rectangular shape, revealing their good capacitive behavior (Fig. 6a–c). This result implies that the ions diffusing from the electrolyte can gain access to almost all sites of the electrode. The value of specific capacitance (Cs) was calculated with respect to the mass of one electrode.47Fig. 6c shows the CV curves of the PANI/AC/Ni nanocomposite at various scan rates from 5 to 100 mV s−1. It can be seen that these CV curves show a symmetrical character, indicating good reversibility among all the synthesized materials (Table 2).
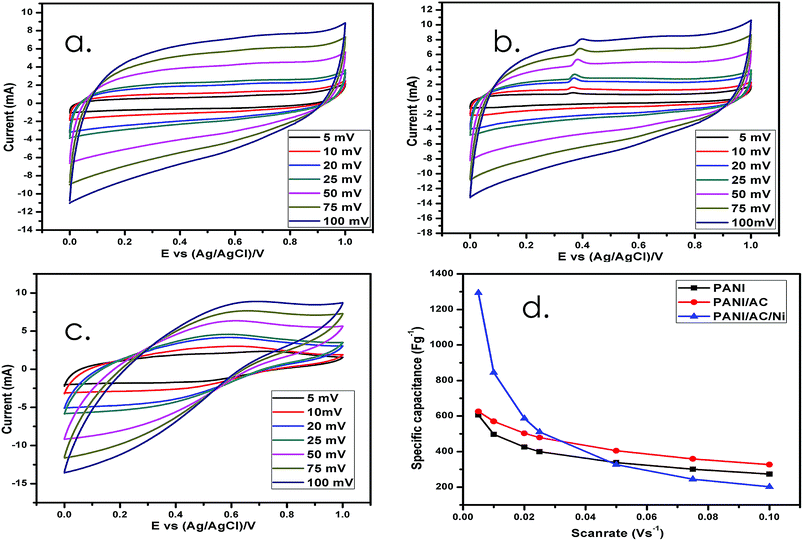 |
| | Fig. 6 (a–c) CV of PANI, and PANI/AC and PANI/AC/Ni nanocomposites. (d) Variation of the specific capacitance of PANI, and PANI/AC and PANI/AC/Ni nanocomposites with scan rate. | |
Table 2 Specific capacitance values for PANI, and PANI/AC and PANI/AC/Ni nanocomposites at various scan rates
| Nanomaterials |
Specific capacitance (F g−1) |
| 5 mV s−1 |
10 mV s−1 |
20 mV s−1 |
25 mV s−1 |
50 mV s−1 |
75 mV s−1 |
100 mV s−1 |
| PANI |
606 |
497 |
426 |
400 |
338 |
301 |
274 |
| PANI/AC |
626 |
570 |
503 |
479 |
405 |
359 |
327 |
| PANI/AC/Ni |
1294 |
845 |
587 |
511 |
327 |
245 |
202 |
It can be concluded that the PANI/AC/Ni nanocomposite displays the highest Cs value (1294 F g−1) at a low scan rate and also withstands higher scan rates. The good capacitive response of PANI/AC/Ni in aqueous 1 M Na2SO4 electrolyte originates from the combination of electrical double layer capacitance (EDLC) and pseudo-capacitance caused by its well-developed pores and large surface area as shown in Table 1.48 The specific capacitance increased with the increase of doping with PANI. Thus the PANI/AC/Ni nanocomposite shows a higher specific capacitance than PANI and PANI/AC because of its high BET surface area with better mesoporosity. Fig. 6d shows the variation of specific capacitance observed with different scan rates. It may be seen that the specific capacitance values of the nanocomposites decreased remarkably with increasing scan rate, because the diffusion effect limits the ion migration in the electrolyte.35
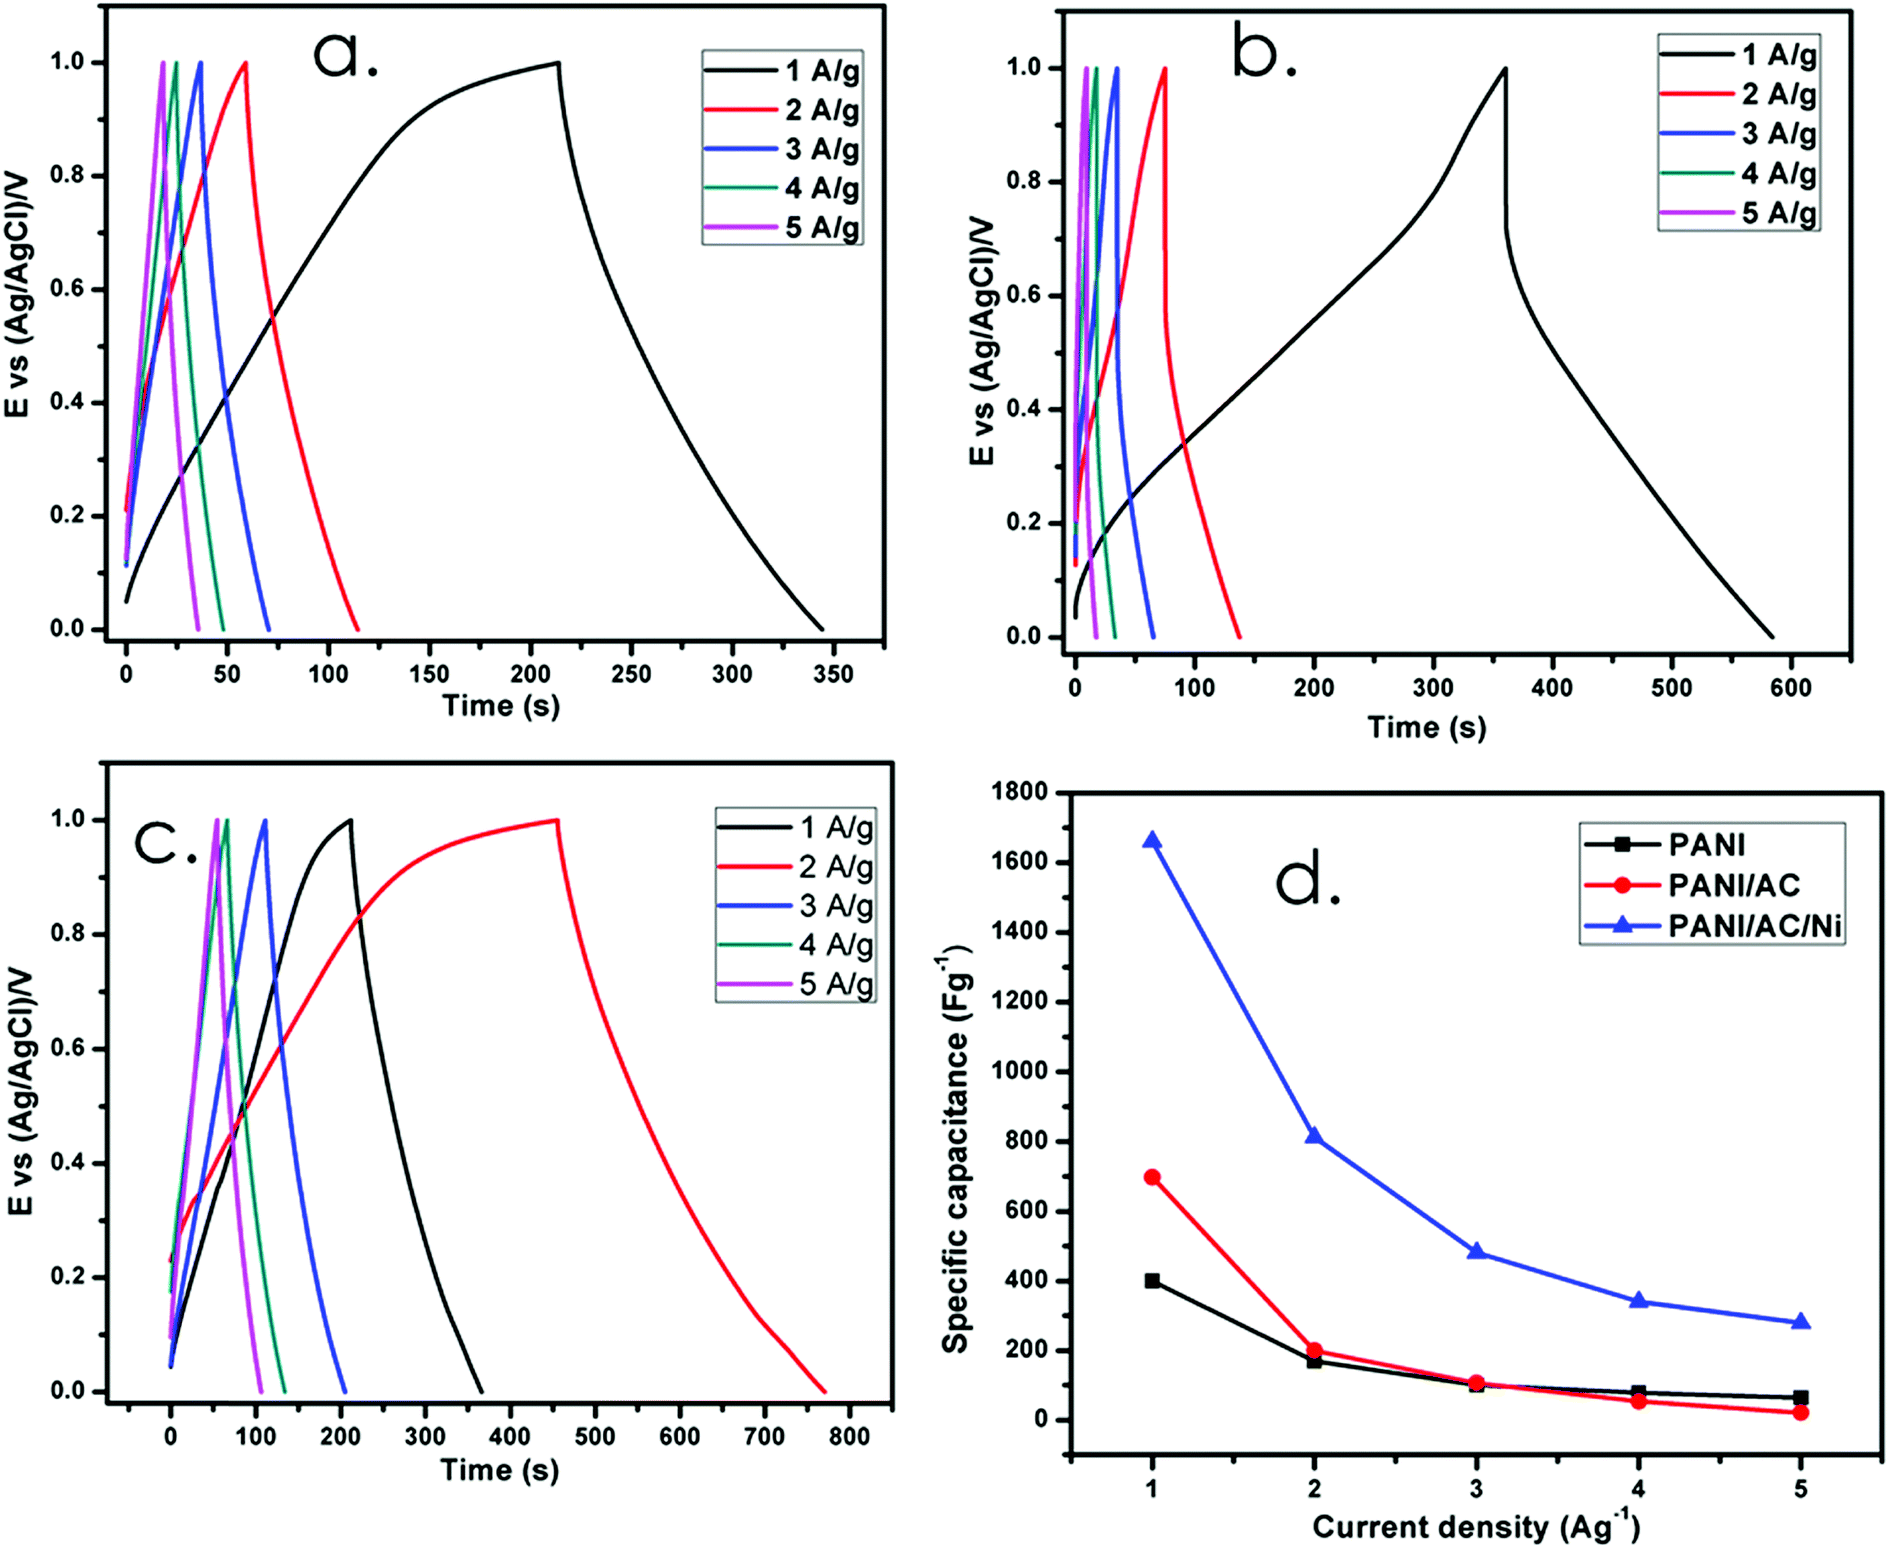
3.2.2. Supercapacitor measurements from a GCD study.
A galvanostatic charge–discharge (GCD) study is the most efficient way to measure the specific capacitance of synthesized PANI based nanomaterials. The GCD curves of the synthesized nanomaterials at different current densities (1 to 5 A g−1) are shown in Fig. 7a–c and the values are reported in Table 3. In Fig. 7b, a small resistance drop (IR drop) was observed between 1 and 0.7 V which is initiated by the Equivalent Series Resistance (ESR), which includes electrode resistance, electrolyte resistance and contact resistance between the electrode and the electrolyte. The IR drop was found to be 0.3 V.35
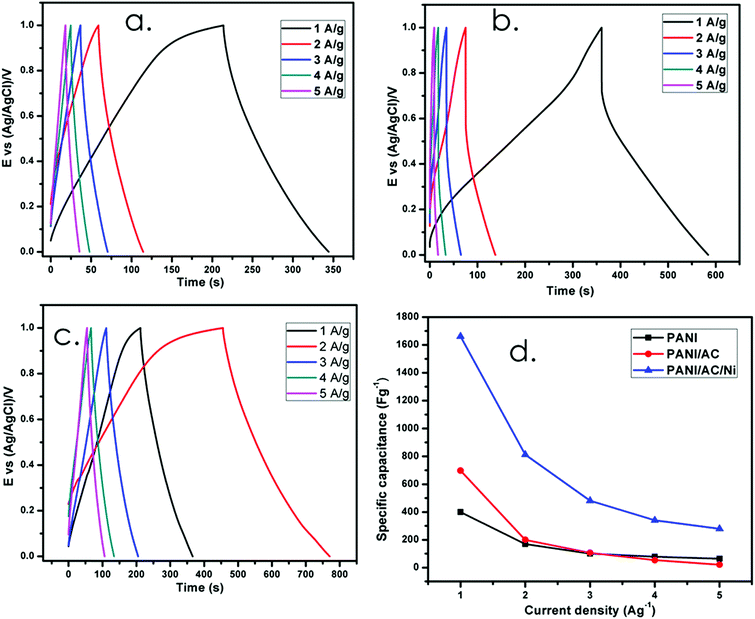 |
| | Fig. 7 (a–c) Charge–discharge studies and (d) variation of specific capacitance of PANI, and PANI/AC and PANI/AC/Ni nanocomposites with current density. | |
Table 3 Specific capacitance values of PANI, and PANI/AC and PANI/AC/Ni nanocomposites at various current densities
| Nanomaterials |
Specific capacitance (F g−1) |
| 1 A g−1 |
2 A g−1 |
3 A g−1 |
4 A g−1 |
5 A g−1 |
| PANI |
400 |
169 |
100 |
78 |
63 |
| PANI/AC |
698 |
200 |
106 |
53 |
21 |
| PANI/AC/Ni |
1661 |
812 |
481 |
341 |
279 |
From Table 3, the specific capacitance of PANI (400 F g−1) and PANI/AC (698 F g−1) was observed to be much lower than that of the PANI/AC/Ni nanocomposite electrode (1661 F g−1) at 1 A g−1 current density. The greatly enhanced capacitance of the PANI/AC/Ni composite is probably due to the synergistic effect between the three components,31 which supports the fact that the special nanostructure of the PANI/AC/Ni nanocomposite with a larger surface area will provide effective diffusion channels for the electrolyte ions. Simultaneously, for the PANI/AC/Ni nanocomposite, the active species exposed to the electrolyte during the charge–discharge processes are increased.46 Therefore, it is believed that the PANI/AC/Ni nanocomposite is more suitable for the fabrication of supercapacitor electrodes compared to pure PANI and PANI/AC nanomaterials.49Fig. 7d shows that the specific capacitance values decreased with increasing current density, thereby exhibiting the same trend as that observed in the case of CV analysis. The above results show that the electrochemical performance of the PANI/AC/Ni nanocomposite in terms of specific capacitance is better than that of the materials reported in the literature.50–54
3.2.3. Supercapacitor measurements from EIS.
The Nyquist plots of the EIS for PANI, and PANI/AC and PANI/AC/Ni nanocomposites are shown in Fig. 8. The semicircle in the high frequency region is related to the charge transfer resistance between the electrode surface and the electrolyte. The solution resistance can be calculated from extrapolation of the curve at the real part, Z′, in the high frequency region. In general, the Equivalent Series Resistance (ESR) can be found by combining the ionic resistance of the electrolyte, intrinsic resistance of the active material and contact resistance between the electrode and the current collector.55,56 The slope obtained at low frequency is called the Warburg impedance (W), which is caused by ion diffusion from the electrolyte to the electrode surface.35,57 As seen from Table 4, the PANI/AC/Ni nanocomposite exhibited the smallest ESR value of 2.4 Ω, which enables the penetration of the electrolyte into the active electrode and significantly enhances the interface between the electrode and the electrolyte. In addition, the depressed semicircular portion in the high frequency region for the PANI/AC/Ni nanocomposite shows that it has high conductivity, and in the low frequency region, the observation of a curve with the slope shifting from 45 to 90° is ascribed to ion diffusion within the PANI/AC/Ni nanocomposite. Meanwhile, the line in the low frequency region of the composite is more vertical compared with PANI and PANI/AC, indicating more ideal capacitive behavior.46
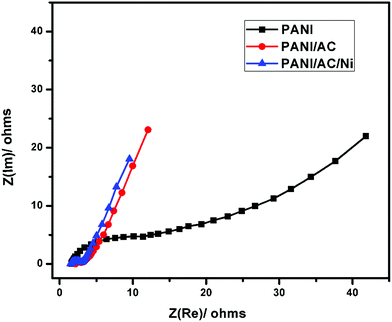 |
| | Fig. 8 Nyquist plots for PANI, and PANI/AC and PANI/AC/Ni nanocomposites. | |
Table 4
R
ct, Rs and ESR values for PANI, and PANI/AC and PANI/AC/Ni nanocomposites
| Nanomaterials |
R
ct (Ω) |
R
s (Ω) |
ESR (Ω) |
| PANI |
1.5 |
10.0 |
11.5 |
| PANI/AC |
2.15 |
1.44 |
3.59 |
| PANI/AC/Ni |
1.51 |
0.89 |
2.4 |
Thus the CV, GCD, and EIS measurements of PANI, and PANI/AC and PANI/AC/Ni nanocomposites revealed that the PANI/AC/Ni nanocomposite based electrode material exhibited excellent supercapacitor behavior.
3.3. Stability measurements
The stability of PANI, and PANI/AC and PANI/AC/Ni nanocomposites is examined at a current density of 4 A g−1 over 2000 GCD cycles (Fig. 9). The PANI/AC/Ni, PANI/AC and PANI materials still retain 93%, 81% and 73% of their initial capacitance, respectively. The better stability of PANI/AC/Ni is attributed to the fact that Ni nanoparticles growing on the PANI/AC nanocomposite provide a high surface area interface between the active materials and the electrolyte. In addition, the AC/Ni component in the composite is helpful for stabilizing the structure of PANI, which could inhibit the structural damage resulting from the continuous intercalation/de-intercalation of electrolyte ions during the charge–discharge process.46
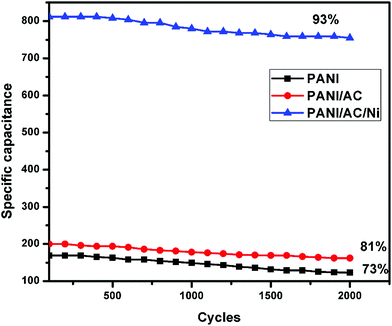 |
| | Fig. 9 Specific capacitance retention of PANI, and PANI/AC and PANI/AC/Ni nanocomposites. | |
4. Conclusion
A simple wet chemical route followed by an in situ preparation method has been employed for the synthesis of PANI, and PANI/AC and PANI/AC/Ni nanocomposites. Polyaniline could be successfully doped with AC and AC/Ni nanomaterials, which was confirmed by physico-chemical characterization via XRD, FT-IR, confocal Raman spectroscopy, and FE-SEM studies. The PANI/AC/Ni nanocomposite electrode exhibited a high capacitance of 1294 F g−1 at a scan rate of 5 mV s−1 in aqueous 1 M Na2SO4 electrolyte in CV studies and 1661 F g−1 at 1 A g−1 current density in GCD measurements. Such enhanced electrochemical performance was attributed to the high surface area and mesoporous nature of the PANI/AC/Ni composite. Remarkably, a small amount of capacitance loss was observed for the PANI/AC/Ni nanocomposite electrode and it showed a specific capacitance retention of 93% after 2000 GCD cycles. These findings suggest that the PANI/AC/Ni nanocomposite electrode is a promising candidate for electrochemical supercapacitor applications compared to PANI and the PANI/AC nanocomposite.
Conflicts of interest
There are no conflicts to declare.
Acknowledgements
The authors thank the Management of Bishop Heber College (Autonomous), Tiruchirappalli-620 017, Tamil Nadu, India for the support and facilities provided through the DST-FIST Instrumentation Centre at Bishop Heber College.
References
- L. Ma, S. Linjie, Z. Jian, Z. Dongyu, Q. Chuanli, J. Zheng and Z. Kai, J. Electroanal. Chem., 2016, 777, 75–84 CrossRef CAS
 .
.
- H. Wang, L. Jianyi and S. Ze Xiang, Journal of Science: Advanced Materials and Devices, 2016, 1, 225–255 CrossRef .
- R. Boddula and P. Srinivasan, New J. Chem., 2015, 39, 5382–5388 RSC .
- A. Eftekhari, L. Lei and Y. Yang, J. Power Sources, 2017, 347, 86–107 CrossRef CAS .
- Q. Wenjing, S. Fengxia, X. Yanhui, Q. Lihua, L. Changhai, W. Suidong and Y. Feng, Energy Environ. Sci., 2014, 7, 379–386 Search PubMed .
- U. Patil, L. Su Chan, K. Sachin, S. Ji Soo, N. Min Sik, H. Suhyun and J. Seong, Nanoscale, 2015, 7, 6999–7021 RSC .
- J. Li, X. Huaqing, L. Yang Li and W. Jifen, J. Nanosci. Nanotechnol., 2013, 13, 1132–1135 CrossRef CAS PubMed .
- S. K. Simotwo, C. DelRe and V. Kalra, ACS Appl. Mater. Interfaces, 2016, 8, 21261–21269 CAS .
- M. A. Bavio, G. G. Acosta, T. Kessler and A. Visintin, Energy, 2017, 130, 22–28 CrossRef CAS .
- L. M. Kyung, K. Minjae, L. Eunsoo, B. Sung Hyeon and S. Sang Eun, Electrochim. Acta, 2016, 213, 124–131 CrossRef .
- S. K. Silas and K. Vibha, Curr. Opin. Chem. Eng., 2016, 13, 150–160 CrossRef .
- X. Wu and L. Meng, J. Power Sources, 2017, 362, 184–191 CrossRef CAS .
- H. Li, J. Song, L. Wang, X. Feng, R. Liu, W. Zeng, Z. Huang, Y. Ma and L. Wang, Nanoscale, 2017, 9, 193–200 RSC .
- X. Feng, N. Chen, J. Zhou, Y. Li, Z. Huang, L. Zhang, Y. Ma, L. Wang and X. Yan, New J. Chem., 2015, 39, 2261–2268 RSC .
- A. Afzal, A. Abuilaiwi, H. Amir Habib, M. Awais, W. Samaila and A. Muataz, J. Power Sources, 2017, 352, 174–186 CrossRef CAS .
- C. Fu, Z. Haihui, L. Rui, H. Zhongyuan, C. Jinhua and K. Yafei, Mater. Chem. Phys., 2012, 132, 596–600 CrossRef CAS .
- H. Zhou, L. Gengling, L. Jinliang, W. Yilin, A. Qingyun, H. Jun, Y. Zhongyi, T. Licheng and C. Yiwang, Electrochim. Acta, 2017, 247, 871–879 CrossRef CAS .
- D. S. Rahul, J. Dattatray and B. Kale, RSC Adv., 2014, 4, 22551–22560 RSC .
- N. Parveen, M. O. Ansari and M. H. Cho, Ind. Eng. Chem. Res., 2015, 55, 116–124 CrossRef .
- M. Ayad and S. Zaghlol, Chem. Eng. J., 2012, 204, 79–86 CrossRef .
- Y. Huang, Z. Yang, G. Qianming, W. Mouyi, B. Junfei, L. Xi and J. Yanqi, Electrochim. Acta, 2017, 228, 214–225 CrossRef CAS .
- S. Bose, K. Tapas, M. Ananta Kumar, R. Rajasekar, K. Nam Hoon and L. Joong Hee, J. Mater. Chem., 2012, 22, 767–784 RSC .
- H. Mi, Z. Xiaogang, Y. Sudong, Y. Xiangguo and L. Jianming, Mater. Chem. Phys., 2008, 112, 127–131 CrossRef CAS .
- X. Feng, J. Zhou, L. Wang, Y. Li, Z. Huang, S. Chen, Y. Ma, L. Wang and X. Yan, New J. Chem., 2015, 39, 4026–4034 RSC .
- J. Zhou, J. Song, H. Li, X. Feng, Z. Huang, S. Chen, Y. Ma, L. Wang and X. Yan, New J. Chem., 2015, 39, 8780–8786 RSC .
- G. Xin, W. Yanhui, J. Shaopei, T. Pengfei, Z. Shuyu and Z. Jianbing, Appl. Surf. Sci., 2017, 422, 654–660 CrossRef CAS .
- L. Bian, L. Feng, L. Sha-Sha and L. Xiao-Xia, Electrochim. Acta, 2012, 64, 17–22 CrossRef CAS .
- J. Huang, W. Lan, L. Yu-Jie, W. Hai-Bo, L. Yan-Ming and W. Ling-Ling, Electrochim. Acta, 2013, 109, 587–594 CrossRef .
- J. Yesuraj, E. Elumalai, B. Muthuraaman, S. Austin Suthanthiraraj, E. Elanthamilan and J. Princy Merlin, J. Electroanal. Chem., 2017, 797, 78–88 CrossRef .
- L. Li, S. Huaihe, Z. Qincang, Y. Jingyuan and C. Xiaohong, J. Power Sources, 2009, 187, 268–274 CrossRef CAS .
- J. Li, X. Huaqing, L. Yang and W. Jifen, J. Nanosci. Nanotechnol., 2013, 13, 1132–1135 CrossRef CAS PubMed .
- M. Sivachidambaram, J. Judith Vijaya, L. John Kennedy, R. Jothiramalingam, A. Hamad, A. Murugan, E. Elanthamilan and J. Princy Merlin, New J. Chem., 2017, 41, 3939–3949 RSC .
- W. Liu, S. Tian-Jun, H. Jiang-Liang and W. Shu-Dong, J. Mater. Chem. A, 2016, 4, 3584–3616 Search PubMed .
- G. A. Nozad, M. Bagherzadeh and Z. Shirazi, Electrochim. Acta, 2017, 247, 116–124 CrossRef .
- E. Elanthamilan, L. Sarala, A. Bella, A. Sathiyan, I. Sharmila Lydia and J. Princy Merlin, Electrochim. Acta, 2017, 251, 32–42 CrossRef CAS .
- A. Mostafaei and Z. Ashkan, Prog. Nat. Sci.: Mater. Int., 2012, 22, 273–280 CrossRef .
- R. Karim, L. Chul Jae and L. Mu Sang, J. Appl. Polym. Sci., 2007, 103, 1973–1977 CrossRef .
- S. Chandra, K. Avdhesh and T. Praveen Kumar, J. Saudi Chem. Soc., 2014, 18, 437–442 CrossRef CAS .
- M. Govindasamy, C. Shen-Ming, M. Veerappan, A. Sathiyan, J. Princy Merlin, H. Fahad and M. Ajmal, RSC Adv., 2016, 6, 100605–100613 RSC .
- N. Barakat, M. Suleiman, A. S. Aldwayyan, B. Hammouti, T. B. Hadda, S. F. Haddad, A. Boshaala and I. Warad, Int. J. Mol. Sci., 2013, 14, 23941–23954 CrossRef PubMed .
- F. Qin, Z. Kai, L. Jie, L. Yanqing, L. Hai, L. Wenwen, Y. Fan, L. Xiaoke and F. Jing, J. Solid State Electrochem., 2016, 20, 469–477 CrossRef CAS .
- C. Zhou, A. Szpunar and C. Xiaoyu, ACS Appl. Mater. Interfaces, 2016, 8, 15232–15241 CAS .
- Z. Ji, W. Yuqin, Y. Qiang, S. Xiaoping, L. Na, M. Hanyu, Y. Juan and W. Jiheng, J. Colloid Interface Sci., 2017, 506, 678–684 CrossRef CAS PubMed .
- J. Xu, Y. Chao, X. Yufei, W. Cheng, C. Jianyu and C. Zhidong, Electrochim. Acta, 2016, 211, 595–602 CrossRef CAS .
- G. Zhang, L. Wenfang, X. Keyu, Y. Fei and H. Haitao, Adv. Funct. Mater., 2013, 23, 3675–3681 CrossRef CAS .
- T. Liu, S. Guangjie, J. Mingtong and W. Guiling, Polym. Compos., 2015, 36, 113–120 CrossRef CAS .
- X. Wei, W. Suige, J. Xiaoqiang, W. Zhe and G. Shuyan, ACS Appl. Mater. Interfaces, 2015, 7, 22238–22245 CAS .
- M. Tran and J. Hae Kyung, Electrochim. Acta, 2015, 180, 679–686 CrossRef CAS .
- Z. Fan, Y. Jun, W. Tong, Z. Linjie, N. Guoqing, L. Tianyou and W. Fei, Adv. Funct. Mater., 2011, 21, 2366–2375 CrossRef CAS .
- P. Wang, X. Du, X. An, S. Li, F. Gao, X. Hao and G. Guan, Synth. Met., 2017, 232, 87–95 CrossRef CAS .
- Y. M. Shulga, S. A. Baskakov, V. A. Smirnov, N. Y. Shulga, K. G. Belay and G. L. Gutsev, J. Power Sources, 2014, 245, 33–36 CrossRef CAS .
- H. Wang, D. Liu, P. Du, W. Wei, Q. Wang and P. Liu, J. Colloid Interface Sci., 2017, 506, 572–581 CrossRef CAS PubMed .
- X. He, G. Liu, B. Yan, H. Suo and C. Zhao, Eur. Polym. J., 2016, 83, 53–59 CrossRef CAS .
- X. L. Song, J. X. Guo, M. X. Guo, D. Z. Jia, Z. P. Sun and L. X. Wang, Electrochim. Acta, 2016, 206, 337–345 CrossRef CAS .
- M. Zhi, C. Xiang, J. Li, M. Li and N. Wu, Nanoscale, 2013, 5, 72–88 RSC .
- Y. Ren, X. Qun, Z. Jianmin, Y. Hongxia, W. Bo, Y. Daoyuan, H. Junhua and L. Zhimin, ACS Appl. Mater. Interfaces, 2014, 6, 9689–9697 CAS .
- A. Fischer, B. Kim, X. Yang, K. Nam and K. Kim, J. Phys. Chem. C, 2014, 118, 2834–2843 Search PubMed .
Footnote |
| † Electronic supplementary information (ESI) available. See DOI: 10.1039/c7se00490g |
|
| This journal is © The Royal Society of Chemistry 2018 |

 *a
*a