Mechanical activation in reduced graphite oxide/boron nitride nanocomposite electrocatalysts for significant improvement in dioxygen reduction†
Received
19th September 2017
, Accepted 2nd November 2017
First published on 2nd November 2017
Abstract
A nanocomposite of reduced graphite oxide (rGO) with hexagonal boron nitride (h-BN) is prepared using a simple hydrothermal method. Significant enhancement in the surface area of the composite is mainly due to the pre-mechanical activation of pristine GO. The structural and morphological study reveals the formation of a homogeneous nanocomposite and masking of rGO sheets over micron sized h-BN particles respectively. Interestingly, the as-synthesized GOBN2–BM composite (nanocomposite of 2 wt% h-BN with mechanically activated GO) catalyst exhibits significant oxygen electroreduction kinetics in terms of onset potential (Eonset = 0.89 V), half-wave potential (E1/2 = 0.74 V) and limiting current density (JL = 4.4 mA cm−2) with a single step ∼4-electron transfer pathway in alkaline medium. Though the composite catalysts exhibit higher overpotential (110 mV) than state-of-the-art Pt/C catalysts, they are much superior to previously reported carbon or h-BN based nanocomposite electrocatalysts. Importantly, the GOBN2–BM nanocomposite shows excellent tolerance towards both methanol oxidation and CO poisoning. Moreover, the nanocomposite catalysts show substantially higher stability than Pt/C catalysts even after 5000 cycles under similar conditions. Additionally, they show a better relative current stability (95% retention) than that of a Pt/C catalyst, signifying immense selectivity and durability towards oxygen electroreduction kinetics. The electrocatalytic oxygen reduction activity of the nanocomposite is mainly attributed to the high surface area (thanks to mechanical activation of GO, leading to increased pore distribution) as well as the synergistic mechanism between the h-BN and carbon network of rGO. Hence, it could be a potential cathode catalyst to replace precious-metal based catalysts in alkaline fuel cells.
Introduction
Low-temperature fuel cells such as polymer electrolyte membrane fuel cells (PEMFCs) and alkaline fuel cells (AFCs) have attracted great attention due to their higher efficiency than diesel or gas engines in renewable energy technology. Nevertheless, the design of highly active and cost-effective cathode catalysts without sacrificing the durability of the electrocatalyst remains a challenge to meet industrial requirements.1,2 Usually, platinum (Pt) or Pt-based alloy catalysts were used for more sluggish cathodic oxygen reduction reaction (ORR) kinetics due to their lower overpotential.3 However, their prohibitive cost, scarcity, deactivation by CO and poor stability under operating conditions of Pt-based catalysts are few noticeable obstacles for widespread commercialization of fuel cell technologies.3–6 Consequently, global research has been focused on the discovering cheaper non-noble metal or metal-free carbon-based materials and their composites as a cathode catalyst for the ORR.7–14 Among variously categorized catalyst materials, heteroatom (–N, –B, –S, –P etc.) doped carbon materials (graphene, graphite oxide, carbon nanotubes etc.) have shown a significant impact on catalytic activities, due to electronic or structural distortion and modify atomic compositions of the catalysts in resultant nanomaterials.15–20 More interestingly, such carbon materials co-doped with nitrogen (N) and boron (B) exhibit good performance for the ORR, due to the reduction of energy barriers, the formation of B–N clusters or the synergistic effect.7,21–25 On the other hand, 2D-hexagonal boron nitride (h-BN), a structural analogue of graphene has also been emerging in various catalytic fields due to the distinct properties of h-BN.26 Generally, h-BN has traditionally been considered as an inert material due to the wide band gap (ca. 5–6 eV), and thus one would not expect h-BN to be a potential material for electroreduction of oxygen.27,28 Nevertheless, based on DFT studies, Lyalin et al. suggested that catalytically inactive or inert materials can be made active upon functionalization or exfoliation of such materials at the nanoscale level via size, structure, morphology and support effects.29 Moreover, recently we have shown excellent electrocatalytic activity like the ORR and the OER using the nanocomposites of h-BN.11,12 Still, very few experimental reports on the electrocatalytic activities of h-BN based materials are available.11,12,30–34 However, the overall electrocatalytic activity of metal induced or metal-free h-BN based catalysts for the ORR is far away from satisfaction. Therefore, systematic design of h-BN based non-noble metal or metal-free electrocatalysts that are comparable or superior to commercial Pt/C still remains a challenge. Hence, recognizing the promising demand to develop a significant catalyst for the ORR, a metal-free electrocatalyst based on rGO and h-BN nanocomposites has been designed for enhancing the kinetics of cathode catalysts and further to minimize the cost of fuel cell technology.
In the present study, we report a single-step hydrothermal preparation of reduced graphite oxide/boron nitride (GOBN–BM) nanocomposite catalysts. Most importantly, mechanical activation of GO before composite formation render an additional benefit of exposing more catalytic sites on the composite due to the higher surface area. The morphological evidence shows the partial shielding of h-BN particles inside the graphite oxide matrix, providing an ideal situation for more oxygen adsorption followed by electroreduction. The optimized composite catalyst (GOBN2–BM) exhibits significant ORR kinetics with great selectivity and stability. Although the electrocatalytic properties are slightly inferior to those of a commercial Pt/C catalyst, nevertheless the catalytic activities of the as-prepared composite catalyst are much better than those of previously reported metal or metal-free h-BN based cathode catalysts with respect to the onset potential for the ORR.11,12,30–34
Experimental
Materials and methods
Hexagonal boron nitride (h-BN; particle size = 1 μm), graphite powder (particle size < 45 μm and purity ≥ 99%) and potassium hydroxide pellets (KOH) were used as received from Sigma-Aldrich. All other chemicals such as sulphuric acid (H2SO4), sodium nitrate (NaNO3) and potassium permanganate (KMnO4) were procured from Rankem chemicals, India and used as received, and hydrogen peroxide (H2O2) was obtained from Fisher Scientific. Commercial Pt/C catalysts (20 wt% of Pt on a carbon support) were purchased from Fuel Cell Technologies Inc. Millipore water (18.2 MΩ resistivity) was used for all the experiments.
Preparation of three-dimensional nanocomposites of GOBN–BM
(a) Mechanical activation in graphite oxide through ball milling.
Graphite oxide (GO) was synthesized from graphite flakes using a modified Hummers' method.35 The crystallite size of GO was reduced by mechanical activation of GO using ball milling (horizontal planetary mill FRITSCH Pulverisette 6). Briefly, 1 g of the as-prepared GO powder was mixed with toluene and loaded into a grinding bowl with a ball-to-powder ratio of 10![[thin space (1/6-em)]](https://www.rsc.org/images/entities/char_2009.gif) :1. The rotational speed of the planetary ball mill was fixed at 350 rpm throughout the ball milling process (24 h). Such mechanically activated GO was denoted as GO–BM.
:1. The rotational speed of the planetary ball mill was fixed at 350 rpm throughout the ball milling process (24 h). Such mechanically activated GO was denoted as GO–BM.
(b) Preparation of GOBN–BM.
The nanocomposites of reduced graphite oxide/boron nitride (GOBN–BM) were obtained through a single-step hydrothermal method. In brief, 196 mg of GO–BM and 4 mg of h-BN powder were mixed together in 50 mL de-ionized water, the resulting solution was ultrasonicated (40 kHz) for 30 min to obtain a homogeneous mixture. Then, the mixture was transferred into a 100 mL teflon-lined autoclave and heated at 180 °C for 6 h. Finally, the obtained product was collected by centrifugation and denoted as GOBN2–BM. For comparison purpose, GOBN–BM composites were prepared with different h-BN wt% ratios viz. 1 wt%, 3 wt%, 5 wt% and 10 wt% and were denoted as GOBN1–BM, GOBN3–BM, GOBN5–BM, and GOBN10–BM respectively. To study the effect of pre-mechanical activation on GO for electrocatalytic activity, a nanocomposite of GOBN2 (here GO was used without mechanical activation) was prepared by a similar method. The schematic representation of the formation of GOBN–BM nanocomposites is illustrated in Scheme 1.
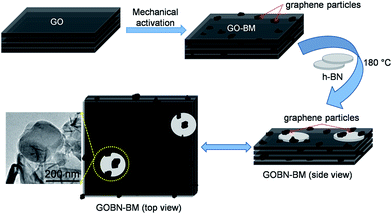 |
| | Scheme 1 Schematic representation of the formation of the GOBN–BM nanocomposite through the mechanical activation of GO, showing several changes in the structural morphology including healing of defects, which are created during GO synthesis, formation of defects due to mechanical delamination of GO and formation of smaller analogues of graphene again thanks to mechanical treatment; thus, furnishing structural synergy for improved ORR kinetics. | |
Physical characterizations
X-ray powder diffraction (XRD) was used for the structural analysis of composite materials. XRD studies were performed on a X'pert pro diffractometer, PANalytical using Cu Kα radiation (λ = 1.5406 Å, 40 kV, 40 mA) in the 2θ range of 5–100° at a scan rate of 2° min−1. The morphology of the prepared nanocomposite was investigated by using scanning electron microscopy (SEM) on a Quanta 200 FEG FE-SEM and transmission electron microscopy (TEM) on a JEOL-1010 transmission electron microscope operated at an acceleration voltage of 100 kV respectively. Whereas, high angle annular dark field-scanning transmission electron microscopy (HAADF-STEM) and elemental analysis mapping were conducted on a FEI make Tecnai TEM T-20 operating at 200 kV with a LaB6 filament fitted with a Gatan Digital camera (bottom mount) with a resolution of 2k × 2k. The specific surface area of the sample was calculated by the Brunauer–Emmet–Teller (BET) method using a Quantachrome Nova-1000 surface analyzer, whereas, the pore size distribution was determined from the adsorption branches of isotherms through the Barrett–Joyner–Halenda (BJH) method. X-ray photoelectron spectroscopy (XPS) measurements were done with a Thermo K-5 Alpha XPS instrument. All individual spectra were deconvoluted and fitted using a Shirley type background function.
Electrochemical measurements
The electrochemical properties of catalysts were studied in a conventional 3-electrode set up using glassy carbon (GC), platinum (Pt) wire and Ag/AgCl (sat. KCl) electrodes as the working, auxiliary and reference electrode respectively on a CHI 760E bi-potentiostat (CH Instruments, Inc., USA); for rotating ring disc electrode (RRDE) measurements, an RRDE-3A (ALS Co., Ltd) system controller was used. All the measured potentials were converted to the reversible hydrogen electrode (RHE) scale using the equation, E(RHE) = E(Ag/AgCl) + 0.998 V.36 All of the electrochemical measurements were carried out in a 0.1 M aqueous KOH solution at room temperature. In order to coat a thin layer of catalyst on the GC electrode, 6.0 mg of catalyst was suspended in a mixture of 3 mL of 24% isopropyl alcohol (IPA) solution and 20 μL of Nafion (5 wt%, Sigma-Aldrich). A homogeneous catalyst slurry was obtained, after ultrasonicating the above mixture for 45 min in an ice-cold bath. Then, 5 μL of this catalyst ink was deposited on a pre-cleaned glassy carbon RDE surface (3 mm in diameter; having a geometric surface area of 0.0707 cm2). The electrode was dried at room temperature. The total catalyst loading on the GC electrode was 0.14 mg cm−2 for all electrochemical studies. For comparison, a Pt/C (20 wt%) electrode was also prepared using a similar method with an actual Pt-loading of 22.6 μg cm−2. Prior to electrochemical measurements, N2 or O2 gas was bubbled for at least 30 min to ensure the saturation. At last, the catalytic stability of GOBN–BM composites and the Pt/C catalyst were studied by scanning the working electrode between −0.4 and 0.0 V vs. Ag/AgCl (using a standard protocol of triangular potential vs. the time curve with 16 s for a single cycle) at the scan rate 50 mV s−1 up to 5000 durability cycles in 0.1 M KOH electrolyte solution.
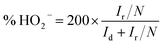
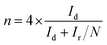
For the RRDE measurements, catalyst inks and electrodes were prepared similar to that of RDE measurements with only the difference of the amount of ink drop-coated on the disk electrode (10 μL on a 4 mm diameter of GC). The disk electrode was scanned at a rate of 10 mV s−1 and the ring potential was kept constant at 0.5 V vs. Ag/AgCl. The extent of peroxide (HO2−) production and number of electrons transferred (n) were calculated by using eqn (1) and (2) respectively:
| |  | (1) |
| |  | (2) |
where
Id is the disk current,
Ir is the ring current and
N = 0.38 is current collection efficiency of the Pt ring.
12
Results and discussion
The superimposed powder XRD patterns of bare GO, h-BN and GOBN2–BM composites are shown in Fig. 1. As evident from the figure, the pristine GO shows the most intense peak at 2θ = 11.5°, corresponding to the (002) reflection with an increased interlayer spacing (0.77 nm) than pristine graphite powder (0.34 nm) due to the introduction of a large amount of oxygen-containing functional groups on graphitic sheets.11,37 The most intense graphitic peak corresponding to the (002) plane around 2θ = 26.7° was observed for all carbon-based materials. Whereas, a broad diffraction peak observed around 2θ = 25° is due to the (002) crystal plane of reduced graphite oxide (rGO).38 Additionally, the bare h-BN shows distinct XRD peaks at 26.74° (graphitic), 41.58°, 43.87°, 50.3°, 55.16°, 75.93° and 82.17° corresponding to the (002), (100), (101), (102), (004), (110) and (112) crystallographic planes respectively. Therefore, after comparison of the most intense peak of GOBN2–BM with those of pristine GO and bare h-BN, it is evident that a homogeneous GOBN–BM nanocomposite is formed. Also, the defect peak (101) observed at around 2θ = 43° has been unaltered even after composite formation. The smaller crystallite size causes obvious broadening of the XRD peak and the intensity of the peak gives a rough idea about the crystallinity of the sample. Interestingly, the dhkl-spacing and crystallite size of pristine GO was decreased on mechanical activation by ball milling (i.e., the GO–BM sample), and thus, increasing the crystallinity and the surface area of both GO–BM and GOBN2–BM samples (as clearly seen in the inset of Fig. 1 and Table 1). It is also noteworthy that the XRD patterns of both GO and GO–BM are similar, except the peak broadening in the latter case. Furthermore, a small shift in 2θ values (from 11.5° to 12°) has been observed for the most intense graphitic peak (002) in the case of the GO–BM sample. The details of crystallite size calculations are given in the ESI.†
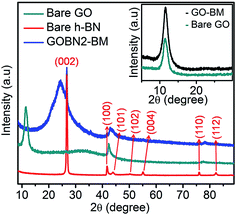 |
| | Fig. 1 Comparative powder XRD pattern of the bare GO, bare h-BN and GOBN2–BM nanocomposite catalysts; inset showing the difference in peak broadening of the (002) plane of bare GO and, GO after ball milling (GO–BM), clearly shows the decrease of the crystallite size after mechanical activations of GO. | |
Table 1
d
hkl
-Spacing, crystallite size, BET surface area, average pore size and total pore volume distribution
| Sample |
d
hkl
-Spacing (nm) |
Crystallite size (nm) |
S
BET (m2 g−1) |
Average pore size (nm) |
Total pore volume (cm3 g−1) |
| Bare GO |
0.77 |
5.6 |
500 |
3.21 |
0.40 |
| GO–BM |
0.74 |
4.9 |
552 |
5.63 |
0.78 |
| GOBN2 |
— |
— |
33.0 |
16.6 |
0.14 |
| GOBN2–BM |
— |
— |
47.7 |
17.5 |
0.21 |
The morphology of the GOBN–BM nanocomposites was studied using SEM. Accordingly, Fig. S1† shows the SEM image of the GOBN2–BM sample revealing a nearly homogeneous distribution of h-BN particles into the rGO matrix. Also, the thickness of a single h-BN disk was observed to be in the range of 40–60 nm (as clearly seen in the inset of Fig. S1†). Furthermore, the morphology of the as-prepared GO–BM and GOBN2–BM samples was investigated by low-resolution TEM, as shown in Fig. S2.† It is observed that the wrapped GO sheets seem to be cut, due to the predominant role of mechanical activation through ball milling. As a result, the crystallite size of the GO–BM sample was decreased; whereas the surface area increases (Table 1). The partially shielding of a micron sized h-BN particles (dotted yellow circle region) in the presence of rGO sheets was confirmed through the TEM image shown in Fig. 2(a). The inset of Fig. 2(a) also clearly depicts the interface between rGO and h-BN, where it seems like h-BN sheets are protruding out from the rGO matrix (shown in Fig. S1†). Therefore, few such partially sandwiched h-BN particles inside or at the edges of the GO matrix provide a three phase boundary for dioxygen adsorption followed by an electroreduction process.
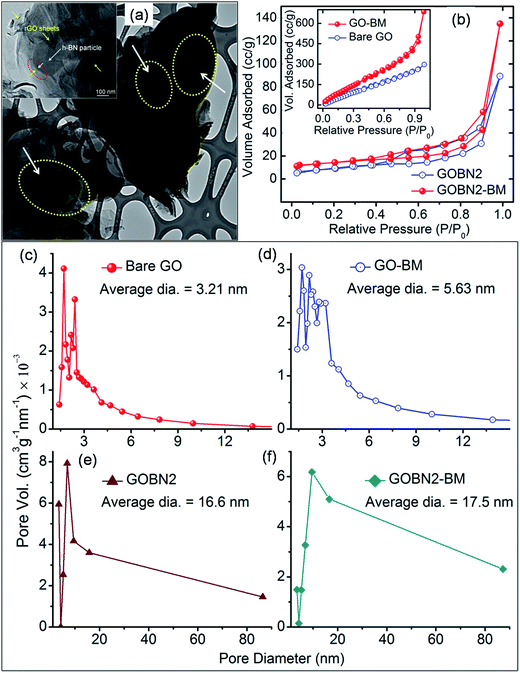 |
| | Fig. 2 (a) Low resolution TEM image of the GOBN2–BM composite catalyst reveals the shielding of rGO sheets over h-BN particles (yellow dotted circles) and the inset shows the TEM of GOBN2–BM with a clear appearance of the interface of h-BN and rGO sheets (red dotted circle); (b) N2 adsorption/desorption isotherm of GOBN2 and GOBN2–BM composite catalysts and the inset shows an isotherm of bare GO and GO–BM samples; (c–f) variation in the pore size distribution of bare GO, GO–BM, GOBN2 and GOBN2–BM composite catalysts respectively. | |
The specific surface area (SBET) of bare GO, GO–BM, GOBN2 and GOBN2–BM samples was further measured by the Brunauer–Emmett–Teller (BET) method. Fig. 2(b) and its inset reveal that the nature of the N2 adsorption/desorption isotherm is of type (IV), indicating mesoporosity in the resultant samples.38,39 The specific surface area of a bare GO and a GO–BM sample was observed to be 500 m2 g−1 and 552 m2 g−1 respectively. The notable improvement in the surface area of the GO–BM sample was mainly due to the pre-mechanical activation on GO and a similar trend was also observed in its respective composites too. For example, the GOBN2–BM composite exhibits a higher surface area (47.7 m2 g−1) than that of the GOBN2 (33 m2 g−1) catalyst (as clearly seen in Table 1). The pore size distribution calculated from the adsorption isotherm using the Barrett–Joyner–Halenda (BJH) method is shown in Fig. 2(c–f). The average pore diameters of GO–BM and GOBN2–BM (5.63 nm and 17.5 nm) are relatively higher when compared to those of pristine GO and GOBN2 (3.21 nm and 16.6 nm), which can be attributed to the pre-mechanical activation of GO. It is important to note that the increased surface area and pore size in the case of the GO–BM sample introduce effective electrochemical activation sites in the modified catalyst.38,39
Furthermore, the distribution of h-BN into the rGO matrix was carried out using the HAADF-STEM technique, shown in Fig. 3. Accordingly, Fig. 3(a) reveals the HAADF-STEM image for the GOBN2–BM sample and the corresponding elemental maps confirm the presence of B, N, C and O elements in the resultant nanocomposites, as shown in Fig. 3(b–e). Concomitantly, the chemical environment of C, O, B and N elements in GOBN–BM nanocomposites was studied using XPS analysis. As shown in Fig. S3(a),† the core level of the C 1s peak was split into four different peaks with the binding energy (BE) of 284.4 eV, 285.2 eV, 288.7 eV and 292.4 eV for C–C, –C–OH, –C![[double bond, length as m-dash]](https://www.rsc.org/images/entities/char_e001.gif) O and –COOH groups respectively.40 Also, Fig. S3(b)† reveals that the peaks with the BE of 530.1 eV, 531.5 eV, 532.6 eV and 534.0 eV correspond to the double bonded oxygen (–CO), epoxy group, ether linkages (–C–O–C–) and presence of adsorbed moisture/water respectively, which is in agreement with previous reports.41,42 Importantly, the B 1s and the N 1s spectrum in Fig. S3(c and d)† exhibit only a single peak around 190 eV and 398 eV that implies B–N and N–B bonding in the resultant sample respectively.11 Most importantly, no other peaks corresponding to O–B, C–B, O–N, C–N and pyridinic or pyrrolic bond linkages are observed in the case of the B 1s and the N 1s spectrum. Therefore, a van der Waals interaction in between h-BN sheets and graphitic stacking of rGO results in a more homogeneous nanocomposite.
O and –COOH groups respectively.40 Also, Fig. S3(b)† reveals that the peaks with the BE of 530.1 eV, 531.5 eV, 532.6 eV and 534.0 eV correspond to the double bonded oxygen (–CO), epoxy group, ether linkages (–C–O–C–) and presence of adsorbed moisture/water respectively, which is in agreement with previous reports.41,42 Importantly, the B 1s and the N 1s spectrum in Fig. S3(c and d)† exhibit only a single peak around 190 eV and 398 eV that implies B–N and N–B bonding in the resultant sample respectively.11 Most importantly, no other peaks corresponding to O–B, C–B, O–N, C–N and pyridinic or pyrrolic bond linkages are observed in the case of the B 1s and the N 1s spectrum. Therefore, a van der Waals interaction in between h-BN sheets and graphitic stacking of rGO results in a more homogeneous nanocomposite.
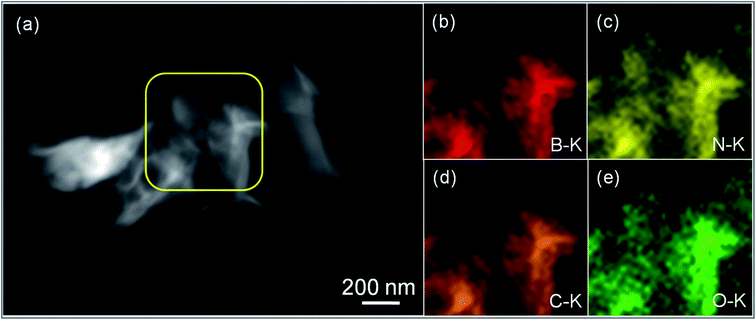 |
| | Fig. 3 (a) HAADF-STEM image of the GOBN2–BM catalyst and (b–e) corresponding elemental maps of B, N, C and O respectively. | |
All electrochemical studies were performed using cyclic voltammetry (CV), rotating disk electrode (RDE) and rotating ring-disk electrode (RRDE) techniques on a CHI 760E bi-potentiostat at room temperature. Initially, the electrocatalytic activities for oxygen reduction were examined using CV in 0.1 M KOH electrolyte at a scan rate of 20 mV s−1. Accordingly, Fig. 4(a) shows the CV curves for the as-synthesized GOBN2–BM nanocomposite catalyst in N2 and O2-saturated 0.1 M KOH solution. As can be seen, a featureless voltammogram without any noticeable peak was observed in the N2-saturated electrolyte solution, except a non-faradaic capacitive behaviour due to the high surface area of the composite,43 whereas in the case of O2-saturated electrolyte, a distinct cathodic peak at 0.73 V vs. the RHE is observed with a substantial increase in current density, indicating a much better performance than those of previously reported h-BN based metal or metal-free electrocatalysts.11,12,30–34 To get more insight into the oxygen electroreduction on the composite, linear sweep voltammetry (LSV) measurement was performed in O2-saturated 0.1 M KOH aqueous electrolyte at a scan rate of 10 mV s−1. Fig. 4(b) presents the ORR polarization curves of the GOBN2–BM composite catalyst at different rotation speeds. The onset potential and current density are the important electrochemical properties to describe the performance of the ORR. Interestingly, the electrochemical study implies that the GOBN2–BM nanocomposite shows a much better onset potential of 0.89 V versus the RHE with a substantially higher current density of 4.4 mA cm−2 when compared to similar kinds of previously reported systems under alkaline conditions.11,30–34
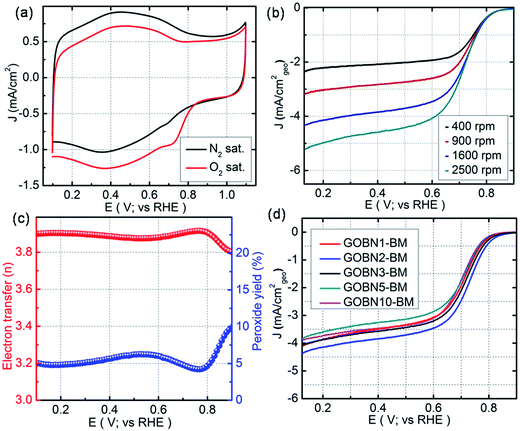 |
| | Fig. 4 (a) Comparative CVs of GOBN2–BM nanocomposite catalysts in N2 and O2-saturated 0.1 M KOH at a scan rate of 20 mV s−1; (b) ORR polarization curve of the GOBN2–BM sample in O2-saturated 0.1 M KOH recorded at various rotation speeds (geo: geometric current density, scan rate 10 mV s−1); (c) the extent of peroxide yield and number of electrons transferred (n) of the GOBN2–BM catalyst in the potential range of 0.1 to 0.9 V vs. RHE, derived from the RRDE data given in Fig. S6;† and (d) comparison of the ORR polarization curves of different compositions of electrocatalysts in O2-saturated 0.1 M KOH at 25 °C (geo: geometric current density, scan rate 10 mV s−1 and rotation rate 1600 rpm). | |
Additionally, the GOBN2–BM composite catalyst follows the Koutecky–Levich (K–L) approach, i.e. the current density increases with rotation speeds due to the decrease in diffusion layer distance at higher rotation speeds, which is clearly observed in Fig. 4(b).43,44 Moreover, the kinetics of the dioxygen reduction reaction of all different compositions of composite catalysts were studied using the Koutecky–Levich equation.44
| | 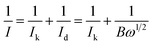 | (3) |
where,
| |  | (4) |
| |  | (5) |
here, ‘
I’ is the measured current, ‘
Ik’ is the kinetic current, ‘
Id’ is the diffusion limiting current, ‘
ω’ is the rotation rate of the RDE, and ‘
B’ is the K–L slope which is determined by using K–L plots. ‘
n’ is the number of electrons transferred during the ORR process, ‘
F’ is the Faraday constant (96
485 C mol
−1), ‘
ν’ is the kinematic viscosity of the 0.1 M KOH electrolyte (0.01 cm
2 s
−1), ‘
DO2’ is the diffusion coefficient of the oxygen molecules (1.9 × 10
−5 cm
2 s
−1), ‘
CO2’ is the bulk concentration of oxygen (1.2 × 10
−6 mol L
−1) and ‘
A’ is the geometrical surface area of the RDE.
11,12 The K–L plots (
J−1versus ω−1/2) shown in Fig. S(4)
† reveal the near parallel nature of the fitting lines. Thus the electron transfer number (
n) during the ORR kinetic process was deduced from the K–L plots, which was found to be 3.9 in the case of the GOBN2–BM sample, whereas the number of electrons transferred for the state-of-the-art Pt/C catalyst was found to be exactly 4 (Fig. S5 in the ESI
†), indicating a Pt-like single-step nearly 4-electron transfer pathway in the case of the GOBN2–BM nanocomposite catalyst. Generally, the K–L approach provides a value of ‘
n’ using the RDE technique, whereas, the RRDE gives further confirmation to RDE measurements, because the RRDE method has been a powerful technique for catalyst evaluation for ORR kinetics, by particularly detecting intermediates such as peroxide (HO
2−) species produced during the ORR process.
45–47 Accordingly, Fig. S(6)
† shows inferior ring current (
Ir) compared to disk current (
Id) in the case of the GOBN2–BM catalyst and hence, the generated peroxide yield was below 10% over the entire potential range of 0.1 to 0.9 V
versus the RHE and the average ‘
n’ value was calculated to be 3.89 (as clearly seen in
Fig. 4(c)), suggesting a single step, first order kinetic pathway for the dioxygen reduction reaction like the Pt electrocatalyst.
Furthermore, Fig. S(7)† reveals the comparative cyclic voltammograms for various h-BN compositions of composite catalysts at a sweep rate of 20 mV s−1 in O2-saturated 0.1 M KOH electrolyte solution. It is evident from the figure that the GOBN2–BM sample demonstrates a well defined and most positive cathodic ORR peak (0.73 V vs. the RHE) than those of GOBN3–BM (0.71 V) and other relevant samples, demonstrating higher electrocatalytic activity towards dioxygen reduction. Also, the LSV curves in Fig. 4(d) show the better electrocatalytic performance of the GOBN2–BM composite catalyst with relatively more positive onset potential (Eonset = 0.89 V), half-wave potential (E1/2 = 0.74 V) and limiting current density (JL = 4.4 mA cm−2) values at 0.1 V versus the RHE, as compared to other catalysts under alkaline conditions, whereas, the remaining nanocomposites with different compositions of h-BN (viz. 1 wt%, 3 wt%, 5 wt% and 10 wt%) exhibited a slightly lower electrocatalytic performance for the ORR. The comparative summary of ORR activities in terms of Eonset, E1/2 and JL for various catalysts is listed in Table S1 (see ESI†). Hence from Fig. 4(d) and Table S1,† it can be seen that the composite GOBN2–BM exhibits superior ORR catalytic activity and this can be attributed to the optimum threshold value of 2 wt% loading of h-BN on mechanically activated GO. Although the GOBN2–BM composite demonstrates slightly inferior electrocatalytic properties than commercial Pt or Pt-based alloy catalysts, considering the cost, scarcity and high instability of Pt based systems in alkaline medium makes them a poor choice for alkaline fuel cells. Therefore, the GOBN2–BM composite catalyst can be considered as a potential material to replace precious-metal or other metal-based catalysts in low-temperature fuel cells as well as rechargeable metal–air batteries.
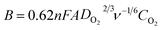
Furthermore, the detailed study of ORR kinetics was performed using the K–L approach and RRDE analysis. The summary of the calculations of the limiting kinetic current density (JK) and electron transfer number for various composite catalysts at 1600 rpm is shown in Fig. 5(a). As illustrated in Fig. 5(a), the GOBN2–BM composite catalyst shows a higher JK value of 4.57 mA cm−2 with ∼4-electron transfer oxygen electroreduction kinetics (n = 3.89) similar to the Pt/C catalyst (n = 4). Interestingly, the remaining composite catalyst exhibits relatively lower ORR kinetics than the GOBN2–BM catalyst, indicating that the optimum value of h-BN composition in the resultant composite plays a crucial role in ORR kinetics. The relatively lower ORR kinetics in the case of various composite catalysts except GOBN2–BM was further confirmed by a RRDE study. Fig. S(8 and S9)† present the generated peroxide (HO2−) yield (%) on the disk electrode surface and the corresponding number of electron transfers during the ORR pathway respectively. Accordingly, the GOBN–BM composites with different h-BN compositions, except 2 wt%, show more than 10% of peroxide yield with corresponding ‘n’ values in the range of 3.3 to 3.85, especially at higher electrode potentials. This again confirms that 2 wt% of h-BN loading on mechanically activated GO is the optimum value for better ORR kinetics. The ORR kinetics were further studied using Tafel-plots and the smaller Tafel slope (102 mV dec−1) obtained for the GOBN2–BM catalyst in comparison to those of other composites, demonstrating the better oxygen electroreduction kinetics of the GOBN2–BM sample (as clearly seen in Fig. 5(b)).48
 |
| | Fig. 5 (a) The electrochemical activity in terms of kinetic current density (JK) at 0.55 V versus the RHE for (A) GOBN1–BM, (B) GOBN2–BM, (C) GOBN3–BM, (D) GOBN5–BM and (E) GOBN10–BM composite catalysts obtained from the K–L plot in Fig. S4† and the average number of electrons transferred (n); (b) Tafel-plot of the nanocomposite catalyst with different compositions; (c) comparative ORR polarization curves of bare h-BN, GO–BM, GOBN2 and GOBN2–BM composite electrocatalysts in O2-saturated 0.1 M KOH at 25 °C. (geo: geometric current density, sweep rate 10 mV s−1 and rotation rate 1600 rpm); and (d) mass activity comparison of (A) bare h-BN, (B) GO–BM, (C) GOBN2, (D) GOBN1–BM, (E) GOBN2–BM, (F) GOBN3–BM, (G) GOBN5–BM and (H) GOBN10–BM, at 0.6 V versus RHE for all catalysts (here, kinetic current value were normalized by the total weight of the catalyst). | |
Finally, we compared LSV measurements of bare h-BN, GO–BM, GOBN2–BM and GOBN2 to investigate whether the mechanical activation of GO has any influence on oxygen electroreduction kinetics. Accordingly, Fig. 5(c) illustrates the comparative ORR polarization curves of h-BN, GO–BM, GOBN2 and GOBN2–BM catalysts in O2-saturated 0.1 M KOH solution. Interestingly, the results show that the bare h-BN and GO–BM samples exhibit a very inferior electrocatalytic activity with an onset potential of 0.73 V and 0.775 V vs. RHE and a current density of 2.3 and 1.9 mA cm−2 respectively (as clearly seen in Fig. 5(c) and Table S1†). Most importantly, upon comparison of the electrocatalytic activities of GOBN2 and GOBN2–BM catalysts with respect to Eonset (0.83 vs. 0.89 V), E1/2 (0.67 vs. 0.74 V), JL (3.5 vs. 4.4 mA cm−2) and mass activity (54.5 vs. 114.3 mA mg−1), it is clear that the GOBN2–BM catalyst exhibits positive shift in Eonset, E1/2, JL and mass activity as well. Besides the significant improvement in electrocatalytic activities, GOBN2–BM exhibits much better ORR kinetics when compared with previously reported metal-free h-BN based electrocatalyst.11,12 The superior electrokinetic activity of the GOBN2–BM composite catalyst was mainly attributed to, (1) the high surface area of the resultant nanocomposite, thanks to mechanical activation of GO that renders more active sites for dioxygen adsorption followed by electroreduction. It is important to note that mechanical treatment before composite preparation furnishes several changes in the GO (as shown in Scheme 1). For example, the healing of defects, which are created during GO synthesis; formation of defects due to mechanical delamination of a few graphitic layers; and formation of smaller graphene analogues again thanks to mechanical treatment. (2) The van der Waals interaction creates a synergistic mechanism between the h-BN and carbon matrix of GO, rendering active centers for ORR kinetics. Considering that the synergy of all such effects could lead to improved ORR kinetics at the interface of h-BN and rGO, such structural synergy is less prominent in the case of GOBN2 and can clearly be seen in the comparative electrochemical performance, shown in Fig. 5(c). Furthermore, mass activities were calculated for all composite catalyst along with bare h-BN and GO–BM at 0.6 V vs. RHE using ORR polarization curves. As shown in Fig. 5(d), the GOBN2–BM catalyst shows significantly higher mass activity (114.3 mA mg−1) than those of GOBN2 (54.5 mA mg−1), GO–BM (23.3 mA mg−1) and bare h-BN (19.2 mA mg−1) electrocatalysts. The mass activity results are in close agreement with our previous discussion based on the kinetics of ORR catalysts. The detailed comparisons of the electrochemical properties of the ORR for all electrocatalysts are given in Table S1 (see ESI†).
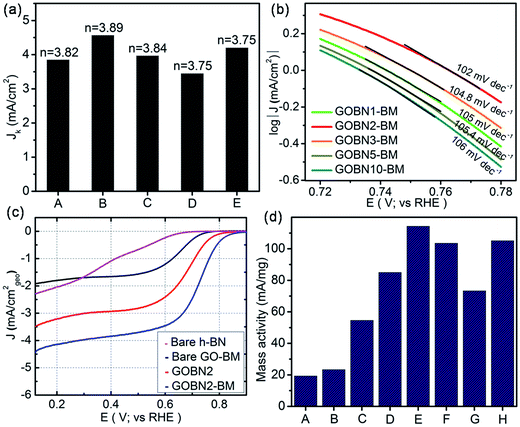
The stability and selectivity of the catalyst are two important key factors to describe the catalytic performance of any electrocatalyst. Therefore, the durability of the GOBN–BM catalyst was studied up to 5000 cycles at the scan rate of 50 mV s−1 and compared with that of commercial Pt/C catalyst. As shown in Fig. 6(a and b), the GOBN2–BM composite shows much better stability (ΔE1/2 = 6 mV) than that of the Pt/C catalyst (ΔE1/2 = 23 mV) after 5000 durable cycles under similar conditions. Furthermore, the loss in electrochemically active surface area (ECSA) after stability cycling for Pt/C is clearly observed in the inset of Fig. 6(b), signifying the better stability of GOBN2–BM than that of the Pt/C catalyst under alkaline conditions. To investigate the selectivity of the GOBN–BM nanocomposite catalyst towards the kinetics of the ORR, we performed chronoamperometric (current versus time) measurement tests for GOBN2–BM and Pt/C at constant half-wave potential in O2-saturated 0.1 M KOH solution. As shown in Fig. 6(c), no considerable loss in relative current with respect to time even after the addition of 1 M methanol in 0.1 M KOH electrolyte solution was observed in the GOBN2–BM sample. In contrast, the Pt-based catalyst exhibits significant loss in relative current values (as seen in Fig. 6(c)). These studies indicate excellent tolerance to the methanol cross-over effect during ORR kinetics in the GOBN2–BM sample; hence these materials can be considered as a potential candidate in direct methanol fuel cell (DMFC) applications.12,16 Additionally, in the case of Pt/C or other metal-based catalysts, the catalytic sites get poisoned through adsorption of carbon monoxide (CO) on the catalyst surface, subsequently losing its catalytic performance. The inset of the Fig. 6(c) reveals a minimal current loss in the case of the GOBN2–BM composite than that of the Pt/C catalyst, signifying the excellent tolerance properties of GOBN2–BM towards both methanol and CO poisoning. Importantly, Fig. 6(d) illustrates the corresponding relative durability response of the GOBN2–BM composite with Pt/C and the results show 95% retention in the current response after 600 s for the GOBN2–BM sample whereas, the Pt/C shows a sharp loss in the current response (only 50% retention) under similar conditions. In other words, the GOBN–BM nanocomposite shows immense durability and selectivity towards oxygen electroreduction kinetics under alkaline conditions. Hence, it could be a potential cathode catalyst to replace precious-metal based catalysts in alkaline fuel cells as well as other renewable energy conversion applications.
 |
| | Fig. 6 Comparative ORR polarization curves for (a) GOBN2–BM and (b) Pt/C catalysts, before and after 5000 durable cycles in O2-saturated 0.1 M KOH recorded at a sweep rate 10 mV s−1; whereas, the insets of (a) and (b) show a comparative kinetic current density (JK; obtained from K–L plots) of GOBN2–BM with Pt/C at 0.75 V and CVs of Pt/C, before and after 5000 cycles in N2-saturated 0.1 M KOH at a scan rate 20 mV s−1 respectively; the chronoamperometric response for comparison of the selectivity and durability of the GOBN2–BM catalyst with Pt/C, (c) before and after addition of 1 M methanol; and the inset shows relative ORR stability performance after introducing carbon monoxide in electrolyte solution; (d) corresponding relative durability response at constant half wave potential in O2-saturated 0.1 M KOH electrolyte solution. | |
Conclusions
In summary, we have demonstrated a simple and cost effective method to prepare GOBN–BM nanocomposites through a one step hydrothermal method. A positive effect of mechanical activation of GO on the electroreduction behaviour of GOBN–BM nanocomposites has been studied in detail. The structural and morphological study shows the formation of a homogeneous nanocomposite and masking of rGO sheets over few micron sized h-BN particles respectively. Interestingly, the improved electrocatalytic activity such as a superior Eonset of 0.89 V vs. the RHE, E1/2 of 0.74 V and JL of 4.4 mA cm−2 at 1600 rpm, as well as high stability and excellent methanol and CO tolerance properties are achieved for the optimized composition (2 wt% of h-BN) of the GOBN2–BM catalyst when compared to other catalysts. Although, the obtained nanocomposite exhibits inferior electrocatalytic activity than that of the state-of-the-art Pt catalyst, its catalytic performance is better than previously reported metal or metal-free h-BN based catalysts. The high electrocatalytic activity of thes GOBN–BM nanocomposite towards dioxygen reduction was attributed to the decrease in the crystallite size of GO which in turn increases the active surface area of catalyst as well as the synergistic effect of both rGO and h-BN. Therefore, GOBN–BM as a significant metal-free composite catalyst can be used as one of the promising cathode materials to replace precious-metal based catalysts in low temperature fuel cells as well as other electrochemical catalytic applications.
Conflicts of interest
There are no conflicts to declare.
Acknowledgements
The authors thank the Department of Science and Technology Science and Engineering Research Board (DST-SERB; No. SB/ FT/CS-120/2012), India for financial support through the Young Scientist Fast track scheme. Authors also acknowledge SRM University for providing research infrastructure.
References
- T. Tamaki, A. Minagawa, B. Arumugam, B. A. Kakade and T. Yamaguchi, J. Power Sources, 2014, 271, 346–353 CrossRef CAS.
- M. K. Debe, Nature, 2012, 486, 43–51 CrossRef CAS PubMed.
- A. Arico, S. Srinivasan and V. Antonucci, Fuel Cells, 2001, 1, 133–161 CrossRef CAS.
- M. Winter and R. J. Brodd, Chem. Rev., 2004, 104, 4245–4270 CrossRef CAS PubMed.
- C. Chen, Y. Kang, Z. Huo, Z. Zhu, W. Huang, H. L. Xin, J. D. Snyder, D. Li, J. A. Herron, M. Mavrikakis, M. Chi, K. L. More, Y. Li, N. M. Markovic, G. A. Somorjai, P. Yang and V. R. Stamenkovic, Science, 2014, 343, 1339–1343 CrossRef CAS PubMed.
- H. A. Gasteiger, S. S. Kocha, B. Sompalli and F. T. Wagner, Appl. Catal., B, 2005, 56, 9–35 CrossRef CAS.
- Y. Gong, H. Fei, X. Zou, W. Zhou, S. Yang, G. Ye, Z. Liu, Z. Peng, J. Lou, R. Vajtai, B. I. Yakobson, J. M. Tour and P. M. Ajayan, Chem. Mater., 2015, 27, 1181–1186 CrossRef CAS.
- X. Yan, Y. Jia, T. Odedairo, X. Zhao, Z. Jin, Z. Zhu and X. Yao, Chem. Commun., 2016, 52, 8156–8159 RSC.
- C. P. Jijil, M. Lokanathan, S. Chithiravel, C. Nayak, D. Bhattacharyya, S. N. Jha, P. D. Babu, B. Kakade and R. N. Devi, ACS Appl. Mater. Interfaces, 2016, 8, 34387–34395 CAS.
- X. Fan, Y. Liu, Z. Peng, Z. Zhang, H. Zhou, X. Zhang, B. I. Yakobson, W. A. Goddard III, X. Guo and R. H. Hauge, ACS Nano, 2017, 11, 384–394 CrossRef CAS PubMed.
- I. Patil, M. Loganathan and B. A. Kakade, J. Mater. Chem. A, 2016, 4, 4506–4515 CAS.
- I. M. Patil, M. Lokanathan, B. Ganesan, A. Swami and B. Kakade, Chem.–Eur. J., 2016, 1–9 Search PubMed.
- L. Wang, J. Yin, L. Zhao, C. Tian, P. Yu, J. Wang and H. Fu, Chem. Commun., 2013, 49, 3022 RSC.
- L. Zhao, L. Wang, P. Yu, D. Zhao, C. Tian, H. Feng, J. Ma and H. Fu, Chem. Commun., 2015, 51, 12399–12402 RSC.
-
K. P. Singh, Heteroatom-Doped Nanostructured Carbon Materials, in Carbon Nanomaterials Sourcebook: Nanoparticles, Nanocapsules, Nanofibers, Nanoporous Structures, and Nanocomposites, CRC Press, 2016, vol. II Search PubMed.
- Y. Zhang, J. Ge, L. Wang, D. Wang, F. Ding, X. Tao and W. Chen, Sci. Rep., 2013, 3, 2771 CrossRef PubMed.
- J. Wu, L. Ma, R. M. Yadav, Y. Yang, X. Zhang, R. Vajtai, J. Lou and P. M. Ajayan, ACS Appl. Mater. Interfaces, 2015, 7, 14763–14769 CAS.
- H. Tabassum, R. Zou, A. Mahmood, Z. Liang and S. Guo, J. Mater. Chem. A, 2016, 4, 16469–16475 CAS.
- C. You, X. Jiang, L. Han, X. Wang, Q. Lin, Y. Hua, C. Wang, X. Liu and S. Liao, J. Mater. Chem. A, 2017, 5, 1742–1748 CAS.
- R. Li, Z. Wei, X. Gou and W. Xu, RSC Adv., 2013, 3, 9978 RSC.
- D. Sen, R. Thapa and K. K. Chattopadhyay, ChemPhysChem, 2014, 15, 2542–2549 CrossRef CAS PubMed.
- S. Wang, L. Zhang, Z. Xia, A. Roy, D. W. Chang, J.-B. Baek and L. Dai, Angew. Chem., Int. Ed., 2012, 51, 4209–4212 CrossRef CAS PubMed.
- T. Ikeda, M. Boero, S.-F. Huang, K. Terakura, M. Oshima, J. Ozaki and S. Miyata, J. Phys. Chem. C, 2010, 114, 8933–8937 CAS.
- Y. Zhao, L. Yang, S. Chen, X. Wang, Y. Ma, Q. Wu, Y. Jiang, W. Qian and Z. Hu, J. Am. Chem. Soc., 2013, 135, 1201–1204 CrossRef CAS PubMed.
- L. Wang, P. Yu, L. Zhao, C. Tian, D. Zhao, W. Zhou, J. Yin, R. Wang and H. Fu, Sci. Rep., 2014, 4, 5184 CrossRef CAS PubMed.
- Q. Weng, X. Wang, X. Wang, Y. Bando and D. Golberg, Chem. Soc. Rev., 2016, 45, 3989–4012 RSC.
- D. Golberg, Y. Bando, Y. Huang, Z. Xu, X. Wei, L. Bourgeois, M.-S. Wang, H. Zeng, J. Lin and C. Zhi, Isr. J. Chem., 2010, 50, 405–416 CrossRef CAS.
- D. Golberg, Y. Bando, Y. Huang, T. Terao, M. Mitome, C. Tang and C. Zhi, ACS Nano, 2010, 4, 2979–2993 CrossRef CAS PubMed.
- A. Lyalin, M. Gao and T. Taketsugu, Chem. Rec., 2016, 16, 2324–2337 CrossRef CAS PubMed.
- G. Elumalai, H. Noguchi and K. Uosaki, Phys. Chem. Chem. Phys., 2014, 16, 13755 RSC.
- G. Elumalai, H. Noguchi, A. Lyalin, T. Taketsugu and K. Uosaki, Electrochem. Commun., 2016, 66, 53–57 CrossRef CAS.
- A. F. Khan, M. P. Down, G. C. Smith, C. W. Foster and C. E. Banks, J. Mater. Chem. A, 2017, 1–11 Search PubMed.
- A. F. Khan, E. P. Randviir, D. A. C. Brownson, X. Ji, G. C. Smith and C. E. Banks, Electroanalysis, 2016, 1–14 Search PubMed.
- A. Yamuna, A. Mandalam, A. Karthigaiselvi, M. Balasubramanian, B. Thiruparasakthi, S. Ravichandran and S. Mayavan, RSC Adv., 2015, 5, 69394–69399 RSC.
- W. S. Hummers Jr and R. E. Offeman, J. Am. Chem. Soc., 1958, 80, 1339 CrossRef.
- Y. Li, W. Zhou, H. Wang, L. Xie, Y. Liang, F. Wei, J.-C. Idrobo, S. J. Pennycook and H. Dai, Nat. Nanotechnol., 2012, 7, 394–400 CrossRef CAS PubMed.
- C. Xu, X. Wang, J. Zhu, X. Yang and L. Lu, J. Mater. Chem., 2008, 18, 5625 RSC.
- R. Vinoth, I. M. Patil, A. Pandikumar, B. A. Kakade, N. M. Huang, D. D. Dionysios and B. Neppolian, ACS Omega, 2016, 1, 971–980 CrossRef CAS.
- F. Lai, Y. E. Miao, Y. Huang, Y. Zhang and T. Liu, ACS Appl. Mater. Interfaces, 2016, 8, 3558–3566 CAS.
- D. Yang, A. Velamakanni, G. Bozoklu, S. Park, M. Stoller, R. D. Piner, S. Stankovich, I. Jung, D. A. Field, C. A. Ventrice and R. S. Ruoff, Carbon, 2009, 47, 145–152 CrossRef CAS.
- R. Larciprete, P. Lacovig, S. Gardonio, A. Baraldi and S. Lizzit, J. Phys. Chem. C, 2012, 116, 9900–9908 CAS.
- D. Rosenthal, M. Ruta, R. Schlögl and L. Kiwi-Minsker, Carbon, 2010, 48, 1835–1843 CrossRef CAS.
- H. Fei, R. Ye, G. Ye, Y. Gong, Z. Peng, X. Fan, E. L. G. Samuel, P. M. Ajayan and J. M. Tour, ACS Nano, 2014, 10837–10843 CrossRef CAS PubMed.
-
A. J. Bard and L. R. Faulkner, Electrochemical Methods: Fundamentals and Applications, Wiley, New York, 2nd edn, 2000 Search PubMed.
-
W. Xing, G. Yin and J. Zhang, Rotating Electrode Methods and Oxygen Reduction Electrocatalysts, Elsevier, 2014 Search PubMed.
- U. A. Paulus, T. J. Schmidt, H. A. Gasteiger and R. J. Behm, J. Electroanal. Chem., 2001, 495, 134–145 CrossRef CAS.
- Y. Zheng, Y. Jiao, L. Ge, M. Jaroniec and S. Z. Qiao, Angew. Chem., 2013, 125, 3192–3198 CrossRef.
-
X.-Z. Yuan, C. Song, H. Wang and J. Zhang, Electrochemical Impedance Spectroscopy in PEM Fuel Cells, Springer London, London, 2010 Search PubMed.
Footnote |
| † Electronic supplementary information (ESI) available. See DOI: 10.1039/c7se00461c |
|
| This journal is © The Royal Society of Chemistry 2018 |

 ab,
Chamundi P.
Jijil
ab,
Chamundi P.
Jijil


