Self-assembled Fe3O4 nanoparticle-doped TiO2 nanorod superparticles with highly enhanced lithium storage properties†
Bin
Xue
 ab,
Tongtao
Li
a,
Biwei
Wang
a,
Li
Ji
a,
Dong
Yang
b and
Angang
Dong
 *a
*a
aCollaborative Innovation Center of Chemistry for Energy Materials, Shanghai Key Laboratory of Molecular Catalysis and Innovative Materials, Department of Chemistry, Fudan University, Shanghai 200433, China. E-mail: agdong@fudan.edu.cn
bState Key Laboratory of Molecular Engineering of Polymers, Fudan University, Shanghai 200433, China
First published on 20th December 2017
Abstract
Rational design of nanostructured anode materials is of importance for promoting the performance of lithium ion batteries (LIBs). Here the Fe3O4 nanoparticles (NPs) were controllably inserted into the matrix of TiO2 nanorods (NRs) to obtain doped-superparticles (SPs) by a facile colloidal self-assembly route and subsequent calcination. To justify the effects of the doping, the lithium storage performances of the doped-SPs were evaluated as anode materials for LIBs. The results indicated that even a slight doping of Fe3O4 NPs can effectively enhance the properties of the anode materials compared with raw TiO2 NR SPs. Additionally, the Fe3O4/(TiO2)70 SPs showed an optimal performance in term of specific capacity, rate capacity, and cycling stability, whose reversible capacity maintained around 550 mA h g−1 at a current density of 1000 mA g−1 after 400 cycles. The highly enhanced lithium storage of the Fe3O4 NP doped-TiO2 NR SPs can substantially be attributed to the synergism of the doped-superstructure, in which the individual merits of the Fe3O4 NPs and TiO2 NRs are fully played out. This work not only demonstrates the significant effects of Fe3O4 NP doping for TiO2 NR SP anode materials in LIBs, but also opens an avenue for the self-assembly synthesis of doped-SPs with extended applications.
Introduction
In recent years, fossil fuels such as coal, oil and natural gas have become depleted along with the rapid development of human society. Development of renewable energy is an important way to solve the energy crisis. Amongst various renewable energy devices, lithium-ion batteries (LIBs) have attracted keen research interest owing to their high energy, long life, good security and environmentally friendliness in the field of energy conversion and storage.1 As a potential electrode material candidate for LIBs, nanocrystals (NCs) exhibit several advantages over their bulk counterparts, such as higher specific capabilities, shorter ionic diffusion pathways, and higher utilization efficiency of active materials. However, the NCs generally suffer from low energy density and poor cycling life because of high surface-to-volume ratios and excessive generation of a solid electrolyte interphase (SEI) between the electrolyte and active materials.2 Fortunately, the colloidal NCs can be used as building blocks to construct superparticles (SPs) through a bottom-up self-assembly route.3–6 The resulting NC SPs can not only shorten the lithium ion diffusion path due to the existence of pores, but also provide abundant interstitial space to tolerate volume expansion of the active materials. More importantly, the well-defined spherical geometry favors the formation of stable SEI interfaces on the outer surface.7Recently, Murray and co-workers extended the concept of substitutional atomic doping to NC superlattices,8 in which co-assembly of two NC components with carefully adjusted size and concentration ratios led to a doped self-assembled superstructure. Similar to the atomic doping effect, this NC doping concept has the potential to substantially enhance the physical properties of NC assemblies such as electrical conductivity, as has been demonstrated in previous work.8,9 It is therefore very appealing to test the feasibility of this NC doping concept in improving lithium storage performance. To this end, the composition of the SPs can be easily adjusted by modulating the species and proportions of the building blocks, obtaining doped-SPs. The doped-SPs possess a number of structural advantages. On one hand, the SPs preserve the intrinsic properties of individual NC building blocks. On the other hand, the NC dopants can effectively improve the intrinsic properties of the NC matrix in the SPs, achieving the synergistic effect. In this regard, the rational design of the doped-SP anode materials will provide great opportunities for promoting the electrochemical performance of LIBs.
As an arresting anode material for LIBs, TiO2 NCs possess many advantages, such as high security, high working voltage, chemical stability, environmentally friendly and abundance on Earth.10,11 Especially, one-dimensional TiO2 NCs, such as nanorods (NRs), nanowires (NWs) and nanotubes (NTs), exhibit unique advantages due to the efficient electron transportation along the axial direction.12 However, the inherent drawbacks including the poor electronic conductivity, the slow lithium ion diffusion rate and the low theoretical capacity of 167.5 mA h g−1 hinder the practical lithium storage application of TiO2 NCs.10–12 In view of this situation, a variety of strategies, such as carbon13–24 or graphene25–31-coating, loading of high capacity active materials,32–46 fabrication of hollow structures,47–50 design of specific shapes,51,52 defect engineering53–55 and exposed facet control56 have been used to improve the lithium storage properties of TiO2 NCs. Compared with TiO2 NCs, Fe3O4 NCs exhibit a much higher theoretical capacity of ∼1000 mA h g−1. However, Fe3O4 NCs still suffer from poor cycle performance due to the tremendous volume change during the charge/discharge process.57–59 Obviously, combining TiO2 and Fe3O4 NCs to form a composite superstructure could achieve complementary advantages between stability and capacity. However, to the best of our knowledge, little work has been related to the self-assembled synthesis of the Fe3O4 NP doped-TiO2 NR SPs with enhanced electrochemical lithium storage properties. The strong synergies between TiO2 and Fe3O4 NC building blocks in the doped-SPs are likely to provide new opportunities for the enhancement of lithium storage performances.
Inspired by the NC doping concept,8,9 herein we design a Fe3O4 NP doped-TiO2 NR SP system which exhibits a significant synergistic effect in lithium storage. We achieved the facile synthesis of the Fe3O4 NP doped-TiO2 NR SPs through a bottom-up self-assembly route in a microemulsion system and subsequent calcination. In addition to possessing the general structural features of the NC SPs, the Fe3O4 NP doped-TiO2 NR SPs can also be enhanced in terms of theoretical capacity and conductivity, achieving the synergy of the two components in complement to each other. These factors have a positive impact on the lithium storage performances.
Experimental
Materials
Oleic acid (OA, 90%), 1-octadecene (ODE, 90%) and dodecyltrimethylammonium bromide (DTAB, 98%) were obtained from Sigma-Aldrich. Titanium butoxide (TBOT, 98.0%) and iron chloride hexahydrate (FeCl3·6H2O, 99%) were obtained from Aladdin. Sodium oleate (NaOA, >97%) was purchased from TCI. Sodium fluoride (NaF, ≥98.0%) was purchased from Sinopharm. Iron oleate (Fe(OA)3) was synthesized by reaction of NaOA and FeCl3·6H2O according to the method described in the literature.60 All chemicals were used as received without further treatment.Synthesis of TiO2 NRs
TiO2 NRs were synthesized by a modified literature method.61 In a typical synthesis, 48 mL (151 mmol) of OA, 6 mL (18 mmol) of TBOT and 20 mg (0.5 mmol) of NaF were loaded in a 100 mL flask. The above mixture was degassed at 120 °C for 30 min, back-filled with a nitrogen atmosphere, and kept at 270 °C for 180 min, and then cooled to room temperature. The TiO2 NRs were isolated by the addition of ethanol and centrifugation. The precipitates were then washed twice. Finally, the precipitated TiO2 NRs were redispersed in hexane to form stable colloidal solution with a concentration of ∼40 mg mL−1.Synthesis of Fe3O4 NPs
Fe3O4 NPs were synthesized by a modified literature method.60 In a typical synthesis, 36 g (40 mmol) of Fe(OA)3, 8.6 g (30 mmol) of OA and 140 g (554 mmol) ODE were loaded into a 500 mL flask. The above mixture was degassed at 120 °C for 60 min, back-filled with a nitrogen atmosphere, and kept at 320 °C for 60 min, and then cooled to room temperature. The Fe3O4 NPs were isolated by the addition of isopropanol/ethanol and centrifugation. The precipitates were then washed twice. Finally, the precipitated Fe3O4 NPs were redispersed in hexane to form stable colloidal solutions with a concentration of ∼40 mg mL−1.Synthesis of Fe3O4 NP doped-TiO2 NR SPs
In a typical synthesis, 2.0 g (6.5 mmol) of DTAB were dissolved in 20 mL (1.11 mol) of deionized water in a 250 mL flask, the premixed 1.82 mL of a hexane solution of TiO2 NRs (0.9 mmol) and 0.182 mL of a hexane solution of Fe3O4 NPs (0.03 mmol) were added to the flask. The reactants in the flask were mechanically stirred for 30 min at 800 rpm, and then heated to 60 °C, and kept mechanically stirred for 60 min at 400 rpm. Afterward, the mixture was cooled to room temperature. The precipitates were collected by centrifugation, washed using deionized water/ethanol three times and vacuum dried for 12 h at 60 °C. Sequentially, the dried solids were calcinated at 500 °C for 2 h under a nitrogen atmosphere, with a heating rate of 2 °C min−1. Eventually, the resulting Fe3O4 NP doped-TiO2 NR SPs was denoted as Fe3O4/(TiO2)70 according to the number ratio between the two particles (see ESI† for the calculation procedure). In addition, the resulting products with different volume ratios between Fe3O4 and TiO2 solutions were denoted as Fe3O4/(TiO2)7, Fe3O4/(TiO2)35 and Fe3O4/(TiO2)140, respectively. The TiO2 SPs was synthesized using the same procedure, except that 2.0 mL of a hexane solution of TiO2 NRs (1.0 mmol) was added.Characterization
Transmission electron microscopy (TEM) was performed on a Tecnai G2 20 TWIN microscope under an acceleration voltage of 200 kV. High resolution transmission electron microscopy (HRTEM), scanning transmission electron microscopy (STEM) and elemental mappings were performed on a Tecnai G2 F20 S-Twin under an acceleration voltage of 200 kV. The X-ray powder diffraction (XRD) patterns of the product were recorded using an X'pert PRO diffractometer. The operating voltage and current used were 40 kV and 40 mA, respectively. Field emission scanning electron microscopy (FESEM) images and energy dispersive spectrum (EDS) of the product were taken with a Zeiss Ultra-55 microscope operated at an acceleration voltage of 5.00 kV. The Leica EM TIC 3X Ion-Beam Cutter was used to produce samples for cross-sectional imaging and EDS analyses. The acceleration voltage and gun current were 6 kV and 2.2 mA, respectively. N2 adsorption–desorption isotherms, pore size distributions and Brunauer–Emmett–Teller (BET) specific surface area were analyzed on a Quantachrome QuadraSorb SI adsorption apparatus. The pore size distribution curves were determined by using the Barrett–Joyner–Halenda (BJH) mode. Thermogravimetric analysis (TGA) measurements were carried out on a PerkinElmer Pyris 1 thermogravimetric analyzer. Raman spectra were measured with a HORIBA LabRAM HR800 laser Raman spectrometer with the excitation wavelength of 514 nm.Electrochemical test
The battery performance measuring was carried out using 2016-type coin cells assembled in an argon-filled glovebox, with Fe3O4 NP doped-TiO2 NR SPs as the working electrode. The electrolyte was a 1 mol L−1 LiPF6 solution in a mixture of ethylene carbonate, dimethyl carbonate, and ethyl methyl carbonate (1![[thin space (1/6-em)]](https://www.rsc.org/images/entities/char_2009.gif) :
:![[thin space (1/6-em)]](https://www.rsc.org/images/entities/char_2009.gif) 1
1![[thin space (1/6-em)]](https://www.rsc.org/images/entities/char_2009.gif) :
:![[thin space (1/6-em)]](https://www.rsc.org/images/entities/char_2009.gif) 1 in volume), and a polypropylene film (Celgard-2300) was used as the separator. The working electrodes were prepared by a slurry coating procedure. The slurry was prepared as follows: TiO2/Fe3O4 SPs, acetylene black, and polyvinylidene fluoride (PVDF) at a weight ratio of 7
1 in volume), and a polypropylene film (Celgard-2300) was used as the separator. The working electrodes were prepared by a slurry coating procedure. The slurry was prepared as follows: TiO2/Fe3O4 SPs, acetylene black, and polyvinylidene fluoride (PVDF) at a weight ratio of 7![[thin space (1/6-em)]](https://www.rsc.org/images/entities/char_2009.gif) :
:![[thin space (1/6-em)]](https://www.rsc.org/images/entities/char_2009.gif) 2
2![[thin space (1/6-em)]](https://www.rsc.org/images/entities/char_2009.gif) :
:![[thin space (1/6-em)]](https://www.rsc.org/images/entities/char_2009.gif) 1 were mixed using N-methyl-2-pyrrolidinone (NMP) as a solvent. The slurry was coated on a copper foil, which acted as a current collector. The electrodes were dried at 90 °C for 4 h in air, and then at 90 °C under vacuum for another 12 h. Galvanostatic charge/discharge tests were carried out on a battery testing system (NEWARE, China), which was cycled between 0.01 V and 3.00 V (vs. Li+/Li) with different current densities. Cyclic voltammetry (CV) at a scan rate of 0.1 mV s−1 between 0.1 mV and 3.00 V (vs. Li+/Li) and electrochemical impedance spectroscopy (EIS) in a frequency range of 100 kHz to 0.01 Hz were carried out on an electrochemical workstation (AUTOLAB PGSTAT204, Metrohm).
1 were mixed using N-methyl-2-pyrrolidinone (NMP) as a solvent. The slurry was coated on a copper foil, which acted as a current collector. The electrodes were dried at 90 °C for 4 h in air, and then at 90 °C under vacuum for another 12 h. Galvanostatic charge/discharge tests were carried out on a battery testing system (NEWARE, China), which was cycled between 0.01 V and 3.00 V (vs. Li+/Li) with different current densities. Cyclic voltammetry (CV) at a scan rate of 0.1 mV s−1 between 0.1 mV and 3.00 V (vs. Li+/Li) and electrochemical impedance spectroscopy (EIS) in a frequency range of 100 kHz to 0.01 Hz were carried out on an electrochemical workstation (AUTOLAB PGSTAT204, Metrohm).
Results and discussion
The synthesis route of the Fe3O4 NP doped-TiO2 NR SPs is illustrated in Fig. 1. As building blocks, the TiO2 NRs and Fe3O4 NPs were synthesized by colloidal chemical synthetic procedures (Fig. 1a). Afterwards, TiO2 NRs and Fe3O4 NPs can be co-assembled through hydrophobic interactions of OA in an oil-in water (O/W) microemulsion system.3,4 After evaporation of the organic solvent, the assembled Fe3O4 NP doped-TiO2 NR colloidal SPs were formed (Fig. 1b). Inside the SPs, colloidal Fe3O4 NPs are wrapped by a large amount of colloidal TiO2 NRs to form the repeating units. The OA ligands coated on the colloidal NCs can be converted to carbon by calcination in an inert atmosphere. Finally, the carbon-coated Fe3O4 NP doped-TiO2 NR SPs were obtained (Fig. 1c).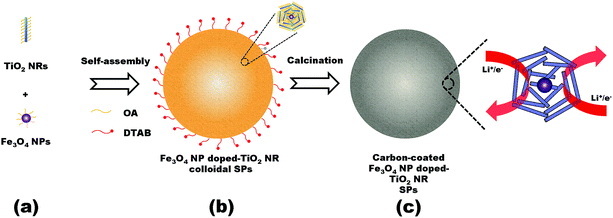 | ||
| Fig. 1 Schematic representation of the synthesis of the Fe3O4 NP doped-TiO2 NR SPs. (a) Colloidal building blocks, (b) assembled superstructures and (c) carbonized superstructures. | ||
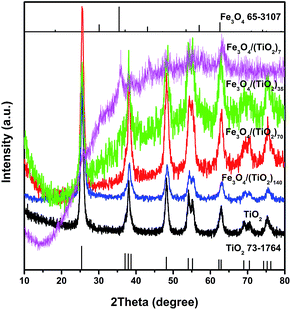
The microstructures of the building blocks and assembled SPs were characterized systematically. Fig. 2 shows the XRD patterns of TiO2 NR SPs and Fe3O4 NP doped-TiO2 NR SPs. The XRD patterns of all samples can be indexed to the anatase phase of TiO2 (JCPDS no. 73-1764). Except for Fe3O4/(TiO2)7, the diffraction peaks of Fe3O4 in other Fe3O4 NP doped-TiO2 NR SPs are not obvious, which may be due to the high dispersibility and low amount of Fe3O4 NPs. The relevant Fe3O4 diffraction peaks detected in the XRD pattern of Fe3O4/(TiO2)7 SPs can be indexed to the cubic phase of magnetite (JCPDS no. 65-3107). With the increase of the content of Fe3O4, the intensity of the diffraction peaks of TiO2 gradually decreases and broadens. According to Scherrer's equation, the average crystal size of TiO2 for TiO2, Fe3O4/(TiO2)140, Fe3O4/(TiO2)70, Fe3O4/(TiO2)35 and Fe3O4/(TiO2)7 SPs was determined to be 21.9, 17.2, 13.4, 12.0 and 7.5 nm, respectively. Obviously, the presence of Fe3O4 NPs inhibits the growth of crystalline domains of TiO2 NRs in the assembly and subsequent calcination processes. In addition, there are no diffraction peaks of carbon materials, indicating that the carbon converted by OA ligands is amorphous.
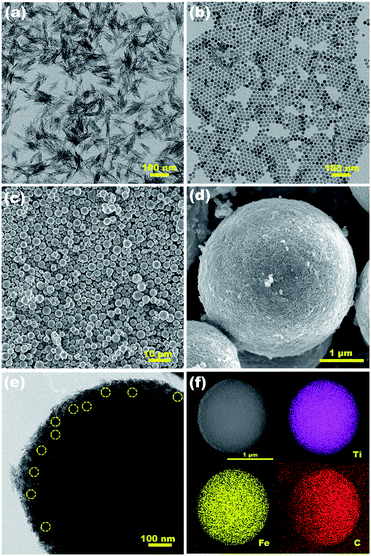
Fig. 3a and b show the well-defined shape of rods and spheres of TiO2 and Fe3O4 NPs, respectively. The TiO2 NRs tend to form bundles due to the high surface energy. As can be seen from the enlarged TEM image in Fig. S1,† TiO2 NRs have an average diameter of ∼5 nm and lengths of ∼50 nm. The Fe3O4 NPs exhibit good monodispersity. The average diameter of the Fe3O4 NPs is 17 nm. Fig. 3c and d show the representative FETEM images of the Fe3O4/(TiO2)70 SPs. The diameter range of the SPs is from a micron to several microns. The rough surface consists of closely packed bundles of TiO2 NRs, and Fe3O4 NPs are difficult to distinguish on the surface of SPs. As can be seen from the high magnification TEM image of single SPs in Fig. 3e and S2,† some isolated Fe3O4 NPs are wrapped with abundant TiO2 NRs and distributed homogeneously within the SPs. The HRTEM image in Fig. S3† reveals two different lattices with a d spacing of 0.35 and 0.25 nm, which correspond to the (101) lattice plane of TiO2 and the (311) lattice plane of Fe3O4, respectively. However, unlike the assembly of spherical NCs,3–6 the ordered assembly of building blocks was not realized in this work. This may be related to the anisotropy of TiO2 NRs and the large shape difference between TiO2 NRs and Fe3O4 NPs. Despite the randomly packed structure, the STEM image and elemental mappings shown in Fig. 3f clearly confirm the uniform distribution of Ti, Fe and C elements in the Fe3O4/(TiO2)70 SPs, suggesting that the homogenous assembly between TiO2 NRs and Fe3O4 NPs has been achieved. According to the EDS analysis on the cross-section of the Fe3O4/(TiO2)70 SPs (Fig. S4†), the mass ratio between TiO2 and Fe3O4 in the Fe3O4/(TiO2)70 SPs can be estimated to be 10.7, which is close to the feed ratio.
Moreover, Fig. 4 shows the representative FESEM images of the Fe3O4 NP doped-TiO2 NR SPs with different Fe3O4/TiO2 ratios. Except for the Fe3O4/(TiO2)7 SPs, the morphology of Fe3O4 NP doped-TiO2 NR SPs did not change significantly when varying the Fe3O4/TiO2 ratios, indicating that the addition of Fe3O4 NPs did not affect the self-assembly behaviour of the TiO2 NRs. However, the Fe3O4/(TiO2)7 SPs display irregular shapes, including sphere-, erythrocyte-, and shell-like morphologies. In particular, the isolated assembly of Fe3O4 NPs appears on the surface of the Fe3O4/(TiO2)7 (see Fig. S5†), which suggested a phase separation between the TiO2 NRs and Fe3O4 NPs. Obviously, the above phenomena indicate that the excessive Fe3O4 doping levels interfere with the assembly of TiO2 NRs.
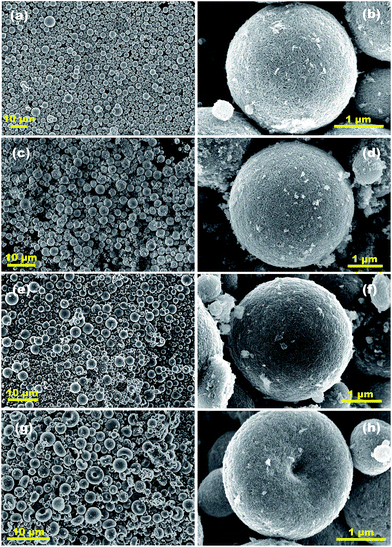 | ||
| Fig. 4 Representative FESEM images of (a, b) TiO2, (c, d) Fe3O4/(TiO2)140, (e, f) Fe3O4/(TiO2)35 and (g, h) Fe3O4/(TiO2)7 SPs. | ||
To investigate the specific surface areas and pore size distribution of the SPs, nitrogen adsorption–desorption analysis was performed. As shown in Fig. 5a, the Fe3O4/(TiO2)70 and TiO2 SPs exhibit the isotherms between type IV and V combined with the H1 hysteresis loop in the relative pressure range of 0.4–0.9 and the H3 hysteresis loop in the relative pressure range of 0.9–1.0. The complex shape of the isotherm reflects the diversity of pore structures and size distribution in the SPs. The H1 hysteresis loop is often associated with porous structures generated by agglomerates of approximately spherical particles.62 The H3 hysteresis loop does not exhibit any limiting adsorption at the high relative pressure range of 0.9–1.0, which indicates the aggregates of rod-like particles giving rise to slit-shaped pores.62 The BET specific surface area of the Fe3O4/(TiO2)70 and TiO2 SPs is 161.79 and 134.15 m2 g−1, respectively. The pore volume of the Fe3O4/(TiO2)70 and TiO2 SPs is 0.527 and 0.520 cm3 g−1, respectively. Unsurprisingly, the corresponding BJH pore size distribution curves show the broader pore size distributions from a few nanometers to several tens of nanometers for both Fe3O4/(TiO2)70 and TiO2 SPs. Obviously, the SPs exhibited a hierarchical distribution of pore size consisting of mesopores (2–50 nm) and macropores (>50 nm). Moreover, the integration of the Fe3O4 NPs in Fe3O4/(TiO2)70 SPs partly increases the porosity between the building blocks, resulting in the enhanced specific surface area and the narrowed pore size distribution. The hierarchical porous structure of the SPs is significant for the improvement of their electrochemical properties of lithium storage due to the existence of an efficient path for the diffusion of lithium ions and electrolytes. The carbon species in the assembled SPs, derived from the native organic ligands, also plays an important role in electrochemical lithium storage. Fig. 5b shows the TGA profiles of the SPs. The carbon content of the Fe3O4/(TiO2)70 and TiO2 SPs is 10.3 and 10.8%, respectively. Fig. 5c displays the Raman spectra of the SPs, where the ID/IG values of the Fe3O4/(TiO2)70 and TiO2 SPs are 0.77 and 0.79, respectively, consistent with the features of low-crystallized carbon. The similar ID/IG ratios indicate that the carbon species in both the assembled SPs have a similar degree of graphitization. These nitrogen adsorption–desorption analysis, TGA and Raman results suggest that the contribution of textural properties and carbon coating to electrochemical properties of lithium storage is nearly equivalent for the Fe3O4/(TiO2)70 and TiO2 SPs.
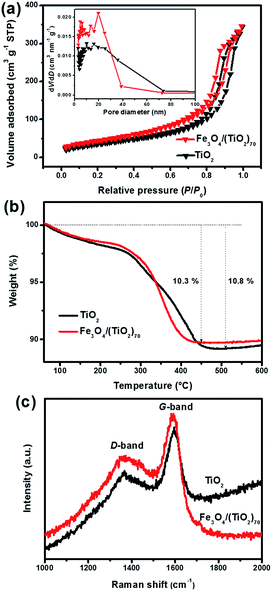 | ||
| Fig. 5 (a) Nitrogen adsorption–desorption isotherms and corresponding pore size distribution (inset), (b) TGA profiles in an air atmosphere, (c) Raman spectra of Fe3O4/(TiO2)70 and TiO2 SPs. | ||
The lithium storage properties of the Fe3O4/(TiO2)70 and TiO2 SPs are assessed through a series of electrochemical measurements. Fig. 6a shows the CV curves of the Fe3O4/(TiO2)70 SPs. During the first scan, a distinct reduction peak at around 1.7 V and an oxidation peak at around 2.1 V are observed, which correspond to the insertion/extraction of lithium into/out of the anatase lattice, respectively, as shown in eqn (1).11
| TiO2 + xLi+ + xe− = LixTiO2 | (1) |
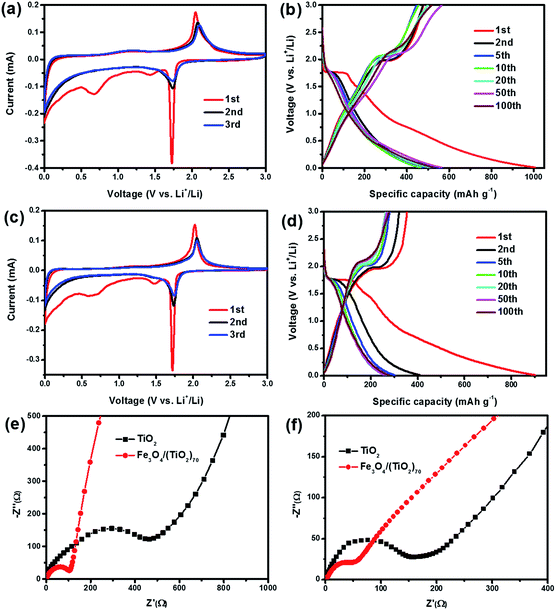 | ||
| Fig. 6 Cyclic voltammograms and galvanostatic charge/discharge curves of (a, b) Fe3O4/(TiO2)70 and (c, d) TiO2 SPs. Nyquist plots of Fe3O4/(TiO2)70 and TiO2 SPs: (e) before and (f) after cycling. | ||
Moreover, the distinct reduction peak approaching 0 V could be attributed to lithium storage occurring in the carbon coating. The reduction and oxidation peaks are slightly shifted in the subsequent cycles, indicating the irreversible structural modifications owing to lithium insertion/extraction and other electrolyte-related surface reactions after the first cycle. In addition, two broad reduction peaks at around 1.5 and 0.6 V are observed in the first cathodic scan. The peak at 0.6 V can be assigned to the SEI formation, whereas the peak at 1.5 V may be ascribed to some irreversible side reactions with electrolytes.38 Both peaks disappear in the subsequent cycles, which indicated that the electrochemical behaviour causes irreversible capacity loss. Despite this, the substantial overlap of CV curves in subsequent cycles suggests a good structural stability and reversibility during the electrochemical process. Fig. 6b shows galvanostatic charge/discharge curves at a current density of 100 mA g−1 for the Fe3O4/(TiO2)70 SPs. In the first cycle, the voltage plateaus located at around 1.7 and 2.1 V correspond to the insertion/extraction of lithium into/out of the anatase lattice, respectively, while the two indistinct voltage plateaus located at around 1.5 and 0.6 V in the discharge curves correspond to the irreversible side reactions with electrolytes and the formation of the SEI film, respectively. These charge and discharge plateaus are in general consistent with the above CV results. The initial discharge capacity of the Fe3O4/(TiO2)70 SPs reaches to 1006.5 mA h g−1. The charge capacity is 478.2 mA h g−1 in the first charge process. Accordingly, the initial coulombic efficiency of the Fe3O4/(TiO2)70 SPs are 47.5%. Similar to common anode materials, the significant capacity loss is mainly caused by the formation of SEI film during the first cycle. In the subsequent cycles, the discharge plateaus located at around 1.7 V are shortened and discharge capacities reduced. However, the coulombic efficiencies have been gradually improved, which are increased up to 94.1% in the 5th cycle. Hereafter, charge/discharge curves are gradually stabilized, indicating the excellent stability of the Fe3O4/(TiO2)70 SPs. It is noteworthy that the above described CV and galvanostatic charge/discharge curves did not show the distinct electrochemical behaviours of Fe3O4 NPs, which may be associated with the lower content and high dispersion of Fe3O4 NPs in the Fe3O4/(TiO2)70 SPs. In order to confirm this speculation, the galvanostatic charge/discharge curves of the SPs with different doping ratios are compared. As shown in Fig. S6,† the first galvanostatic charge/discharge curves of the SPs, including TiO2, Fe3O4/(TiO2)140, Fe3O4/(TiO2)70 and Fe3O4/(TiO2)35 do not show the remarkable voltage plateaus of Fe3O4. However, the first galvanostatic discharge curves of the Fe3O4/(TiO2)7 display distinct voltage plateaus located at around 0.8 V, corresponding to the discharge behaviour of Fe3O4 NPs. This indicates that the integrated Fe3O4 NPs do not significantly affect the electrochemical behaviours of TiO2 SPs over a wide range of doping levels, which may be attributed to the unique doped-assembly structure. The similar features of the CV and galvanostatic charge/discharge curves in Fig. 6c and d also reflect that the electrochemical behaviours of the TiO2 SPs are consistent with that of the Fe3O4/(TiO2)70 SPs. However, the integrated area of stabilized CV curves of the Fe3O4/(TiO2)70 SPs is significantly larger than that of the TiO2 SPs, and the TiO2 SPs exhibited a much lower initial coulombic efficiency of 39.3%. In addition, the fading of the charge/discharge capacity of the TiO2 SPs is more serious than that of the Fe3O4/(TiO2)70 SPs in the subsequent cycles. As both of the Fe3O4/(TiO2)70 and TiO2 SPs are porous microspheres and have a similar surface morphology, the effect of the surface morphology on the irreversible capacity of two types of SPs should be similar. Moreover, considering the low doping amount of Fe3O4, we speculate that this irreversible capacity loss is mainly caused by TiO2 and carbon. These results again confirm the importance of the integrated Fe3O4 NPs in improving the lithium storage properties of Fe3O4/(TiO2)70 SPs.
In order to further compare the electrochemical properties of the SPs, EIS measurements were performed before and after 10 charge/discharge cycles at a current density of 1000 mA g−1. The Nyquist plots were shown in Fig. 6e and f. The corresponding EIS data were fitted using the respective equivalent circuit modes (Fig. S7†) and the calculated impedance parameters are listed in Table S1.† The Nyquist plots consist of a semicircle at the high frequency which is related to the ohmic resistance (Rs, the internal resistance of electrode and electrolyte), the surface layer (SEI film) resistance (Rf) and the charge transfer resistance at the electrode/electrolyte interface (Rct), and a straight line at the low frequency, which is related to lithium ion diffusion resistance (Warburg resistance).28 As shown in Fig. 6e, the much smaller semicircle diameter of Fe3O4/(TiO2)70 SPs relative to TiO2 SPs indicates a lower Rct, while the steeper line suggests a lower Warburg resistance.15 After the cycling test, as shown in Fig. 6f, the semicircle diameters in the Nyquist plots of the Fe3O4/(TiO2)70 and TiO2 SPs were both reduced, indicating the charge transfer resistance is reduced during cycling. The reducing trend of the charge transfer resistance may be attributed to the activation and the wetting of the electrode materials with the electrolyte. Moreover, the Rs, Rf and Rct of Fe3O4/(TiO2)70 are all significantly lower than those of TiO2 SPs after cycling. It is obvious that the resistance of the doped-SPs is significantly reduced due to the higher conductivity of Fe3O4. Note that the line slopes of the Fe3O4/(TiO2)70 and TiO2 SPs were both decreased (Fig. 6f), indicating that the Warburg resistance was increased after cycling. This may be attributed to the decrease in the porosity of SPs arising from structural reconstruction occurring during repeated lithiation and delithiation. Despite the decreased ion diffusion ability upon cycling, we surmise that the significantly increased electron transport could largely increase the utilization efficiency of the active materials, thereby improving the lithium storage properties.
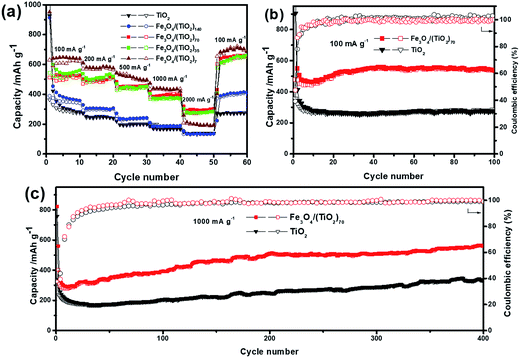
The rate performances of the SPs with different doping levels at varying current densities are shown in Fig. 7a. With the increase of current densities from 100 to 2000 mA g−1, the discharge specific capacities of all SPs start to decline, and the discharge specific capacity can be restored to the original, or even higher capacity when the current densities are switched back to 100 mA g−1. Such a result shows that the SPs have excellent rate capabilities, indicating the good structural stability of the assembled superstructures. It is worth noting that the SPs with different doping levels exhibit different rate performances in terms of capacity changes. Due to the low doping level, the capacities of Fe3O4/(TiO2)140 are only slightly improved compared with those of the pristine TiO2 SPs, especially at high current densities of 1000 and 2000 mA g−1. This result is not surprising considering the low doping level of Fe3O4 NPs. When the doping level of Fe3O4 NPs is doubled, the average discharge capacities of Fe3O4/(TiO2)70 are 587.4, 498.9, 457.3, 394.8 and 298.6 mA h g−1 at 100, 200, 500, 1000 and 2000 mA g−1, respectively, with the corresponding average charge capacities of 506.6, 487.9, 445.5, 392.5, 284.1 mA h g−1, indicating a significant enhancement in the lithium storage properties. Surprisingly, further increasing the doping levels by 2 and 10 times in Fe3O4/(TiO2)35 and Fe3O4/(TiO2)7 did not significantly increase the capacity compared with the case of Fe3O4/(TiO2)70, suggesting a non-monotonic variation in capacity with respect to the change of the doping levels. Notably, the Fe3O4/(TiO2)7 even deliver a much lower discharge capacity than Fe3O4/(TiO2)70 and Fe3O4/(TiO2)35 at the large current density of 2000 mA g−1, indicating the adverse effects of high doping for high rate performance. This may be attributed to the irregularly shaped superstructure arising from the phase separation between TiO2 NRs and Fe3O4 NPs.
Fig. 7b shows the cycling performances of the Fe3O4/(TiO2)70 and TiO2 SPs at 100 mA g−1. While both Fe3O4/(TiO2)70 and TiO2 SPs deliver low initial coulombic efficiencies, the coulombic efficiencies gradually approach nearly 100% in subsequent cycles, indicating reasonably good cycling stability of the SPs. The reversible discharge capacities of the Fe3O4/(TiO2)70 and TiO2 SPs over 100 cycles are 526.0 and 277.5 mA h g−1, respectively, with the corresponding charge capacities of 525.8 and 277.7 mA h g−1. In addition to the significantly enhanced capacity, the Fe3O4/(TiO2)70 SPs exhibit a different capacity trend compared with the TiO2 SPs. Namely, the capacities of the Fe3O4/(TiO2)70 SPs decrease initially during the first 10 cycles, which is followed by a gradual capacity increase until around 40 cycles. The capacity increase with cycling may be caused by the presence of Fe3O4 NPs. Such a capacity recovery phenomenon associated with Fe3O4 electrodes is generally ascribed to the reversible growth of a polymeric gel-like SEI film resulting from kinetically activated electrolyte degradation and increasing activity of Fe3O4 during the conversion reaction process.58,59 Furthermore, the Fe3O4/(TiO2)70 SPs exhibit remarkable long-term cycling stability at a higher current density. As shown in Fig. 7c, the cell consisting of the Fe3O4/(TiO2)70 SPs can maintain a reversible discharge and charge capacity of around 550 mA h g−1 at 1000 mA g−1 after 400 cycles, which is significantly better than TiO2 SPs tested under the same conditions.
To explore the structural evolution of the Fe3O4/(TiO2)70 SPs during cycling, ex situ FESEM measurements were performed after 400 cycles at 1000 mA g−1. Before the measurements, the electrodes were immersed in acetonitrile to remove PVDF. As shown in Fig. 8a and S8,† FESEM images confirm that the spherical morphology of SPs was retained after cycling, indicating the Fe3O4/(TiO2)70 SPs maintain an excellent structural stability during repeated lithium insertion/extraction. The dense and roughened surface of the Fe3O4/(TiO2)70 SPs could be due to SEI film covering (Fig. S8†). As shown in Fig. 8b, the STEM images and the corresponding elemental mappings clearly demonstrate the uniform distribution of Ti, Fe and C elements in the Fe3O4/(TiO2)70 SPs after cycling. The XRD pattern in Fig. S9† confirms the crystal phase stability of anatase after cycling. The above results show the stability of the doped-SPs.
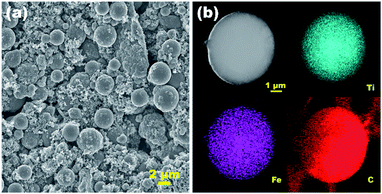 | ||
| Fig. 8 (a) Ex situ FESEM image and (b) STEM image and Ti, Fe, C elemental mappings of the Fe3O4/(TiO2)70 SPs after cycling. | ||
The lithium storage performance of Fe3O4/(TiO2)70 SPs was comparable to or higher than that of previously reported works related to TiO2-based composite anode materials (Table S2†). As a matter of fact, compared with those TiO2-based anode materials,32–39 the integrated Fe3O4 content in our Fe3O4/(TiO2)70 SPs is the lowest, indicating that the excellent lithium storage performance is not directly related to the content of the doped component. The fact that Fe3O4/(TiO2)70 SPs display the best overall electrochemical performance among various SPs explored not only shows that doping TiO2 SPs with Fe3O4 NPs is a feasible and efficient way to boost the electrochemical performance, but also suggests an appropriate doping level is of critical importance for achieving the desired performance enhancement. Although Fe3O4 has a higher theoretical specific capacity than TiO2, the improved capacity in Fe3O4/(TiO2)70 SPs cannot be simply explained by the added capacity contributed by the integrated Fe3O4 NPs. According to the theoretical capacity of TiO2, Fe3O4 and carbon (calculated in low-crystallized carbon63), the theoretical capacity of the Fe3O4/(TiO2)70 SPs is calculated to be only 276.2 mA h g−1 (167.5 × 82.0% + 1000 × 7.7% + 600 × 10.3%), which is much lower than the experimentally measured capacity (550 mA h g−1 at 1000 mA−1 after 400 cycles) and even lower than the average capacity at 2000 mA g−1 (298.6 mA h g−1). From the theoretical calculation, the proportion of TiO2, Fe3O4 and carbon that contributes to the experimentally measured capacity (550 mA h g−1) is 25.0, 14.0 and 11.2%, respectively. The sum of the theoretical proportions is less than 100% due to the presence of the extra capacity. The extra capacity over the theoretical capacity might be partially attributed to interfacial storage,64,65 as the porous structures and high surface areas of Fe3O4/(TiO2)70 SPs could provide many available extra sites for lithium storage at the interfaces.64 Nonetheless, the theoretical contribution of Fe3O4 dopants is limited, indicating that a synergistic effect, presumably originating from the strong interfacial interactions between TiO2 NRs and Fe3O4 NPs, plays an important role in enhancing the electrochemical performance of Fe3O4 NP-doped TiO2 SPs. Additionally, the non-monotonic performance variation with the change of doping levels implies that an appropriate doping level is necessary to achieve the strong synergistic effect.
The significantly enhanced capacity, excellent cycling performance and superior rate capacity of the Fe3O4 NP doped-TiO2 NR SPs can be attributed to the following aspects contributed by the integrated Fe3O4 NPs: (1) the integrated Fe3O4 NPs can improve the poor conductivity of TiO2 SPs; (2) the Fe3O4 NPs with a higher theoretical capacity can contribute to the capacity of SPs; and (3) the porosity and stability of the TiO2 matrix can provide enough stable void space to buffer the volume expansion of the Fe3O4 NPs, improving cycling stability. More importantly, unlike previous TiO2-based composite anode materials,32–39 the unique architecture of our doped-SPs has the potential to maximize the contact, and therefore interactions, between Fe3O4 and TiO2. Therefore, a stronger synergistic effect is expected to develop in such doped-SPs. In addition, the ligand-carbonization step at 500 °C could further strengthen the intimate contact between Fe3O4 and TiO2, potentially at the atomic level, which may contribute largely to the strong synergistic effect. The strong synergistic effect further enhances the interfacial lithium storage of SPs. Although our doped-SPs possess advantageous structural features for achieving the strong synergistic effect, we should stress that revealing the exact origin is not easy, which may require various in situ characterization techniques to probe the dynamic interactions between Fe3O4 and TiO2 at the atomic level. Finally, the inherent advantages of SPs may also play important roles in enhancing the electrochemical performance. These include the stable electrochemical performance due to the formation of stable SEI interfaces on the outer surface,7 and the close interfacial contact between the NPs and electrolytes due to hierarchical pore size distribution and large specific surface area.47 In addition, the carbon-coating layers transformed from the OA ligand molecules on the surface of TiO2 NRs and Fe3O4 NPs improve the conductivity of SPs and prevent aggregation of TiO2 and Fe3O4 components during repeated cycling.7
Conclusions
We have successfully synthesized the Fe3O4 NP doped-TiO2 NR SPs via a colloidal co-assembly route followed by calcination. Electrochemical experiments clearly indicate the structural advantages of the Fe3O4 NP doped-TiO2 NR SPs as anodes for LIBs. The Fe3O4 NP doped-TiO2 NR SPs exhibit highly enhanced electrochemical properties such as high specific capacity, rate capacity and stable cycle performance of lithium storage. The structural characteristics of the doped-SPs enable excellent lithium storage properties due to the synergistic effect between the integrated Fe3O4 NPs and the porous TiO2 NR matrix. Importantly, our studies reveal that an optimized doping level is necessary to achieve a strong synergistic effect and therefore enhanced electrochemical performance. Moreover, we have demonstrated that doping TiO2 SPs with a small amount of Fe3O4 NPs can boost the lithium storage properties. The doping assembly strategy can be extended to other doped systems, such as metal/metal oxides, metal/metal sulphides and metal sulphide/metal oxides, and so on. These doped-SP systems present broad prospects for practical applications in various areas.Conflicts of interest
There are no conflicts to declare.Acknowledgements
A. D. acknowledges financial support from MOST (2017YFA0207303 and 2014CB845602), Key Basic Research Program of Science and Technology Commission of Shanghai Municipality (17JC1400100), Shanghai International Science and Technology Cooperation Project (15520720100), and NSFC (21733003 and 21373052). B. X. acknowledges financial support from State Key Laboratory of Molecular Engineering of Polymers at Fudan University (K2017-22).Notes and references
- D. Larcher and J. M. Tarascon, Nat. Chem., 2015, 7, 19 CrossRef CAS PubMed.
- S. H. Yu, S. H. Lee, D. J. Lee, Y. E. Sung and T. Hyeon, Small, 2015, 7, 2146 Search PubMed.
- F. Bai, D. S. Wang, Z. Y. Huo, W. Chen, L. P. Liu, X. Liang, C. Chen, X. Wang, Q. Peng and Y. D. Li, Angew. Chem., Int. Ed., 2007, 46, 6650 CrossRef CAS PubMed.
- J. Q. Zhuang, H. M. Wu, Y. G. Yang and Y. C. Cao, Angew. Chem., Int. Ed., 2008, 47, 2208 CrossRef CAS PubMed.
- D. L. Liu, F. Zhou, C. C. Li, T. Zhang, H. H. Zhang, W. P. Cai and Y. Li, Angew. Chem., Int. Ed., 2015, 54, 9596–9600 CrossRef CAS PubMed.
- J. E. Park, D. R. Hickey, S. Jun, S. Kang, X. Hu, X. J. Chen and S. J. Park, Adv. Funct. Mater., 2016, 26, 7791–7798 CrossRef CAS.
- S. H. Lee, S. H. Yu, J. E. Lee, A. Jin, D. J. Lee, N. Lee, H. Jo, K. Shin, T. Y. Ahn, Y. W. Kim, H. Choe, Y. E. Sung and T. Hyeon, Nano Lett., 2013, 13, 4249 CrossRef CAS PubMed.
- M. Cargnello, A. C. Johnston-Peck, B. T. Diroll, E. Wong, B. Datta, D. Damodhar, V. V. T. Doan-Nguyen, A. A. Herzing, C. R. Kagan and C. B. Murray, Nature, 2015, 524, 450 CrossRef CAS PubMed.
- A. G. Dong, Sci. Bull., 2015, 60, 1964 CrossRef.
- D. Deng, M. G. Kim, J. Y. Lee and J. Cho, Energy Environ. Sci., 2009, 2, 818 CAS.
- T. Song and U. Paik, J. Mater. Chem. A, 2016, 4, 14 CAS.
- M. Ge, C. Cao, J. Huang, S. Li, Z. Chen, K. Q. Zhang, S. S. A. Deyab and Y. Lai, J. Mater. Chem. A, 2016, 4, 6772 CAS.
- S. J. Park, H. Kim, Y. J. Kim and H. Lee, Electrochim. Acta, 2011, 56, 5355 CrossRef CAS.
- L. Gao, X. R. Li, H. Hu, G. J. Li, H. W. Liu and Y. Yu, Electrochim. Acta, 2014, 120, 231 CrossRef CAS.
- Y. F. Sun, J. B. Zhu, L. F. Bai, Q. Y. Li, X. Zhang, W. Tong and Y. Xie, Inorg. Chem. Front., 2014, 1, 58 RSC.
- X. Bai, T. Li, Y. X. Qi, X. P. Gao, L. W. Yin, H. Li, H. L. Zhu, N. Lun and Y. J. Bai, Electrochim. Acta, 2015, 169, 241 CrossRef CAS.
- H. Geng, H. Ming, D. Ge, J. Zheng and H. Gu, Electrochim. Acta, 2015, 157, 1 CrossRef CAS.
- H. Liu, W. Li, D. Shen, D. Zhao and G. Wang, Adv. Mater. Interfaces, 2015, 2, 1500239 CrossRef.
- S. Gao, Y. Yan and G. Chen, ACS Sustainable Chem. Eng., 2016, 4, 844 CrossRef CAS.
- Y. Cheng, Z. Chen, H. Wu, M. Zhu and Y. Lu, Adv. Funct. Mater., 2016, 26, 1338 CrossRef CAS.
- R. Wu, S. Shen, G. Xia, F. Zhu, C. Lastoskie and J. Zhang, ACS Appl. Mater. Interfaces, 2016, 8, 19968 CAS.
- H. B. Huang, Y. Yang, L. H. Chen, Y. Wang, S. Z. Huang, J. W. Tao, X. T. Ma, T. Hasan, Y. Li, Y. Xu and B. L. Su, Nanoscale, 2016, 8, 10928 RSC.
- C. Chen, B. Zhang, L. Miao, M. Yan, L. Mai, Y. Huang and X. Hu, J. Mater. Chem. A, 2016, 4, 8172 CAS.
- L. Y. Wang, X. Bai, Y. Wu, N. Lun, Y. X. Qi and Y. J. Bai, Electrochim. Acta, 2016, 212, 155 CrossRef CAS.
- W. Li, F. Wang, Y. Liu, J. Wang, J. Yang, L. Zhang, A. A. Elzatahry, D. Al-Dahyan, Y. Xia and D. Zhao, Nano Lett., 2015, 15, 2186 CrossRef CAS PubMed.
- Z. Zhang, L. Zhang, W. Li, A. Yu and P. Wu, ACS Appl. Mater. Interfaces, 2015, 7, 10395 CAS.
- S. Yang, C. Cao, P. Huang, L. Peng, Y. Sun, F. Wei and W. Song, J. Mater. Chem. A, 2015, 3, 8701 CAS.
- S. Jiang, R. Wang, M. Pang, H. Wang, S. Zeng, X. Yue, Y. Ni, Y. Yu, J. Dai, S. Qiu and Z. Zhang, Electrochim. Acta, 2015, 182, 406 CrossRef CAS.
- S. Q. Guo, M. M. Zhen, L. Liu and Z. H. Yuan, Chem.–Eur. J., 2016, 22, 11943 CrossRef CAS PubMed.
- P. Zheng, T. Liu, Y. Su, L. Zhang and S. Guo, Sci. Rep., 2016, 6, 36580 CrossRef CAS PubMed.
- Y. Liu, A. A. Elzatahry, W. Luo, K. Lan, P. Zhang, J. Fan, Y. Wei, C. Wang, Y. Deng, G. Zheng, F. Zhang, Y. Tang, L. Mai and D. Zhao, Nano Energy, 2016, 25, 80 CrossRef CAS.
- S. Li, M. Wang, Y. Luo and J. Huang, ACS Appl. Mater. Interfaces, 2016, 8, 17343 CAS.
- H. Xu, X. D. Zhu, K. N. Sun, Y. T. Liu and X. M. Xie, Adv. Mater. Interfaces, 2015, 2, 1500239 CrossRef.
- H. Wang, G. Wang, S. Yuan, D. Ma, Y. Li and Y. Zhang, Nano Res., 2015, 8, 1659 CrossRef CAS.
- D. Zhao, Q. Hao and C. Xu, Electrochim. Acta, 2016, 211, 83 CrossRef CAS.
- L. Gao, S. Li, D. Huang, Y. Shen and M. Wang, Electrochim. Acta, 2015, 182, 529 CrossRef CAS.
- G. Luo, W. Liu, S. Zeng, C. Zhang, X. Yu, Y. Fang and L. Sun, Electrochim. Acta, 2015, 184, 219 CrossRef CAS.
- S. Guo, J. Liu, S. Qiu, W. Liu, Y. Wang, N. Wu, J. Guo and Z. Guo, J. Mater. Chem. A, 2015, 3, 23895 CAS.
- R. Dai, A. Zhang, Z. Pan, A. M. Al-Enizi, A. A. Elzatahry, L. Hu and G. Zheng, Small, 2016, 12, 2792 CrossRef CAS PubMed.
- J. Y. Liao, B. De Luna and A. Manthiram, J. Mater. Chem. A, 2016, 4, 801 CAS.
- X. Li, Y. Chen, H. Wang, H. Yao, H. Huang, Y. W. Mai, N. Hu and L. Zhou, Adv. Funct. Mater., 2016, 26, 376 CrossRef CAS.
- Z. Yi, Q. Han, P. Zan, Y. Cheng, Y. Wu and L. Wang, J. Mater. Chem. A, 2016, 4, 12850 CAS.
- X. Wang, L. Fan, D. Gong, J. Zhu, Q. Zhang and B. Lu, Adv. Funct. Mater., 2016, 26, 1104 CrossRef CAS.
- D. Wu, R. Yang, Q. Sun, L. Shen, W. Ji, R. Shen, M. Jiang, W. Ding and L. Peng, Electrochim. Acta, 2016, 211, 832 CrossRef CAS.
- X. Zhang, H. Chen, Y. Xie and J. Guo, J. Mater. Chem. A, 2014, 2, 3912 CAS.
- J. Guo, X. Zhang, Y. Sun, H. Liu and X. Zhang, Mater. Lett., 2017, 195, 104 CrossRef CAS.
- H. Ren, R. Yu, J. Wang, Q. Jin, M. Yang, D. Mao, D. Kisailus, H. Zhao and D. Wang, Nano Lett., 2014, 14, 6679 CrossRef CAS PubMed.
- J. Jin, S. Z. Huang, J. Shu, H. E. Wang, Y. Li, Y. Yu, L. H. Chen, B. J. Wang and B. L. Su, Nano Energy, 2015, 16, 339 CrossRef CAS.
- B. Y. Guan, L. Yu, J. Li and X. W. D. Lou, Sci. Adv., 2016, 2, e1501554 Search PubMed.
- H. Xie, L. Hu, F. Wu, M. Chen and L. Wu, Adv. Sci., 2016, 3, 1600162 CrossRef PubMed.
- M. Yarali, E. Biçer, S. A. Gürsel and A. Yürüm, Electrochim. Acta, 2016, 220, 453 CrossRef CAS.
- W. Yu, Y. Liu, N. Cheng, B. Cai, K. K. Kondamareddy, S. Kong, S. Xu, W. Liu and X. Z. Zhao, Electrochim. Acta, 2016, 220, 398 CrossRef CAS.
- W. Zhang and D. Liu, Electrochim. Acta, 2015, 156, 53 CrossRef CAS.
- J. Zheng, G. Ji, P. Zhang, X. Cao, B. Wang, L. Yu and Z. Xu, Chem.–Eur. J., 2015, 21, 18309 CrossRef CAS PubMed.
- C. Wang, F. Wang, Y. Zhao, Y. Li, Q. Yue, Y. Liu, Y. Liu, A. A. Elzatahry, A. Al-Enizi, Y. Wu, Y. Deng and D. Zhao, Nano Res., 2016, 9, 165 CrossRef CAS.
- X. L. Cheng, M. Hu, R. Huang and J. S. Jiang, ACS Appl. Mater. Interfaces, 2014, 6, 19176 CAS.
- Y. Wang, L. Zhang, Y. Wu, Y. Zhong, Y. Hu and X. W. D. Lou, Chem. Commun., 2015, 51, 6921 RSC.
- W. Zhang, X. Li, J. Liang, K. Tang, Y. Zhu and Y. Qian, Nanoscale, 2016, 8, 4733 RSC.
- Y. Wang, Q. Qu, Y. Han, T. Gao, J. Shao, Z. Zuo, W. Liu, Q. Shi and H. Zheng, J. Mater. Chem. A, 2016, 4, 10314 CAS.
- J. Park, K. An, Y. Hwang, J. G. Park, H. J. Noh, J. Y. Kim, J. H. Park, N. M. Hwang and T. Hyeon, Nat. Mater., 2004, 3, 891 CrossRef CAS PubMed.
- Y. D. Liu, A. W. Tang, Q. Zhang and Y. D. Yin, J. Am. Chem. Soc., 2015, 137, 11327 CrossRef CAS PubMed.
- K. S. Sing, D. H. Everett, R. A. W. Haul, L. Moscou, R. A. Pierotti, J. Rouquerol and T. Siemieniewska, Pure Appl. Chem., 1985, 57, 603 CrossRef CAS.
- H. Higuchi, K. Uenae and A. Kawakami, J. Power Sources, 1997, 68, 212 CrossRef CAS.
- J. Y. Shin, D. Samuelis and J. Maier, Adv. Funct. Mater., 2011, 21, 3464 CrossRef CAS.
- Z. Xing, Z. Ju, J. Yang, H. Xu and Y. Qian, Nano Res., 2012, 5, 477 CrossRef CAS.
Footnote |
| † Electronic supplementary information (ESI) available: Calculation of ratio, TEM images, HRTEM image, EDX spectrum, FESEM images, galvanostatic discharge/charge curves, equivalent circuits, impedance parameters, XRD pattern, and lithium storage performance comparison. See DOI: 10.1039/c7se00460e |
| This journal is © The Royal Society of Chemistry 2018 |

