
 Open Access Article
 This Open Access Article is licensed under a
 Creative Commons Attribution 3.0 Unported Licence
On the role of Ce in CO2 adsorption and activation over lanthanum species†
Xinyu
Li‡
ab,
Zhi-Jian
Zhao‡
ab,
Liang
Zeng
ab,
Jiubing
Zhao
ab,
Hao
Tian
ab,
Sai
Chen
ab,
Kang
Li
ab,
Sier
Sang
ab and
Jinlong
Gong
 *ab
*ab
aKey Laboratory for Green Chemical Technology of Ministry of Education, School of Chemical Engineering and Technology, Tianjin University, Tianjin 300072, China. E-mail: jlgong@tju.edu.cn
bCollaborative Innovation Center of Chemical Science and Engineering (Tianjin), Tianjin 300072, China
First published on 23rd February 2018
Abstract
La2O3 exhibits good performance for various catalytic applications, such as oxidative coupling of methane (OCM) and dry reforming of methane (DRM), during which coke formation may lead to the deactivation of catalysts. Typically, the reaction between CO2 adsorbed on La2O3 and coke is the rate-determining step of the coke elimination process. This paper describes the influence of Ce addition on the CO2 adsorption and activation over La2O3. Combined with in situ and ex situ characterization and density functional theory (DFT) calculation, we show that Ce addition promotes the formation of bidentate carbonate on La2O3via tuning CO2 adsorption energy. In addition, Ce addition adjusts the ratio of bidentate/monodentate carbonate, and affects the ratio of hexagonal/monoclinic La2O2CO3 on the binary oxides. DRM is used as a probe reaction to examine the coke elimination performance of Ce–La binary oxide. It is found that when the Ce/La ratio reaches the optimal value (0.15), Ce–La binary oxide has the highest CO2 adsorption energy and predominantly promotes the formation of bidentate carbonate, and hence possesses the highest basicity above 700 °C and finally exhibits the best coke elimination performance.
Introduction
La2O3, as a common rare earth oxide with strong basicity, is generally used as a support or promotor to facilitate CO2 adsorption and activation.1–4 Typically, CO2 adsorbs on the surface of La2O3 and subsequently converts La2O3 to La2O2CO3.5,6 The formed La2O2CO3 species actively reacts with coke thus enhancing catalyst stability.5–8 Additionally, La2O2CO3 plays a significant role in the oxidative coupling of methane (OCM), and CH4 can be activated over the surface of La2O2CO3.9,10 La2O2CO3 has three phases including tetragonal (I type), monoclinic (Ia type), and hexagonal (II type).11,12 As treatment temperature increases, phase transformation happens. Transformation from I-La2O2CO3 to Ia-La2O2CO3 takes place readily, namely Ia-La2O2CO3 is the monoclinic distortion of I-La2O2CO3.12,13 Conversion of Ia-La2O2CO3 to II-La2O2CO3 is a slow process below 600 °C.12 And II-La2O2CO3 decomposes to La2O3 at about 750 °C.14 It has been reported that the orientation of carbonate ions is closely related to the crystalline phase of La2O2CO3,11,15 both of which can affect the catalytic performance.16,17 It has been found that mixing ZnO with La2O2CO3 increases the basicity of the La2O2CO3 material.18 In addition, Metiu et al. reported that dopants can affect CH4 activation and dissociation on lanthanum oxide and hence improve the OCM performance.19,20Generally, ceria possesses good redox properties and has various applications.21,22 It has been extensively used as an oxygen carrier23 and is a necessary component of catalysts used in reforming processes,24–26 water–gas shift reaction,27 CO oxidation,28 and soot combustion.29,30 In order to improve the oxygen storage capacity (OSC) and oxygen mobility (OM) of ceria, an appropriate dopant is typically mixed with ceria to enhance the OSC/OM of ceria.31–33 La3+, as an aliovalent dopant, has been extensively applied to enhance the OSC/OM of ceria,34–36 during which oxygen vacancies can be formed due to the charge compensation mechanism.37,38 It should be noted that the reported synergy of Ce–La binary oxide is based on the fact that La addition can largely promote the formation of oxygen vacancy on ceria,36–38 while this paper investigates the influence of Ce addition on the properties of lanthanum species.
Since the release or uptake of lattice oxygen is closely related to an oxygen/steam atmosphere, herein an oxygen/steam atmosphere is excluded to minimize the involvement of oxygen vacancy. Thus, CO2 as a soft oxidant is selected due to its weak oxidation capacity compared with O2 or H2O molecule. Given that CO2 adsorbs on the surface of La2O3 and reacts with La2O3 to form La2O2CO3,5,6 the effect of Ce addition on the properties of La2O2CO3 formed under the mild oxidative conditions has been investigated. For the OCM reaction, coke deposition is negligible in an oxidative atmosphere, but it takes place under oxygen lean conditions.39,40 When O2 is replaced by CO2 to rule out the influence of oxygen vacancy, dry reforming of methane (DRM) mainly occurs, during which CH4 reacts with CO2 to form syngas (CO and H2). For the DRM reaction, coke deposition and sintering of metal particles can lead to the deactivation of catalysts.4,41 Herein, the DRM reaction is used as a probe reaction to examine the coke elimination performance of Ce–La binary oxides.
This paper demonstrates the influence of Ce addition on the properties of lanthanum species, including the adsorption mode of CO2 (bidentate carbonate and monodentate carbonate) and the crystalline phase of lanthanum oxycarbonate (hexagonal La2O2CO3 and monoclinic La2O2CO3) formed after CO2 and CH4 adsorption. In situ diffuse reflectance infrared Fourier transform spectroscopy (DRIFTS) measurements are applied to investigate surface species on the Ce–La binary oxide during the process of CO2/CH4 adsorption. The physical–chemical properties of the catalysts prior to and after CO2/CH4 adsorption are investigated by X-ray diffraction (XRD), X-ray photoelectron spectroscopy (XPS), Raman spectra, N2-physisorption, transmission electron microscopy (TEM), and H2 temperature-programmed reduction (H2-TPR). Periodic density functional theory (DFT) calculations are carried out to estimate CO2 adsorption energy on Ce–La binary oxides. DRM is selected as the probe reaction to examine the performance of coke elimination, and CO2 temperature-programmed desorption (CO2-TPD) and thermogravimetric analysis (TGA) are applied to examine the basicity of Ce–La binary oxides and properties of the deposited coke during the DRM process.
Results and discussion
Textural properties of Ce–La binary oxide
Table 1 sums up the textural properties of the samples with different Ce/La ratios at the moment of “0 min” (Fig. 1, see details in the Experimental section). XRD patterns of a series of Ce–La binary oxides at “0 min” are shown in Fig. 2a and b. Hexagonal lanthanum oxycarbonate (II-La2O2CO3, JCPDF#37-0804) acts as the dominant species for the series of Ce–La binary oxides. When the Ce/La ratio reaches 0.10 and higher, monoclinic lanthanum oxycarbonate (Ia-La2O2CO3, JCPDF#48-1113) can be detected but is minimal. Results show that the peaks of La2O2CO3 gradually migrate to a higher degree (Fig. 2b), indicating that lattice parameters decrease correspondingly (Table 1). Since the ionic radius of either Ce3+ (0.101 nm) or Ce4+ (0.097 nm) is smaller than that of La3+ (0.11 nm),37 the decrease of lattice parameters could be attributed to the fact that Ce-ions are doped into the lattice of La2O2CO3.42 Furthermore, the surface areas of the series of Ce–La binary oxides were obtained through the N2 sorption isotherm method. With the increase of Ce/La ratios, surface area gradually decreases, which is related to the decrease of lanthanum composition in the binary oxide and the small surface area of the cerium composition. The types of carbonate, formed upon CO2 adsorption, have a close relationship with the crystalline phases of La2O2CO3, which will be discussed in the following part.| Sample | Molar ratio of Ce/La | Lattice parameterc (Å) | Surface aread (m2 g−1) | Average pore diameterd (nm) | Pore volumed (cm3 g−1) | ||
|---|---|---|---|---|---|---|---|
| Bulka | Surfaceb | a | b | ||||
| a Determined by ICP-OES. b Determined by XPS. c Determined by XRD patterns prior to CH4 adsorption. d Determined by N2-physisorption. | |||||||
| 0Ce–LOC | 0 | 0 | 4.078 | 15.950 | 47 | 28.4 | 0.22 |
| 0.05Ce–LOC | 0.049 | 0.21 | 4.075 | 15.940 | 43 | 16.1 | 0.20 |
| 0.10Ce–LOC | 0.102 | 0.18 | 4.074 | 15.933 | 33 | 14.4 | 0.14 |
| 0.15Ce–LOC | 0.149 | 0.23 | 4.068 | 15.923 | 25 | 11.6 | 0.09 |
| 0.20Ce–LOC | 0.203 | 0.22 | 4.065 | 15.854 | 14 | 10.0 | 0.08 |
 | ||
| Fig. 1 Overview of the experimental method for in situ and ex situ reaction conditions during measurement. | ||
 | ||
| Fig. 2 XRD patterns of the series of Ce–La binary oxide prior to and after CH4 adsorption for 30 min. (a) Full scale at “0 min”, (b) details with enlarged scale at “0 min”, (c) full scale at “30 min” and (d) details with enlarged scale at “30 min”. Color bars in (b) and (d) are auxiliary lines. | ||
The valence state of cerium (Fig. 3) and the surface elemental composition (Table 1) were also examined. On the basis of literature reports,43–47 the Ce 3d region consists of five doublets. The spin–orbit components with unprimed labels, v and u, are ascribed to the primary Ce 3d5/2 and Ce 3d3/2 states while other doublets represent satellite features arising from the Ce 3d5/2 and Ce 3d3/2 ionization.44,46,48 The doublets labeled v0/u0 and v′/u′ are characteristic of Ce3+, while the remaining doublets labeled v/u, v′′/u′′ and v′′′/u′′′ are characteristic of Ce4+.44,46 The Ce3+ surface concentration was calculated via the following equation:44,48
 | (1) |
 | ||
| Fig. 3 Fitting of core-level Ce 3d XPS profiles of (a) the series of Ce–La binary oxide and (b) CeO2. | ||
The morphology and structure of Ce–La binary oxides with different Ce/La ratios were characterized via TEM (Fig. S1 in the ESI†). Particles randomly distribute along the surface of La2O2CO3, and some of them are confirmed as CeO2. It can be found that small particles have continuous lattice fringes with the oxide hosts, indicating the formation of the solid solution on the interface between the observed small particles and oxide hosts.37 Since CeO2 diffraction peaks are absent in XRD patterns (Fig. 2), UV-vis is applied to measure the indirect band gap of CeO2, which reflects variation tendency in the size of CeO2 particles located on the surface of the samples.49,50 The indirect band gaps of nonoriented polycrystalline CeO2 and La2O3 are 3.19 eV,49 and 5.2 eV,51 respectively. As shown in Fig. S2 in the ESI,† the indirect band gap of CeO2 migrates to a lower value with the increase of Ce/La ratios, indicating the corresponding increment in the size of CeO2 particles on the surface of binary oxides. In addition, the variation tendency of the increment remains the same when the Ce/La ratio reaches 0.15 and 0.20. It is reported that the concentration of Ce3+ increases with the reduction in CeO2 particle size.47 Therefore, the obtained results of UV-vis (Fig. S2 in the ESI†) have a similar variation tendency with the results of XPS (Fig. 3).
In situ DRIFTS measurements
In situ DRIFTS measurements are applied in order to identify surface intermediates present on the Ce–La binary oxide samples from “0 min” to “30 min” (see the definition in the Experimental section), during which coke is formed via CH4 decomposition and will further react with carbonate formed after CO2 adsorption (Fig. 1). In situ DRIFTS spectra are shown in Fig. 4, and corresponding contour graphs are inserted in the x–y planes of Fig. 4 and listed alone in Fig. S3 in the ESI.† The band at 1300 cm−1 corresponds to the C–H bending of gaseous methane,24,52,53 and it can be found on all samples. The strong band at 1563 cm−1 corresponds to bidentate carbonate with the coexistence of bands at 1300, 1029 and 856 cm−1,15,54,55 while the strong band at 1345 cm−1 is ascribed to monodentate carbonate with the coexistence of bands at 1428, 1070 and 856 cm−1.15,54,55 In addition, bands at 1748 and 1796 cm−1 are overtones of C![[double bond, length as m-dash]](https://www.rsc.org/images/entities/char_e001.gif) O stretching vibration and CO32− stretching vibration.15
O stretching vibration and CO32− stretching vibration.15
 | ||
| Fig. 4 DRIFTS spectra for the series of Ce–La binary oxide during CH4 adsorption for 30 min. (a) 0Ce–LOC, (b) 0.05Ce–LOC, (c) 0.10Ce–LOC, (d) 0.15Ce–LOC, (e) 0.20Ce–LOC and (f) CeO2. | ||
For the series of La–Ce binary oxides, both bidentate carbonate and monodentate carbonate exist on the surface (Fig. 4 and S3 in the ESI†), while for CeO2, bidentate carbonate is absent (Fig. 4f and S3f in the ESI†). At “0 min”, the intensity of bidentate carbonate on La–Ce binary oxides increases as the Ce/La ratio increases from 0 to 0.15, reaches the maximum when the Ce/La ratio is 0.15, and finally decreases slightly when the Ce/La ratio reaches 0.20 (Fig. S3 and S4 in the ESI†). Simultaneously, the intensity of monodentate carbonate shows a variation tendency, which is opposite to the intensity of bidentate carbonate. Therefore, it is assumed that Ce addition can influence the CO2 adsorption mode on the surface of Ce–La binary oxide and promote the transformation from monodentate carbonate to bidentate carbonate.
When CO2 is adsorbed on La2O3 (30 min prior to “0 min” in Fig. 1), it reacts with La2O3 and then leads to the formation of La2O2CO3. During the in situ DRIFTS measurement (from “0 min” to “30 min” in Fig. 1), CH4 can be adsorbed on the surfaces of La2O2CO3 and dissociates to form coke under non-oxidative conditions,39,40 while coke will react with La2O2CO3 to form La2O3 and CO.5,8 For the series of Ce–La binary oxides, the intensity of bidentate carbonate keeps decreasing as time on stream goes by, while the intensity of monodentate carbonate remains stable (Fig. 5 and S3 in the ESI†). Therefore, bidentate carbonate is consumed to react with coke during the introduction of CH4. It is concluded that bidentate carbonate is active in the reaction with the coke, while monodentate carbonate is inactive (Fig. 4, S3 and S4 in the ESI†). If we use IB/IM (intensity of ∼1563 cm−1/intensity of ∼1345 cm−1) to evaluate the ratio of bidentate carbonate to monodentate carbonate, it is found that when the Ce/La ratio equals 0.15, Ce–La binary oxide possesses the highest ratio of IB/IM (Fig. 5). Considering that Ce addition can affect the ratio of IB/IM, it is assumed that Ce addition might affect the performance of coke elimination, which will be discussed in the following part.
 | ||
| Fig. 5 The intensity ratios of bidentate/monodentate carbonate in DRIFTS spectra as a function of time on stream. | ||
Influence on the crystalline phase
XRD patterns of the series of Ce–La binary oxides at “30 min” after reacting with CH4 are shown in Fig. 2c and d. The CeO2 phase remains absent indicating that cerium is well dispersed. By comparison of the XRD patterns of samples at “0 min” and “30 min”, the intensity of peaks ascribed to II-La2O2CO3 decreases significantly compared with Ia-La2O2CO3. In addition, it is observed that as the Ce/La ratio increases from 0 to 0.15, the decrease in the intensity of II-La2O2CO3 peaks becomes much more prominent. The consumption of II-La2O2CO3 during the CH4 adsorption indicates that II-La2O2CO3 is more active than Ia-La2O2CO3 for coke elimination. For the 0.15Ce–LOC sample, the intensity of II-La2O2CO3 is much lower than that of Ia-La2O2CO3 so that Ia-La2O2CO3 eventually becomes the dominant species on the sample, indicating that Ce addition can influence the decomposition of II-La2O2CO3 caused by the reaction with deposited coke.Raman spectra of samples at “30 min” are shown in Fig. 6, which are consistent with the XRD patterns. Peaks at 290, 333, 438, 451, 1052, and 1341 cm−1 correspond to Ia-La2O2CO3, while peaks at 355, 385, 740, and 1082 cm−1 are assigned to II-La2O2CO3.13,56,57 The intensity ratio of peaks at 355 cm−1/451 cm−1 can be used as a descriptor to evaluate the dominant surface species. When the Ce/La ratios are 0 and 0.05, the II-La2O2CO3 phase is the dominant surface species and Ia-La2O2CO3 phase is the subordinate. However, when the Ce/La ratio is higher than 0.10, Ia-La2O2CO3 acts as the dominant surface species. For 0.15Ce–LOC, it possesses the lowest intensity ratio of peaks at 355 cm−1/451 cm−1, indicating that the ratio of II-La2O2CO3/Ia-La2O2CO3 reaches the lowest level. It can be assumed that II-La2O2CO3 formed on the 0.15Ce–LOC sample has the fastest decomposition rate. Two additional peaks at 216 and 577 cm−1 are reported to be induced by the dopant,58 which verifies the existence of Ce3+ in the lattices of the samples.59,60
 | ||
| Fig. 6 Raman spectra of the series of Ce–La binary oxide upon CH4 adsorption for 30 min. | ||
DRIFTS results demonstrate that Ce addition is capable of facilitating the formation of bidentate carbonate, which is active for coke elimination. Based on the XRD patterns (Fig. 2) and Raman spectra (Fig. 6), with the decomposition of bidentate carbonate, the ratio of II-La2O2CO3 to Ia-La2O2CO3 will change correspondingly. Spivey et al. directly ascribed FTIR bands at 1509 cm−1 and 1367 cm−1 to II-La2O2CO3 and Ia-La2O2CO3, respectively.16 They concluded that only II-La2O2CO3 acts as a reactive species to eliminate coke while Ia-La2O2CO3 merely acts as a spectator species.16 However, Kawi et al. reported that Ia-La2O2CO3 mainly participated in coke elimination rather than II-La2O2CO3.61 Combined with results of XRD patterns, Raman spectra and in situ DRIFTS spectra, we could conclude that bidentate carbonate is active for coke elimination and closely related to the II-La2O2CO3 phase while monodentate carbonate is inactive for coke elimination and closely related to the Ia-La2O2CO3 phase.
Catalytic performance of coke elimination
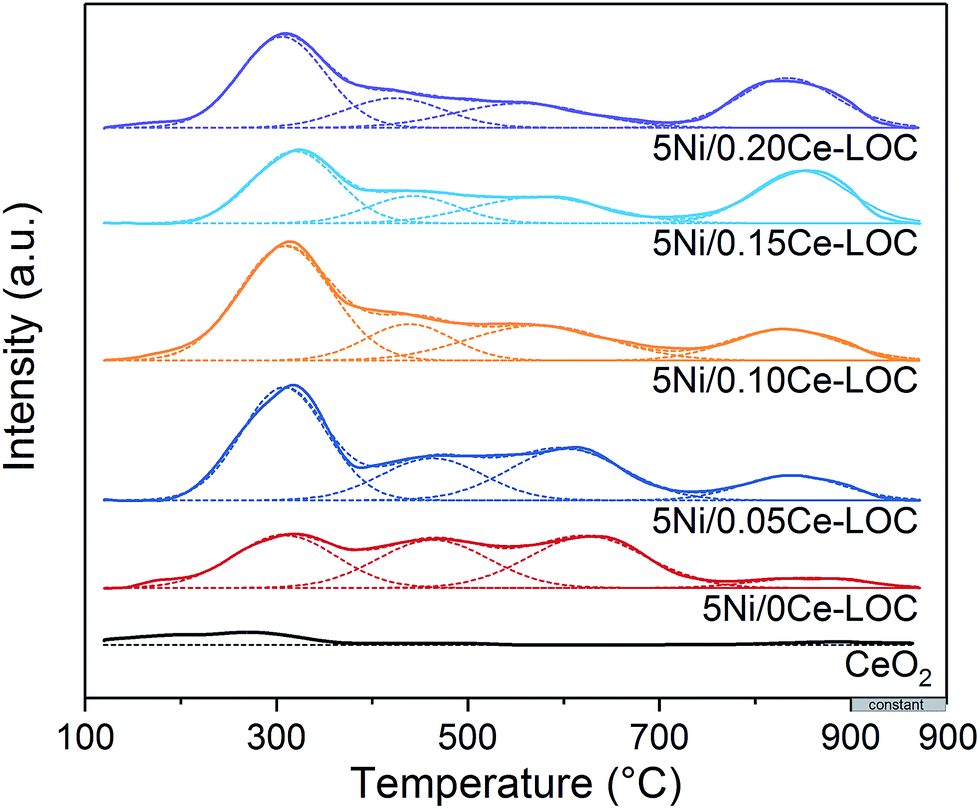
H2-TPR was carried out to investigate the decomposition behavior of La2O2CO3 formed on the series of Ce–La binary oxide under a H2 atmosphere. The H2-TPR profiles are shown in Fig. 7. It should be mentioned that the formation of a reduction peak in H2-TPR profiles is due to the reaction of H2 and CO2 released during the decomposition of La2O2CO3. Herein, peaks at 450–500 °C correspond to the desorption of chemisorbed CO2.9 With the increase of Ce/La ratios, the desorption temperature of chemisorbed CO2 increases to higher temperature. It indicates that Ce addition can strengthen the chemisorption of CO2 on the surface of lanthanum species, while peaks at around 700 °C correspond to the decomposition of II-La2O2CO3,62 since the phase transformation of Ia-La2O2CO3 to II-La2O2CO3 is complete at around 600 °C.12 With the increase of Ce/La ratios, the decomposition temperature of II-La2O2CO3 under the H2 atmosphere decreases to a lower temperature, indicating that Ce addition can promote the decomposition of II-La2O2CO3 under the H2 atmosphere, which is related to the activity in the reaction of II-La2O2CO3 and coke. | ||
| Fig. 7 H2-TPR profiles of the series of Ce–La binary oxides. | ||
In order to examine the performance of coke elimination, DRM reaction is used as a probe reaction, and then Ni particles are supported on the series of Ce–La binary oxide to produce coke. Ni loadings are fixed at 5 wt% for the series of Ce–La binary oxide to ensure that all catalysts exhibit similar CH4 conversions under appropriate reaction conditions.
CO2-TPD was employed to investigate the basicity of the Ni supported samples (Fig. 8). It has been extensively reported that the basicity of the support is beneficial to coke elimination.63 CO2 desorption will take place when the reaction temperature (600–650 °C) is higher than the desorption temperature. Thus, basicity with higher desorption temperature should be investigated. CO2-TPD profiles show that areas of peaks higher than 700 °C increase with the increment of Ce/La ratio, and reach the maximum when the Ce/La ratio is 0.15, and then decrease slightly when the Ce/La ratio is 0.20. For pure CeO2 as a reference, the area of the peak higher than 700 °C is negligible, which indicates that pure CeO2 itself has much weaker CO2 adsorption compared with Ce–La binary oxide. According to the DRIFTS spectra (Fig. 4, 5 and S3 in the ESI†), for the 0.15Ce–LOC sample, it has the highest intensity of bidentate carbonate during the CH4 adsorption. A previous study by Valange et al. has shown that bidentate carbonate has higher stability and hence higher basicity compared with monodentate carbonate.64 In addition, it has been reported that the decomposition temperature of II-La2O2CO3 is higher than 700 °C.13 Therefore, the desorption peaks higher than 700 °C can be ascribed to the decomposition of II-La2O2CO3. It should be mentioned that the atmosphere could affect the decomposition of La2O2CO3,13 hence there is a difference in the decomposition temperature of II-La2O2CO3 between CO2-TPD and H2-TPR (Fig. 7 and 8). For the 0.15Ce–LOC sample, it has the highest amount of bidentate carbonate after CO2 adsorption and the highest basicity above 700 °C. It indicates that bidentate carbonate has a close relationship with II-La2O2CO3. Based on these facts, it is assumed that Ce addition can promote the transformation from monodentate carbonate to bidentate carbonate on La2O3 after CO2 adsorption, which will promote the formation of II-La2O2CO3. On the other hand, H2-TPR (Fig. 7) profiles show that Ce addition improves the activity of II-La2O2CO3 under the H2 atmosphere.
 | ||
| Fig. 8 CO2-TPD profiles of the series of Ni supported Ce–La binary oxides. | ||
DRM activity tests are applied to test the coke elimination performance of Ce–La binary oxide. GHSV has been adjusted to 60![[thin space (1/6-em)]](https://www.rsc.org/images/entities/char_2009.gif) 000 mL h−1 gcat−1 to ensure that different catalysts exhibit similar CH4 conversions. Spivey et al. reported that when the DRM reaction temperature is 550–650 °C, the variation tendency of coke formation is much more severe since coke originates from both CH4 decomposition and Boudouard reaction.65 Therefore, the reaction temperature is fixed to 650 °C to increase the coke formation. As shown in Fig. S5 in the ESI,† all the Ni catalysts have CH4 conversions at around 44% and exhibit good stability.
000 mL h−1 gcat−1 to ensure that different catalysts exhibit similar CH4 conversions. Spivey et al. reported that when the DRM reaction temperature is 550–650 °C, the variation tendency of coke formation is much more severe since coke originates from both CH4 decomposition and Boudouard reaction.65 Therefore, the reaction temperature is fixed to 650 °C to increase the coke formation. As shown in Fig. S5 in the ESI,† all the Ni catalysts have CH4 conversions at around 44% and exhibit good stability.
TGA profiles are shown in Fig. 9. The mass loss below 700 °C is ascribed to the oxidation of coke and Ni particles. And the mass loss above 700 °C is ascribed to the decomposition of La2O2CO3 to release CO2. At the end of TGA, all samples can be regarded as mixtures of NiO, La2O3 and CeO2. According to the Ni loading, specific Ce/La ratio and mass loss obtained by TGA, the content of Ni, CeO2, La2O2CO3 and La2O3 in the spent catalysts can be estimated (Table 2). It should be mentioned that the formation of La2O3 on the spent catalysts is due to the spontaneous reaction between II-La2O2CO3 and deposited coke. Additionally, since Ia-La2O2CO3 is inactive for coke elimination and spontaneously transforms to II-La2O2CO3 when the temperature is above 600 °C,12,16 the calculated content of La2O2CO3 (Table 2) is ascribed to the content of Ia-La2O2CO3 which transforms to II-La2O2CO3 during the programmed temperature process. Therefore, we can use the calculated content of La2O3 and La2O2CO3 in Table 2 to estimate the content of II-La2O2CO3 and Ia-La2O2CO3, respectively. Based on the results of DRIFTS (Fig. 4, 5 and S3 in the ESI†), bidentate carbonate is active for coke elimination while monodentate carbonate is inactive for coke elimination. When correlating the molar ratio of La2O3/La2O2CO3 in Table 2 with the maximum intensity ratio of bidentate/monodentate carbonate peaks in Fig. 5, a linear relationship is obtained as shown in Fig. 10, which indicates that bidentate carbonate has a close relationship with II-La2O2CO3 while monodentate carbonate is closely related to Ia-La2O2CO3.
 | ||
| Fig. 9 TGA and DTG profiles for the spent catalysts (GHSV = 60000 mL h−1 gcat−1, 650 °C, time on stream: 50 h). | ||
| Sample | Mass loss (%) | Component in the spent catalysts (%) | Molar ratio of La2O3/La2O2CO3 | Amount of coke (g gcat−1) | Rate of coke formation (μmol gcat−1·s−1) | |||||
|---|---|---|---|---|---|---|---|---|---|---|
| <700 °C | >700 °C | Coke | Ni | CeO2 | La2O2CO3 | La2O3 | ||||
| 5Ni/0Ce–LOC | 33.9 | 6.2 | 33.9 | 3.1 | 0 | 52.1 | 10.9 | 0.237 | 0.513 | 0.237 |
| 5Ni/0.05Ce–LOC | 6.9 | 7.8 | 6.9 | 4.4 | 4.2 | 65.5 | 19.0 | 0.329 | 0.074 | 0.034 |
| 5Ni/0.10Ce–LOC | 3.9 | 7.2 | 3.9 | 4.5 | 8.2 | 60.5 | 22.8 | 0.428 | 0.041 | 0.019 |
| 5Ni/0.15Ce–LOC | 2.2 | 5.3 | 2.2 | 4.7 | 12.1 | 44.5 | 36.5 | 0.929 | 0.022 | 0.010 |
| 5Ni/0.20Ce–LOC | 3.2 | 5.7 | 3.2 | 4.6 | 15.3 | 47.9 | 29.0 | 0.688 | 0.033 | 0.015 |
 | ||
| Fig. 10 Linear correlation between the molar ratio of La2O3/La2O2CO3 obtained by TGA profiles and intensity ratio of bidentate/monodentate carbonate obtained by DRIFTS. | ||
In addition, it can be found that the amount of coke decreases with the increase of Ce/La ratio. For 5Ni/0.15Ce–LOC, it has the lowest amount of coke and the highest molar ratio of La2O3/La2O2CO3 after 50 h DRM reaction, indicating that appropriate Ce addition can promote the formation of II-La2O2CO3 to react with the deposited coke. According to the DTG profiles in Fig. 9, the peak temperature of filamentous coke (∼550 °C) decreases with the increase of Ce/La ratio which reflects the decrease of the graphitic degree of coke,4 while the peak temperature of II-La2O2CO3 (>700 °C) exhibits the opposite variation tendency. Based on the above facts, it is concluded that the 0.15Ce–LOC sample shows the best performance for coke elimination.
DFT calculation of CO2 adsorption energy
DFT calculation was applied to illustrate the influence of Ce addition on the most stable CO2 adsorption mode on La2O2CO3 (Fig. 11). Ideally, models presuming that Ce atoms distribute along the surface layer were taken into consideration. In this case, a new C–O bond is formed between a CO2 molecule with a surface O atom on La2O2CO3, which leads to the formation of carbonate. The calculated frequency of the formed C–O bond is 1517 cm−1, which is close to the characteristic frequency of bidentate carbonate (1560 cm−1) collected by in situ DRITFS (Fig. 4). In addition, the calculated CO2 adsorption energy for pure II-La2O2CO3 ((Ce/La)s is equal to 0, the subscript s denotes surface) is −1.39 eV, which is a negative value since it is an exothermic adsorption process. | ||
| Fig. 11 Calculated CO2 adsorption energies on the surfaces of Ce–La binary oxides and corresponding top and side views of geometries with CO2 adsorbed on the top site of binary oxides. Colors: yellow, Ce; blue, La; grey, C; and red, O. | ||
When the ratio of (Ce/La)s is equal to 1:7, there are eight possible sites for a Ce atom to replace a La atom within our selected unit cell (Fig. S6 in the ESI†). DFT calculations predict that the most stable CO2 adsorption mode takes place when the La atom at site 4 (see the definition in Fig. 11) is replaced by a Ce atom and the calculated CO2 adsorption energy is −1.50 eV. For samples with higher Ce content, the selected model was based on the most stable structure of samples with lower Ce contents. For example, when the ratio of (Ce/La)s is equal to 1:3, one Ce atom is fixed at the fourth site on the basis of the obtained calculation (Fig. S7 in the ESI†). In this case, the most stable CO2 adsorption mode takes place when La atoms located at sites 1 and 4 are replaced by Ce atoms and the calculated adsorption energy is −2.12 eV. Following the same procedure, when the ratio of (Ce/La)s increases to 3:5 and 1:1, the strongest adsorption energy of CO2 over Ce–La binary oxides is −2.37 eV (Fig. S8 in the ESI†) and −2.13 eV (Fig. S9 in the ESI†), respectively. Meanwhile, twenty extra models with randomly distributed Ce structures were tested, which did not follow the mentioned procedure. The CO2 binding over all these randomly generated models is less stable than the ones discussed above (Table S1 in the ESI†). Additionally, the calculated CO2 adsorption energy for pure CeO2 is −1.32 eV, which is weaker than that of La2O2CO3 and other Ce–La binary oxides. It indicates that the intensity of CO2 adsorption on ceria is much weaker than that of La2O2CO3 and other Ce–La binary oxides, which is responsible for the absence of bidentate carbonate on CeO2 as shown in Fig. 4.
According to the results of DFT calculation (Fig. 11), with the increase of (Ce/La)s ratios, the CO2 adsorption energy gradually becomes lower and reaches the lowest value when (Ce/La)s is equal to 3:5, and then the CO2 adsorption energy weakens. The variation tendency of CO2 adsorption energy with the increase of (Ce/La)s ratios (Fig. 11) is consistent with the variation tendency for the peak intensity of bidentate carbonate on Ce–La binary oxides (Fig. 4). As the CO2 adsorption energy becomes lower, CO2 adsorption on binary oxide is strengthened, and the formed carbonate is expected to have better stability. Therefore, Ce addition can affect CO2 adsorption energy for Ce–La binary oxide and the type of carbonate formed after CO2 adsorption. Ce–La binary oxide with the optimal Ce/La ratio exhibits the highest intensity of bidentate carbonate (Fig. 4), and hence has the highest basicity above 700 °C (Fig. 8) and shows the best coke elimination performance (Fig. 9).
Conclusion
We have investigated the role of Ce addition in CO2 adsorption and activation over lanthanum species. Based on results of in situ DRIFTS spectra, DFT calculations and other experimental characterizations, it is concluded that Ce addition can promote the formation of bidentate carbonate on Ce–La binary oxide via tuning CO2 adsorption energy. With the increase of Ce/La ratio from 0 to 0.20, Ce addition facilitates transformation from monodentate carbonate to bidentate carbonate on Ce–La binary oxides. Bidentate carbonate is verified to be active in the reaction with deposited coke, while monodentate carbonate is inactive for coke elimination. With the consumption of bidentate carbonate, the variation of the intensity ratio of bidentate/monodentate carbonate can affect the ratio of II-La2O2CO3/Ia-La2O2CO3. Bidentate carbonate is verified to be closely related to II-La2O2CO3 and monodentate carbonate has a close relationship with Ia-La2O2CO3. When the Ce/La ratio is 0.15, the corresponding nickel catalyst has the highest intensity ratio of bidentate/monodentate carbonate and the highest ratio of II-La2O2CO3/Ia-La2O2CO3, which exhibits the highest basicity above 700 °C and the best performance of coke elimination after 50 h DRM reaction.Experimental section
Catalyst preparation
Analytical grade La(NO3)3·6H2O, Ce(NO3)3·6H2O, Ni(NO3)2·6H2O and CeO2 powder were obtained from Aladdin Industrial Corporation (Shanghai, China). Analytical grade aqueous ammonia (25 wt%) and anhydrous ethanol (99.8 wt%) were obtained from Guangfu Fine Chemical Research Institute (Tianjin, China). Guaranteed grade urea was supplied by Kermel Chemical Reagent (Tianjin, China). De-ionized water (18.0 MΩ) was prepared using an Ulupure water purifier machine (Chengdu, China).The synthesis route of La2O2CO3 is described as follows. 2.6 grams of La(NO3)3·6H2O and 7.2 grams of urea were separately dissolved in de-ionized water. Once dissolved, the two solutions were mixed with constant stirring; the concentrations of La3+ and urea in the mixture were 0.015 mol L−1 and 0.30 mol L−1, respectively. Then aqueous ammonia was added into the mixture to adjust the pH to 8.5. A white suspension was obtained after heating in a water bath at 90 °C for 3 h with constant stirring, followed by naturally cooling to room temperature. Afterwards, the white suspension was centrifuged and washed with absolute ethanol three times. La2O2CO3 was finally prepared upon drying at 80 °C overnight and calcination at 500 °C for 2 h.
A series of Ce–La binary oxides were prepared by a wet impregnation method. The stoichiometric Ce/La ratio was chosen as 0, 0.05, 0.10, 0.15, and 0.20, respectively. The prepared La2O2CO3 was impregnated with an aqueous solution containing a specified amount of Ce(NO3)2·6H2O. Upon stirring at 80 °C for 3 h, vacuum evaporation was carried out to remove the solvent. Then the sample was dried overnight, and ground and calcined at 600 °C for 2 h. The prepared Ce–La binary oxide was marked as “xCe–LOC”, where LOC denotes the prepared La2O2CO3 and x denotes the specific stoichiometric Ce/La ratio.
A series of Ni catalysts supported on the prepared Ce–La binary oxide were synthesized by a similar procedure to that described above. For the subsequent wet impregnation method the Ni loading was fixed at 5 wt% on the basis of reduction conditions. When the sample was impregnated with the Ni precursor and dried overnight, it was ground and calcined at 650 °C for 2 h. After grinding to 20–40 mesh, the sample was reduced at 650 °C under a H2 atmosphere (H2/N2 = 1:3, 40 mL min−1) for 60 min. The prepared catalyst was named 5Ni/xCe–LOC, where LOC denotes the prepared La2O2CO3 and x denotes the specific Ce/La ratio.
Characterization
Textural properties of catalysts were measured through nitrogen adsorption–desorption at −196 °C using a Micromeritics Tristar 3000 analyzer. All samples were degassed at 300 °C for 3 h prior to the tests. The specific surface areas were calculated on the basis of the N2 isotherms and the Brunauer–Emmett–Teller (BET) method. Combined with the Barrett–Joyner–Halenda (BJH) method and the desorption branches of the N2 isotherms, cumulative volumes of pores were obtained.Elemental contents of the prepared catalysts were examined by inductively coupled plasma optical emission spectroscopy (ICP-OES) (VISTA-MPX, Varian) at a high frequency emission power of 1.5 kW and a plasma airflow of 15.0 L min−1 (λNi = 231.60 nm, λLa = 379.48 nm, λCe = 413.76 nm). Prior to measurements, samples were dissolved in a mixture of nitric acid and H2O2 to ensure that the concentrations of the measured elements are close to the concentrations of the prepared standard solutions.
XRD patterns were examined through a Rigaku D/max-2500 diffractometer equipped with graphite filtered Cu Kα radiation (λ = 1.54056 Å), and 2θ values range from 20° to 80°. The mean crystalline size of Ni particles was calculated by Scherrer's equation according to the diffraction peaks of Ni (111) facets.
H2-TPR experiment was applied to analyze the reduction behavior of the catalysts with the aid of a chemisorption apparatus (Micromeritics AutoChem II 2920). 100 mg of the sample was pretreated at 300 °C for 1 h with an Ar stream (30 mL min−1) to remove moisture and impurities. After cooling to 50 °C, the system was exposed to a 10 vol% H2/Ar stream (30 mL min−1) to reduce the sample. Subsequently, the temperature of the system was programmed to rise linearly from 100 °C to 900 °C with a rate of 10 °C min−1, during which variation of the signal of the thermal conductivity detector (TCD) was recorded.
CO2-TPD analysis was applied to investigate the basicity of the catalyst by utilizing the same chemisorption apparatus (Micromeritics AutoChem II 2920). 100 mg of the sample was prereduced at 750 °C with a 10 vol% H2/Ar stream (50 mL min−1) for 30 min to completely decompose existing La2O2CO3 on samples before CO2 adsorption. After cooling to 60 °C, the system was exposed to a stream of CO2 gas (50 mL min−1) to carry out CO2 adsorption for 30 min. Next, the system was exposed to a He stream (30 mL min−1) and the temperature was programmed to increase to 120 °C for the removal of residual CO2 in the stream. Once the signal of TCD reached a stable state, the temperature of the system was programmed to increase from 120 °C to 900 °C with a ramping rate of 10 °C min−1 and at the same time the system starts to keep record of the TCD signal. An isothermal period lasting for 8 minutes at 900 °C was set to ensure that the adsorbed CO2 was totally desorbed.
A TEM instrument (FEI Tecnai G2 F20) was applied to investigate the morphology and structure of catalysts, and the working voltage was 100 kV. After the sample powder was dispersed in absolute ethanol via ultrasonication, the obtained suspension was dripped onto a copper grid-supported transparent carbon foil and dried in air for characterization.
XPS analysis of the catalysts was carried out on a Perkin-Elmer PHI 1600 ESCA system equipped with an Al KR X-ray source (E = 1486.6 eV). Spectra were operated at a pass energy of 187.85 eV. The binding energy (B.E.) scale was measured on the basis of carbon contamination utilizing C 1s peak centered at 285 eV. In addition, core peaks were obtained using a nonlinear Shirley-type background. Besides, quantification of surface elemental composition was carried out according to Scofield's relative sensitivity factors.66
Properties of the coke deposited on the spent catalysts were characterized by utilizing a TGA system (STA449F3, NETZSCH Corp.). The TGA experiment was conducted in an air stream (50 mL min−1), and the temperature was programmed to rise from room temperature to 900 °C with a heating rate of 10 °C min−1. The amount of coke deposition, II-La2O2CO3 accumulation and oxidation of Ni particles were calculated according to the mass losses in TGA profiles.
A Raman spectrometer (Renishaw inVia Reex) was employed to record Raman spectra under ambient conditions, which was equipped with a 532 nm Ar-ion laser beam as the excitation source. Each sample was examined more than three times at different positions.
UV-visible reflectance spectra were collected on a SHIMADZU UV-2550 spectrophotometer using a pressed disc of the sample. Kubelka–Munk transformed diffuse reflectance spectra (DRS) of all samples were measured with BaSO4 powder as a reference.
In situ DRIFTS measurements
In situ DRIFTS experiments were performed on a ThermoFisher Nicolet IS50 spectrometer, which was equipped with a Harrick Scientific diffuse reflection accessory and a mercury–cadmium–telluride (MCT) detector. The scheme of the experimental process is shown in Fig. 1. The Ce–La binary oxide samples were placed in the cell of the DRIFTS apparatus and reduced at 600 °C under 30 vol% H2/Ar stream (30 mL min−1). And then, the gas stream was switched from H2/Ar stream to Ar stream (30 mL min−1) in order to remove hydrogen in the gas stream. Subsequently, the baseline of DRIFTS was collected continuously until the obtained baseline spectra remained stable. Afterwards, the gas stream was switched to 10 vol% CO2/Ar stream (30 mL min−1) to carry out CO2 adsorption for 30 min, after which the CO2 adsorption was saturated. The moment at the end of CO2 adsorption was marked as “0 min”. Subsequently, the gas stream was switched from 10 vol% CO2/Ar stream to 10 vol% CH4/Ar stream (30 mL min−1) in order to carry out CH4 adsorption for 30 min. The moment at the end of CH4 adsorption was marked as “30 min”. In situ DRIFTS measurements were carried out from “0 min” to “30 min”. Since DRIFTS spectra remained stable after “30 min”, it could be regarded that the reaction took place completely. Additionally, when it is “0 min” or “30 min”, subsequent operations could be skipped and the temperature would decrease from 600 °C to room temperature. When the cell was cooled to room temperature, samples could be taken out to carry out ex situ characterizations.Periodic DFT calculations
Periodic DFT calculations were carried out with the assistance of Vienna ab initio Simulation Package (VASP).67 The calculations employed the generalized-gradient approximation (GGA) in the form of the Perdew–Burke–Ernzerhof (PBE) exchange–correlation functional.68 A Hubbard U value was added to the PBE functional (DFT + U), which is chosen to improve the quality of the DFT calculations in dealing with oxides having narrow f or d bands.69 The interactions between the atomic cores and electrons were described by the projector augmented wave (PAW) method.70 The valence wave functions were expanded using plane-wave with a cutoff energy of 400 eV. A 4 × 2 cell was used for La2O2CO3 (110) and CeO2 (110) surfaces, and a 3 × 1 × 1 k-point mesh was used for the Brillouin zone integration. The slab was three layers thick and separated by 15 Å of vaccum. The top two layers of the slab were allowed to relax, while the bottom one layer was kept fixed. For La, a value of Ueff = 7.5 eV was used, which was calculated self-consistently by Metiu et al.19Ueff = 4.5 eV was employed for Ce, which was reported by Fabris et al.71The adsorption energy of adsorbates, Eads, is defined as follows:
| Eads = Etotal − Egas − Eslab, | (2) |
Coke elimination performance test
Catalytic activity tests were carried out in a quartz fixed-bed tubular reactor (Φ 8 × 44 mm) under atmospheric pressure. Prior to the test, the catalyst sample (100 mg, 20–40 mesh) was evenly mixed with 1 mL of quartz particles and then the mixture was loaded inside the reactor. Prior to the test, the catalysts were reduced at 650 °C under a 25 vol% H2/N2 stream (40 mL min−1) for an hour. The flow rate of the feed gas was set at 100 mL min−1 (GHSV = 60000 mL h−1 gcat−1, CH4:CO2:N2 = 20:20:60 mL min−1) to ensure that the activities of the catalysts are close to each other to simplify the comparison of coke deposition. Here, the mentioned GHSV is based on a total flow. The concentrations of gas species including CH4, CO2, H2, CO, and N2 were measured online with the assistance of a gas chromatograph (GC2060, Shanghai Ruimin Instrument). Helium was used as the carrier gas. The GC was equipped with a TCD and two columns including a TDX-01 column followed by a 5 A molecular sieve column. Activity test was performed at 650 °C for 50 h. Conversions of CH4 and CO2 (XCH4 and XCO2), selectivities to H2 and CO (SH2 and SCO), and the H2/CO ratio are defined as follows: | (3) |
 | (4) |
 | (5) |
 | (6) |
 | (7) |
Conflicts of interest
There are no conflicts to declare.Acknowledgements
We thank the National Key R&D Program of China (2016YFB0600901), the National Natural Science Foundation of China (No. 51761145012, 21525626, and U1663224) and the Program of Introducing Talents of Discipline to Universities (No. B06006) for financial support.References
- C. Montero, A. Ochoa, P. Castaño, J. Bilbao and A. G. Gayubo, J. Catal., 2015, 331, 181–192 CrossRef CAS.
- S. Singh, D. Zubenko and B. A. Rosen, ACS Catal., 2016, 6, 4199–4205 CrossRef CAS.
- H. Chen, H. Yu, F. Peng, H. Wang, J. Yang and M. Pan, J. Catal., 2010, 269, 281–290 CrossRef CAS.
- X. Li, D. Li, H. Tian, L. Zeng, Z.-J. Zhao and J. Gong, Appl. Catal., B, 2017, 202, 683–694 CrossRef CAS.
- X. E. Verykios, Int. J. Hydrogen Energy, 2003, 28, 1045–1063 CAS.
- Z. Zhang, X. E. Verykios, S. M. MacDonald and S. Affrossman, J. Phys. Chem., 1996, 100, 744–754 CrossRef CAS.
- Z. Zhang and X. E. Verykios, Appl. Catal., A, 1996, 138, 109–133 CrossRef CAS.
- V. A. Tsipouriari and X. E. Verykios, Catal. Today, 2001, 64, 83–90 CrossRef CAS.
- Y. H. Hou, W. C. Han, W. S. Xia and H. L. Wan, ACS Catal., 2015, 5, 1663–1674 CrossRef CAS.
- R. P. Taylor and G. L. Schrader, Ind. Eng. Chem. Res., 1991, 30, 1016–1023 CrossRef CAS.
- R. P. Turcotte, J. O. Sawyer and L. Eyring, Inorg. Chem., 1969, 8, 238–246 CrossRef CAS.
- A. Orera, G. Larraz and M. L. Sanjuán, J. Eur. Ceram. Soc., 2013, 33, 2103–2110 CrossRef CAS.
- S. Irusta, L. M. Cornaglia and E. A. Lombardo, Mater. Chem. Phys., 2004, 86, 440–447 CrossRef CAS.
- T. Levan, M. Che, J. M. Tatibouet and M. Kermarec, J. Catal., 1993, 142, 18–26 CrossRef CAS.
- B. Klingenberg and M. A. Vannice, Chem. Mater., 1996, 8, 2755–2768 CrossRef CAS.
- D. Pakhare, V. Schwartz, V. Abdelsayed, D. Haynes, D. Shekhawat, J. Poston and J. Spivey, J. Catal., 2014, 316, 78–92 CrossRef CAS.
- G. Yang, H. Yu, X. Huang, F. Peng and H. Wang, Appl. Catal., B, 2012, 127, 89–98 CrossRef CAS.
- L. Jin, Y. Zhang, J. P. Dombrowski, C.-H. Chen, A. Pravatas, L. Xu, C. Perkins and S. L. Suib, Appl. Catal., B, 2011, 103, 200–205 CrossRef CAS.
- B. Li and H. Metiu, J. Phys. Chem. C, 2010, 114, 12234–12244 CAS.
- B. Li and H. Metiu, J. Phys. Chem. C, 2011, 115, 18239–18246 CAS.
- T. Montini, M. Melchionna, M. Monai and P. Fornasiero, Chem. Rev., 2016, 116, 5987–6041 CrossRef CAS PubMed.
- J. A. Rodriguez, D. C. Grinter, Z. Liu, R. M. Palomino and S. D. Senanayake, Chem. Soc. Rev., 2017, 46, 1824–1841 RSC.
- S. Bhavsar, N. Isenberg, A. More and G. Veser, Appl. Energy, 2016, 168, 236–247 CrossRef CAS.
- W. Xu, Z. Liu, A. C. Johnston-Peck, S. D. Senanayake, G. Zhou, D. Stacchiola, E. A. Stach and J. A. Rodriguez, ACS Catal., 2013, 3, 975–984 CrossRef CAS.
- D. Li, X. Li and J. Gong, Chem. Rev., 2016, 116, 11529–11653 CrossRef CAS PubMed.
- S. Li and J. Gong, Chem. Soc. Rev., 2014, 43, 7245–7256 RSC.
- E. T. Saw, U. Oemar, X. R. Tan, Y. Du, A. Borgna, K. Hidajat and S. Kawi, J. Catal., 2014, 314, 32–46 CrossRef CAS.
- S. Chen, L. Luo, Z. Jiang and W. Huang, ACS Catal., 2015, 5, 1653–1662 CrossRef CAS.
- H. Muroyama, S. Hano, T. Matsui and K. Eguchi, Catal. Today, 2010, 153, 133–135 CrossRef CAS.
- H. Muroyama, H. Asajima, S. Hano, T. Matsui and K. Eguchi, Appl. Catal., A, 2015, 489, 235–240 CrossRef CAS.
- J. Li, X. Liu, W. Zhan, Y. Guo, Y. Guo and G. Lu, Catal. Sci. Technol., 2016, 6, 897–907 CAS.
- M. Zhao, M. Shen and J. Wang, J. Catal., 2007, 248, 258–267 CrossRef CAS.
- J.-R. Kim, W.-J. Myeong and S.-K. Ihm, Appl. Catal., B, 2007, 71, 57–63 CrossRef CAS.
- L. Katta, P. Sudarsanam, G. Thrimurthulu and B. M. Reddy, Appl. Catal., B, 2010, 101, 101–108 CrossRef CAS.
- B. Zhang, D. Li and X. Wang, Catal. Today, 2010, 158, 348–353 CrossRef CAS.
- K. Harada, T. Oishi, S. Hamamoto and T. Ishihara, J. Phys. Chem. C, 2014, 118, 559–568 CAS.
- B. M. Reddy, L. Katta and G. Thrimurthulu, Chem. Mater., 2010, 22, 467–475 CrossRef CAS.
- A. Bueno-López, K. Krishna, M. Makkee and J. A. Moulijn, J. Catal., 2005, 230, 237–248 CrossRef.
- Z. Stansch, L. Mleczko and M. Baerns, Ind. Eng. Chem. Res., 1997, 36, 2568–2579 CrossRef CAS.
- M. Taniewski, A. Lachowicz, R. Lachowicz, D. Czechowicz and K. Skutil, Ind. Eng. Chem. Res., 1994, 33, 185–190 CrossRef CAS.
- D. Pakhare and J. Spivey, Chem. Soc. Rev., 2014, 43, 7813–7837 RSC.
- S. Damyanova, B. Pawelec, K. Arishtirova, M. V. M. Huerta and J. L. G. Fierro, Appl. Catal., A, 2008, 337, 86–96 CrossRef CAS.
- F. ç. Larachi, J. Pierre, A. Adnot and A. Bernis, Appl. Surf. Sci., 2002, 195, 236–250 CrossRef CAS.
- R. Leppelt, B. Schumacher, V. Plzak, M. Kinne and R. J. Behm, J. Catal., 2006, 244, 137–152 CrossRef CAS.
- A. Karpenko, Y. Denkwitz, V. Plzak, J. Cai, R. Leppelt, B. Schumacher and R. J. Behm, Catal. Lett., 2007, 116, 105–115 CrossRef CAS.
- C. Yang, X. Yu, S. Heißler, A. Nefedov, S. Colussi, J. Llorca, A. Trovarelli, Y. Wang and C. Wöll, Angew. Chem., Int. Ed., 2017, 56, 375–379 CrossRef CAS PubMed.
- S. Deshpande, S. Patil, S. V. Kuchibhatla and S. Seal, Appl. Phys. Lett., 2005, 87, 133113 CrossRef.
- C. A. Orge, J. J. M. Órfão, M. F. R. Pereira, A. M. Duarte de Farias, R. C. R. Neto and M. A. Fraga, Appl. Catal., B, 2011, 103, 190–199 CrossRef CAS.
- C. Ho, J. C. Yu, T. Kwong, A. C. Mak and S. Lai, Chem. Mater., 2005, 17, 4514–4522 CrossRef CAS.
- B. Liu, Q. Li, X. Du, B. Liu, M. Yao, Z. Li, R. Liu, D. Liu, X. Zou, H. Lv, D. Li, B. Zou, T. Cui and G. Zou, J. Alloys Compd., 2011, 509, 6720–6724 CrossRef CAS.
- M. Sorescu, T. Xu, J. D. Burnett and J. A. Aitken, J. Mater. Sci., 2011, 46, 6709–6717 CrossRef CAS.
- E. M. Wilcox, G. W. Roberts and J. J. Spivey, Catal. Today, 2003, 88, 83–90 CrossRef CAS.
- B. Bachiller-Baeza, C. Mateos-Pedrero, M. A. Soria, A. Guerrero-Ruiz, U. Rodemerck and I. Rodríguez-Ramos, Appl. Catal., B, 2013, 129, 450–459 CrossRef CAS.
- S. J. Huang, A. B. Walters and M. A. Vannice, Appl. Catal., B, 2000, 26, 101–118 CrossRef CAS.
- M. P. Rosynek and D. T. Magnuson, J. Catal., 1977, 48, 417–421 CrossRef CAS.
- L. M. Cornaglia, J. Múnera, S. Irusta and E. A. Lombardo, Appl. Catal., A, 2004, 263, 91–101 CrossRef CAS.
- B. M. Faroldi, J. F. Múnera and L. M. Cornaglia, Appl. Catal., B, 2014, 150–151, 126–137 CrossRef CAS.
- X. B. Wang, C. Song, K. W. Geng, F. Zeng and F. Pan, Appl. Surf. Sci., 2007, 253, 6905–6909 CrossRef CAS.
- Z.-Y. Pu, J.-Q. Lu, M.-F. Luo and Y.-L. Xie, J. Phys. Chem. C, 2007, 111, 18695–18702 CAS.
- A. D. Liyanage, S. D. Perera, K. Tan, Y. Chabal and K. J. Balkus, ACS Catal., 2014, 4, 577–584 CrossRef CAS.
- J. Ni, L. Chen, J. Lin, M. K. Schreyer, Z. Wang and S. Kawi, Int. J. Hydrogen Energy, 2013, 38, 13631–13642 CrossRef CAS.
- M. M. Nair, S. Kaliaguine and F. Kleitz, ACS Catal., 2014, 4, 3837–3846 CrossRef CAS.
- H. Ma, L. Zeng, H. Tian, D. Li, X. Wang, X. Li and J. Gong, Appl. Catal., B, 2016, 181, 321–331 CrossRef CAS.
- S. Valange, A. Beauchaud, J. Barrault, Z. Gabelica, M. Daturi and F. Can, J. Catal., 2007, 251, 113–122 CrossRef CAS.
- S. Gaur, D. J. Haynes and J. J. Spivey, Appl. Catal., A, 2011, 403, 142–151 CAS.
- J. H. Scofield, J. Electron Spectrosc. Relat. Phenom., 1976, 8, 129–137 CrossRef CAS.
- G. Kresse and J. Furthmüller, Comput. Mater. Sci., 1996, 6, 15–50 CrossRef CAS.
- Z.-J. Zhao, A. Kulkarni, L. Vilella, J. K. Nørskov and F. Studt, ACS Catal., 2016, 6, 3760–3766 CrossRef CAS.
- G. Pacchioni, J. Chem. Phys., 2008, 128, 182505 CrossRef PubMed.
- P. E. Blöchl, Phys. Rev. B: Condens. Matter Mater. Phys., 1994, 50, 17953–17979 CrossRef.
- S. Fabris, S. de Gironcoli, S. Baroni, G. Vicario and G. Balducci, Phys. Rev. B: Condens. Matter Mater. Phys., 2005, 72, 237102 CrossRef.
Footnotes |
| † Electronic supplementary information (ESI) available. See DOI: 10.1039/c8sc00203g |
| ‡ These authors contributed equally to this work. |
| This journal is © The Royal Society of Chemistry 2018 |