
 Open Access Article
 This Open Access Article is licensed under a Creative Commons Attribution-Non Commercial 3.0 Unported Licence
Experimental and theoretical evidence of a supercritical-like transition in an organic semiconductor presenting colossal uniaxial negative thermal expansion†
Arie
van der Lee
 *a,
Gilles H.
Roche
bc,
Guillaume
Wantz
b,
Joël J. E.
Moreau
c,
Olivier J.
Dautel
c and
Jean-Sébastien
Filhol
d
*a,
Gilles H.
Roche
bc,
Guillaume
Wantz
b,
Joël J. E.
Moreau
c,
Olivier J.
Dautel
c and
Jean-Sébastien
Filhol
d
aInstitut Européen des Membranes, UMR-5635, Université de Montpellier, ENSCM, CNRS, Place Eugène Bataillon, 34095 Montpellier cedex 5, France. E-mail: arie.van-der-lee@umontpellier.fr
bUniversité de Bordeaux, IMS, CNRS, UMR-5218, Bordeaux INP, ENSCBP, 33405 Talence, France
cInstitut Charles Gerhardt de Montpellier, Laboratoire AM2N, UMR-5253, Université de Montpellier, ENSCM, CNRS, 8 rue de l'École Normale, 34296 Montpellier cedex 5, France
dInstitut Charles Gerhardt de Montpellier, Laboratoire CTMM, UMR-5253, Université de Montpellier, ENSCM, CNRS, Place Eugène Bataillon, 34095, Montpellier cedex 5, France
First published on 22nd March 2018
Abstract
Thermal expansion coefficients of most materials are usually small, typically up to 50 parts per million per kelvin, and positive, i.e. materials expand when heated. Some materials show an atypical shrinking behavior in one or more crystallographic directions when heated. Here we show that a high mobility thiophene-based organic semiconductor, BHH-BTBT, has an exceptionally large negative expansion between 95 and 295 K (−216 < α2 = αb < −333 MK−1), being compensated by an even larger positive expansion in the perpendicular direction (287 < α1 < 634 MK−1). It is shown that these anomalous expansivities are completely absent in C8-BTBT, a much studied organic semiconductor with a closely related molecular formula and 3D crystallographic structure. Complete theoretical characterization of BHH-BTBT using ab initio molecular dynamics shows that below ∼200 K two different α and β domains exist of which one is dominant but which dynamically exchange around and above 210 K. A supercritical-like transition from an α dominated phase to a β dominated phase is observed using DSC measurements, UV-VIS spectroscopy, and X-ray diffraction. The origin of the extreme negative and positive thermal expansion is related to steric hindrance between adjacent tilted thiophene units and strongly enhanced by attractive S⋯S and S⋯C interactions within the highly anharmonic mixed-domain phase. This material could trigger the tailoring of optoelectronic devices highly sensitive to strain and temperature.
Introduction
Organic and inorganic compounds displaying negative thermal expansion (NTE) in one or more crystallographic directions have attracted great interest in recent years for fundamental reasons,1,2 as well as for their applications in functional materials.3 NTE is characterized by a negative sign of the thermal expansion coefficient αl =(∂l/∂T)P/l, with l being one of the crystallographic axes (a, b, or c) or one of the principal (orthogonal) axes of the strain tensor (1–3), where usually the temperature range is indicated over which the NTE occurs. Potential applications of NTE materials include their use as fillers in controlled thermal expansion composites,2,4 as thermomechanical actuator components5,6 or as precursor compounds for the design of zero thermal expansion materials by chemical modifications.3It has become clear that porous materials, such as metal–organic frameworks (MOFs), are more likely candidates to display NTE than are dense materials, whether they are organic, inorganic or hybrid organic/inorganic. MOFs that display NTE include the cubic empty pore MOF-5 compound7 with αα = −16 MK−1, Ag[(ethylenediamine)]NO3 with αb = α2 = −89 MK−1,8 MCF-82 (α3 = −218 MK−1),9 and [Zn2(fu-L1)2]n (α1 = −380 MK−1).10
Dense materials displaying NTE have mostly smaller (less negative) linear thermal expansion coefficients, but occasionally these exceed those of porous materials. Examples include the inorganic phases ZrW2O8 (αa = α1 = −9 MK−1)11 and Ca2RuO3.74 (αb = α2 = −115 MK−1),12 the metal–organic “wine-rack” phases Ag3[Co(CN)6] (αc ≈ −125 MK−1),13 α-Cu-tricyanomethanide (αb = α2 = −407 MK−1),14 and thermosalient (phenylazophenyl)palladium hexafluoroacetylacetonate (αc = −80 MK−1),15 and the organic compounds nitromethane 18-crown-6 (α1 = −129 MK−1),16 octa-3,5-diyn-2,7-diol (αc = α3 = −204 MK−1)17 and thermosalient N′-2-propylydene-4-hydroxybenzohydrazide (IMACET) (αc = α3 = −290 MK−1).18 The latter compounds are exceptional since NTE is assumed to be less common in purely organic compounds than in dense organometallic or inorganic compounds.17,19
It is clear that the mechanisms underlying the phenomenon of NTE are likely to be different in dense and porous materials. We present here a case study of a dense organic benzothienobenzothiophene structure (bis(hydroxyhexyl)[1]benzothieno[3,2-b][1]benzothiophene (BHH-BTBT)) that displays in the absence of an obvious structural discontinuity an exceptional negative uniaxial thermal expansion along the crystallographic b-axis of the same order of magnitude as that in IMACET, i.e. αb = α2 = −333 MK−1 at 295 K, and an average (linear) value of −274 MK−1 between 95 and 295 K. The negative thermal expansion in IMACET appears to be the onset of a first-order phase transition, whereas in BHH-BTBT a more complex supercritical-like transition without obvious structural discontinuity takes place as will be shown below.
The uniaxial NTE in BHH-BTBT is more than compensated by a very high positive thermal expansion (PTE) along the a-axis of 580 MK−1 at 295 K (linear value between 95 K and 295 K: 441 MK−1), so that the volume expansion displays a net positive effect. Thermal expansion of most compounds does not exceed 50 MK−1. The negative expansion in BHH-BTBT can be labeled as ‘colossal’ according to the classification proposed and used by Goodwin et al.,13 van Heerden et al.,20 and Henke et al.10 where ‘giant’ means |α| ≥ 25 MK−1, ‘colossal’ |α| ≥ 100 MK−1 and ‘massive’ |α| ≥ 400 MK−1. We also show that this exceptional thermal expansion is completely absent in a closely related compound, the well-known, much studied,21–23 and commercially available bis(octyl)[1]benzothieno[3,2-b][1]benzothiophene (C8-BTBT, Scheme 1), despite a very similar crystal packing.
 | ||
| Scheme 1 Chemical schemes for BHH-BTBT and C8-BTBT. | ||
This type of π-conjugated thiophene based material is of particular interest in the field of organic electronics, used as a semiconductor in organic field-effect transistors (OFETs).24–26 In this context, some of us recently reported thermally evaporated BHH-BTBT based OFETs exhibiting a high mobility of up to 0.17 cm2 V−1 s−1 measured under an inert atmosphere but also in ambient air.27 The crystal packing features, morphology and charge transport in organic semiconductors are intimately related,28 so in order to obtain a deeper understanding of the exceptional NTE in BHH-BTBT we have carried out dynamic ab initio density functional theory (DFT) molecular calculations. Thermal expansion was shown to be the main factor responsible for thermal bandwidth narrowing in organic semiconductors such as pentacene (with a slight negative thermal expansion) and rubrene.29 The modeling of thermal expansion coefficients by means of ab initio calculations is challenging; in most cases, they are estimated by computing the quasiharmonic vibrational effects at different volumes to estimate the anharmonic contribution to the energy expansion.30–33 In the present case, because the material is dominated by weak forces, this approach is not expected to work, in particular for high temperatures. Therefore, ab initio dynamic calculations at constant temperature and pressure have been done for the first time to our knowledge for such a large and weakly bonded compound. They give insight into the structural and electronic changes as a function of temperature.
Structure description and thermal expansion
We reported previously the structure of BHH-BTBT at 295 K.27 It crystallizes in space group I2/a with two short a and b axes of 7.8 and 5.9 Å, respectively, and one very long c-axis of 49.5 Å (95 K, Fig. S1†). The crystal packing is very characteristic of thiophene based OFET structures, either with BTBT cores or fused thiophene-based structures with, for example, dithieno-thiophene cores, with linear or branched side chains.34–38 The more or less stretched molecules stack according to a herringbone organization (Fig. S25†) as layers parallel to the ab-plane in such a way as to have close S⋯S and S⋯C contacts, responsible for the conducting behavior of the materials. In BHH-BTBT four such contacts below 4 Å are present (Fig. 1). | ||
| Fig. 1 (a) View of S⋯S and S⋯C contacts in the structure at 95 K with a parallel edge-to-edge conformation between the upper two molecules and a tilted face-to-edge conformation between the two bottom molecules. (b) Close contacts between an edge sulfur and the atoms of the thiophene ring of an adjacent tilted BTBT core. The shortest S1⋯Siii contact (3.430 Å) is visible in part (a) of this figure as the dashed line between the two upper molecules. Symmetry codes: (i) 1/2 + x, 1 − y, z; (ii) 2 − x, 1/2 + y, 1.5 − z; and (iii) 1.5 − x, 1.5 − y, 1.5 − z. | ||
The shortest S⋯S contact at 3.430 Å is between adjacent parallel molecules with an angle between the two planes through the BTBT cores of strictly 0°, since they are shifted by one lattice translation along the b-axis. These molecules are said to be in an edge-to-edge (EE) conformation although they are in fact largely shifted along the b-axis. The other relatively short S⋯S contact (3.911 Å) is between adjacent molecules which are in a face-to-edge conformation (FE) with respect to the BTBT cores at an angle of 53° at 95 K. This herringbone angle σh is very close to that in similar BTBT systems where this angle varies between 50 and 54° (Table S3†). The FE conformation also gives rise to two very short atomic distances (3.309 and 3.384 Å) from the S atom of one molecule to the C3 and C4 carbon atoms of two different aromatic bonds (Fig. 1b). The S⋯C distances to the two other carbon atoms are slightly larger than the sum of the van der Waals radii of carbon. The distinguishing structural feature of this thiophene based semiconductor compared to other reported structures is the end hydroxyl functional group which stabilizes the crystal packing by a hydrogen-bonded network between BHH-BTBT layers (Fig. S3†).
The normalized thermal expansion values for the three crystallographic axes and the volume are shown in Fig. 2. Whereas the c-axis shows a very classical thermal expansion of less than 2% over the studied temperature range between 95 K and 295 K, the behavior of the a and b axes is very atypical with an exceptional NTE of the b-axis (−333 MK−1, i.e. nearly 6%) at the highest temperatures and a more than compensating very strong PTE of the a-axis (580 MK−1, i.e. nearly 9%). The value of the cell volume is mostly determined by the value of the normally increasing very large c-axis and the very large increase of the a-axis and augments by nearly 5%. The expansion is far from linear throughout the investigated temperature interval, but no discontinuities can be detected. Since the structure is monoclinic and the β-angle varies as well with temperature the expansivities along the a and c axes are not along identical directions at different temperatures. The difference is not large because the β-angle is close to 90°, varying between 95.8° at the lowest temperature to 92.8° at the highest temperature. For a better comparison with other systems the expansivities along orthogonal axes are reported as well (Fig. S9†): 287 < α1 < 634 MK−1; −216 < α2 = αb < −333 MK−1; 23 < α3 < 60 MK−1. It is noted that there is no space group change throughout the investigated temperature interval.
 | ||
| Fig. 2 Normalized experimental and calculated cell parameters and volume as a function of temperature for BHH-BTBT. The inset shows optical microscopy pictures of a crystal of BHH-BTBT at 100 K and 296 K. The crystallographic a-axis is to the right of the paper and the c-axis perpendicular to the paper. The dotted rectangles have exactly the same dimensions (see also Fig. S38†). | ||
The impact of the large positive and negative expansions of notably the a and b parameters can be seen by plotting several geometrical parameters calculated from the atomic models resulting from the structural refinements as a function of temperature (Fig. 3). The principal effect is a very large tilting of a BTBT core with respect to another in FE conformation. The tilting is accompanied by nearly constant S⋯C3i and S⋯C4i contact distances and a much larger increase of the S⋯C2i and S⋯C4ii distances which were initially already longer than the sum of the carbon van der Waals radii. A closer inspection of the distance and angle variations seems to indicate a change of the slope in between approximately 200 and 220 K, suggesting a second-order phase transition. Other geometrical parameters behave normally as a function of temperature, in particular those related to intramolecular distances, angles, and torsional angles showing that the conformation of the molecules hardly changes as a function of temperature (Fig. S13 and S15†), which is also expressed in the nearly constant eigenvalues of the molecule's tensor of inertia (Fig. S12†).
 | ||
| Fig. 3 (a) Temperature dependence of atomic distances between the sulfur atom of a BTBT core and the atoms of the thiophene ring of an adjacent BTBT core in the structure of BHH-BTBT. For the atom labelling, see Fig. 1b. (b) Temperature dependence of the herringbone angle σh between the least-squares planes of BTBT cores in the edge and face positions. Two straight lines were fitted to a low and a high temperature interval, respectively. σh for C8-BTBT is given as well. | ||
The crystal packing of BHH-BTBT is by far not unique: a search in the Cambridge Structural Database39 for structures with BTBT cores yielded 14 unique hits, including BHH-BTBT, and a search for structures with analogous bisthienothiophene (BTT) cores resulted in 16 hits (excluding co-crystals). Of these, depending on the side functional groups, 9 structures with BTBT cores have very similar packing structures to that of BHH-BTBT with alternating EE and FE orientations, and 7 structures with BTT cores (Table S3†). The crystal structures of all structures, except BHH-BTBT, have only been measured at one temperature, mostly 300 K, since this is the usual operating temperature of the functional device. The distinguishing feature between BHH-BTBT and other structures with similar packings is the value of the tilt angle between the BTBT cores in face-edge orientation, which is 65° in BHH-BTBT at room temperature and 50–55° for other BTBT structures, and 44–46° for BTT core structures regardless whether the structure has been measured at low temperatures or at ambient temperatures. We determined the thermal expansion of C8-BTBT (Scheme 1) whose room temperature structure was determined previously.37 Although the crystal packing is very similar to that in BHH-BTBT, the thermal expansion is completely different with a normal PTE along the in-plane (i.e. the plane perpendicular to the stacking direction of the C8-BTBTb-axis) and a close to zero thermal expansion for the other in-plane a-axis and along the stacking direction (Fig. S24†). The evolution of the herringbone angle is between 52.6° at 125 K and 55.0° at 295 K (Fig. 3b), which is quite normal and much smaller than that of BHH-BTBT. The presence of the hydrogen-bonded network between the stacked BHH-BTBT layers thus appears to be a determining factor for the outstanding NTE and PTE properties of BHH-BTBT.
Theoretical investigations
The ab initio DFT molecular calculations have been carried out in the P1 space group. A symmetry analysis of the optimized DFT structures shows that the actual I2/a space group symmetry is very well retained (Table S6†). The cell parameters of the computed BHH-BTBT structure at 0 K (called α-0K) optimized from the 95 K experimental structure are in excellent agreement with the extrapolated cell parameters using the experimental negative and positive linear thermal expansion in the 95–200 K temperature range (Fig. 2). The evolution of the average cell parameters with temperature was determined from the constant particle, pressure and temperature Langevin dynamics (NPT40). Below 200 K, the results are in excellent agreement with the experimental observations. The time correlation of the a and b lattice parameters in Fig. 4 shows that the trajectory possesses only one unique attractor around the average values and also that there is a linear correlation between a and b keeping the a × b product approximately constant. For temperatures beyond 240 K a qualitative agreement for the positive and negative expansion remains but successive runs at the same temperature lead to a dispersion of about 10% on a and b, whereas a × b, c and V show a dispersion of only 1%, 0.5% and 0.6%, respectively. The system thus enters a new phase space domain beyond the pure harmonic vibrational limit associated with large correlated fluctuations of a and b. The a/b time correlation diagram for different runs (Fig. S28†) at 295 K shows 2 attractors for the trajectories characterized by the (a, b)-coordinates (9.1, 5.1), called α-295K, and (7.9, 5.9), called β-295K, with the intermediate region being traveled by the different runs. This suggests that above 200 K the system does not oscillate around only one equilibrium structure but accesses the phase space around two different local minima corresponding to two different phases, α and β. These two structures can be extracted by computing the average position of the atoms corresponding to the runs around the two different attractors (Fig. 4). One domain, α, corresponds to a short a parameter and has a structure very similar to the α-0K structure while the other domain, β, having a long a parameter and a different connectivity for, in particular, the intermolecular S⋯S contacts, is associated with the metastable β-0K phase. | ||
| Fig. 4 a-parameter versus b-parameter for trajectories from 95 to 295 K. The large crosses give the equilibrium points for the α-0K (green) and β-0K (red) structures. | ||
The total structure averaged from all different runs is in very good agreement with the experimental structure not only for the unit cell parameters but also for the average local bonding. This suggests that the experimental structure at temperatures above 200 K is a dynamic mix of both α and β domains. A close analysis of the time-averaged α and β structures in the high-temperature regime shows rather important structural differences between them (Table 1 and Fig. S32†) for the axes and thus also for all derived geometrical parameters. The experimental values are always close to the mean of the values of the α and β structures. It can be seen that the β structure is solely responsible for the deviating large herringbone angle σh in the experimental structure compared to related structures.
| α-235K | β-235K | 235K-exp | α-295K | β-295K | 295K-exp | |
|---|---|---|---|---|---|---|
| a (Å) | 7.9191 | 8.8788 | 8.16147 | 8.1376 | 8.8560 | 8.4460 |
| b (Å) | 5.8957 | 5.2477 | 5.6917 | 5.7948 | 5.2953 | 5.5894 |
| c (Å) | 49.6875 | 50.3981 | 49.8698 | 49.6180 | 50.1623 | 50.2534 |
| α (°) | 90.0553 | 89.0994 | 90 | 89.9519 | 89.7405 | 90 |
| β (°) | 95.9899 | 91.3073 | 93.819 | 95.5113 | 93.2687 | 92.830 |
| γ (°) | 89.9097 | 89.5738 | 90 | 90.0081 | 89.9775 | 90 |
| V (Å3) | 2307.2 | 2347.2 | 2311.5 | 2329.0 | 2348.5 | 2369.5 |
| σ h (°) | 53.73/52.86 | 74.17/73.56 | 60.46 | 57.22/57.05 | 72.59/73.35 | 64.86 |
| S1ii⋯Siii (Å) | 3.415 | 3.561 | 3.482 | 3.447 | 3.555 | 3.533 |
| S1⋯Sii (Å) | 4.195 | 3.784 | 4.113 | 4.146 | 3.892 | 4.086 |
| S1⋯Si (Å) | 3.992 | 4.429 | 4.107 | 4.099 | 4.451 | 4.247 |
| S⋯C3i (Å) | 3.393 | 3.392 | 3.315 | 3.397 | 3.370 | 3.343 |
| S⋯C4i (Å) | 3.420 | 3.345 | 3.415 | 3.429 | 3.652 | 3.444 |
The different connectivities between the BTBT cores in α and β also give rise to very different electronic structures. At 0 K (for the stable α structure), the percolation pathway of electrons and holes can be visualized in real space using the Fukui functions (Fig. S28†). The conductivity can directly be linked with very diffuse 3pz sulphur orbitals interacting with each other and with the C4i/C4ii of the π-system of aromatic carbons for the valence band and with the π-system of the C4i aromatic carbons for the conduction band giving rise to electron–hole percolation pathways mostly in the ab-plane.
Fig. S29† shows the time-averaged temperature-dependent vertical Kohn–Sham band gap for three irreducible k-points extracted from NPT dynamics. An average decrease of the band gap of −0.8 meV K−1 for all k-points between 0 and 195 K is observed. Above 300 K, as the kinetic behavior of the system can be decomposed into the two domains α and β, existing locally for a time scale of larger than 10 ps, the optical band gap is dominated by the phase with the lower band gap, in this case the β domain. For this specific domain the band gap minimum is not anymore for G1 but for G2/G3 and the band gap decrease becomes −1.1 meV K−1. This is coherent with the experimental UV-VIS spectroscopy results (Fig. 5) showing a decrease of −0.39 meV K−1 below 200 K and −0.53 meV K−1 above 200 K. The band gap in C8-BTBT is 0.02 meV K−1, nearly temperature independent.
 | ||
| Fig. 5 Experimental evolution of the optical band gap of BHH-BTBT and C8-BTBT as a function of temperature as determined from UV-vis spectroscopy. | ||
The theoretical over-estimation of the gap variation is most probably linked to the underestimation of the Kohn–Sham gaps compared to the experimental ones. The change in behavior for the k-points can be qualitatively understood by looking at the full band structure from the time-averaged structures at different temperatures shown in Fig. S31.† All α-domains present a similar band structure with a band structure minimum around the Γ-point.
For this structure, the four highest occupied bands and the four lowest unoccupied bands present a decrease of the band dispersion caused by the dynamic lowering of the local symmetry due to the splitting of the band degeneracy, which causes the decrease of the band gap tending to an asymptotic lower limit around 200 K. Above 200 K the β-domain starts to contribute to the system dynamics, having a different band gap because of the different connectivity of the intermolecular S⋯S bonds (in particular S⋯Si and S⋯Sii). Now the total band gap decrease is determined by that of the β-domain because the temperature increase favors the decrease of the S⋯Sii contact distance and the electronic delocalization inducing an increase of the band dispersion.
Discussion
In order to explain the anomalous behavior of the thermal expansion in BHH-BTBT we could look at analogous compounds, but temperature-dependent structural data on organic semiconductors are very scarce. Only one comparative structural study was published on the acenes naphthalene, anthracene, tetracene and pentacene,41,42 which all show the typical herringbone packing also observed in BHH-BTBT. Pentacene presents negative uniaxial thermal expansion an order of magnitude smaller than in BHH-BTBT and has a much smaller temperature dependence of the herringbone angle. The main reason for the negative thermal expansion in pentacene was shown to be the librational motion along the long molecular axis in conjunction with an increase of σh, and frustrated by steric hindrance between the herringbone-packed molecules. This is expected to play a role as well in BHH-BTBT since librational motion in BHH-BTBT is twice as large (Fig. S12†) as in pentacene, but other factors enhance NTE and PTE significantly.The full dynamic characterization by DFT has shown that BHH-BTBT presents two polymorphs α and β characterized by different (a,b)-parameters and σh angles. The phases are closely related, the main difference being in the connectivity between adjacent BTBT moieties leading to quite different electronic structures (Fig. S31†). The most stable phase at 0 K is α but β is only 85 meV per molecule higher in energy, including zero-point vibrational energies. With increasing temperature, the BTBT moieties librate more and more around their long axis, asymmetrically towards the β structure as it allows some electron delocalization through the S⋯Sii contact because of the associated length reduction. This leads to a flattened anharmonic potential in the direction of the β structure (Fig. 6).
 | ||
| Fig. 6 Schematic view of the evolution of the free energy landscape of the α and β domains in BHH-BTBT in the case of a supercritical-like phase transition (top) and of a conventional first-order phase transition (bottom). | ||
This strongly anharmonic frustrated rotation couples with the a and b parameters leading to a colossal positive and negative thermal expansion as schematized in Fig. 7. This is also seen in the computed (a,b) trajectory at 95 K that tends to be displaced toward larger a values (Fig. 4). For higher temperature, the fluctuation in the a-parameter becomes more and more important until it becomes as large as the separation between α and β at around 200 K. Therefore α and β cannot be considered as independent phases but as an average phase with average properties between the α and β domains.
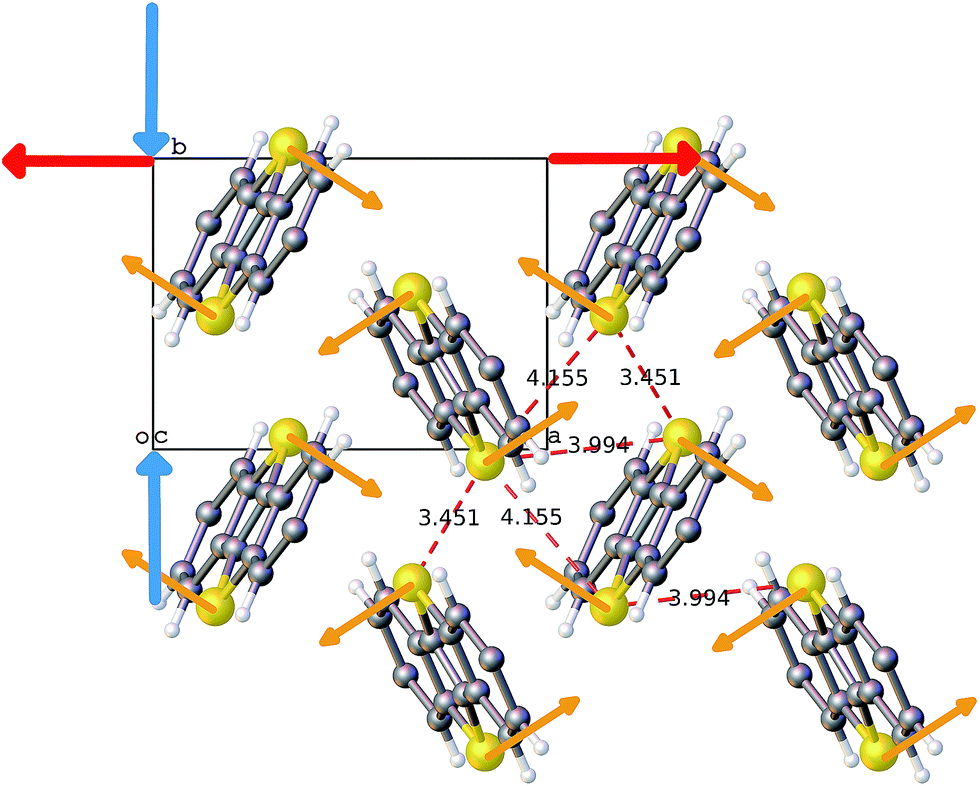 | ||
| Fig. 7 Scheme for the thermal expansion of BHH-BTBT. Yellow arrows represent the rotation of the moieties with the increase of temperature; the blue and red ones give the direction of the negative and positive unit cell expansion, respectively. Only the aromatic moieties are shown (for the 155 K experimental structure). The numbers refer to close S⋯S distances in Å. | ||
In contrast to a “classical” first order phase transition (Fig. 6) where structural fluctuations are smaller than the separation between the two different structures, the structural fluctuations in the present case are of the order of the structural separation between α/β domains. This is reminiscent of a supercritical transition from a liquid to a gas with no discontinuity of the density. DSC measurements (Fig. S36†) show a discontinuity at 210 K with a very weak enthalpy ΔH = 170 J mol−1 which is at least an order of magnitude smaller than the energy required to break a classical hydrogen bond (6–30 kJ mol−1). Although the small hysteresis in the DSC plot could indicate a classical one to one first-order phase transition, this is at first sight not very likely in view of the extremely weak energy involved in the transition and the absence of clear discontinuities in the evolution of the cell parameters. From the dynamic DFT calculations we rather deduce that in analogy with supercritical fluids this could correspond to the equivalent of a Widom line43 which is observed above the critical point separating a pseudo-liquid from pseudo gas dominated domains associated with a maximum of the isobaric heat capacity and a pseudo-boiling temperature.44 This observation agrees with the classification by Christy45 of an isosymmetric transition, i.e. a transition in which the high-temperature phase has the same space group symmetry as the low-temperature phase, as a crossover or diffuse transition without discontinuity in the free-energy derivative leading to supercritical behaviour. Isosymmetric structural transitions are necessarily first-order according to Landau theory and are thus discontinuous. There is however not a minimum size on the discontinuity under the Landau conditions, and so a weakly discontinuous isosymmetric transition may appear continuous.46
Below 210 K, with increasing temperature the fluctuations become extremely large and the dominant α phase contains more and more domains that dynamically convert into β-domains even if they are strictly less stable. As seen in the ab initio dynamics α/β-domains are locally stable on the typical time-scale of the dynamics (i.e. 20 ps) even if the β-domains remain less probable than the α-domains. This creates a mix of α/β sub-domains stabilized by entropy that interconverts with time: on the macroscopic time and space scale, the compound appears to be formed of a unique phase that would correspond to the time and space averaged mix of α/β with possibly a few domains that are pure α structures.
Around 210 K, the free energy of the α and β structures has becomes equal, the relative α/β populations become slowly constant and only a small fraction of the α structures converts into β structures. From the DSC enthalpy value and the computed energy difference between α and β structures it can be estimated that only 2% of the α structures dynamically converts to β structures. As the conversion from α to β structures implies a nucleation process, this could explain the hysteresis in the DSC curve. At higher temperatures, the fluctuations in the parameters become even much larger than the separation between the sub-domains that become more and more difficult to separate: α/β-domains melt into a unique dynamic phase. The global phase appears to be homogeneous with properties that are the average of the two concomitant domains as proved by a comparison of the averaged lattice and bond length properties that compare very well with the experimental data. The increase of the thermal expansion coefficient along a continues to increase even more (Fig. S8†) since the system explores a larger phase space in the α/β-domain “melt”, inducing a more important anharmonic contribution to the thermal expansion.
The transition between the low and high temperature systems can be characterized by computing 〈Etot〉 − 〈2Ekin〉 with 〈Etot〉 the average total energy and 〈Ekin〉 the kinetic energy. The virial theorem requires that 〈Etot〉 − 〈2Ekin〉 = 0 for perfect harmonic oscillators. Fig. S30† shows that for temperatures below 200 K the computed dynamics have a moderate anharmonicity behavior while above 200 K there is a global increase of the anharmonic behavior of the α-domains associated with an important deviation from harmonicity for the β-domains.
Conclusions
In summary we have shown that the organic semiconductor BHH-BTBT, belonging to a wider class of structurally similar compounds based on fused thiophene units, displays extremely large negative and positive thermal expansion over the investigated temperature range of 200 K and that it displays anomalies around 210 K in derived geometrical parameters as well as in UV-VIS spectroscopy data. The unique feature of this study combining state-of-the-art experiments and theoretical calculations is that we were able to show that there exists a low-temperature state consisting of one domain and a high-temperature phase consisting of two dynamic concomitant domains permanently exchanging. The transition between the two states is not a classical discontinuous phase-to-phase transition, but presents a quasi-continuity of all geometric parameters very similar to the ones observed in supercritical transitions. Nevertheless it is responsible for the anomalies observed in geometrical parameters derived from X-ray diffraction experiments, UV-VIS spectroscopy and DSC measurements. It is expected that this solid-state supercritical transition is not an isolated case limited to an organic semiconductor, but that isosymmetrical transitions in other compounds will be recognized as such as well, as was done, for example, by Swainson et al. for the transition in ammonium hexafluorophosphate.46The dynamic co-existence of the two domains is in itself not the only factor that causes the extreme expansions but it enhances it considerably by amplifying the anharmonicity; steric hindrance between adjacent thiophene units is the primary structural reason for the NTE in this compound. Combining the excellent electrical properties with the atypical thermo-mechanical properties could lead to multipurpose temperature dependent electronic devices. It is not uncommon that a NTE material exhibits coexisting negative properties, such as a negative Poisson ratio or negative compressibility,47 but this has not yet been investigated for BHH-BTBT.
The question why BHH-BTBT has exceptionally atypical thermal expansion, and the related compound C8-BTBT not, is difficult to answer. The presence of the hydrogen-bonded network between the alternating layers could be a decisive factor in the sense that it appears to switch the orientation of two adjacent BTBT cores in FE stacking by 180° (Fig. S27†) compared to all other BHH-BTBT structures in the CSD, but in the absence of any structural data of other BHH-BTBT compounds with hydrogen bonded networks, this is not more than a hypothesis. From DFT calculations it results that the relative orientation of two adjacent FE C8-BTBT cores is about 6 meV per core more stable than that in BHH-BTBT. With such a small energy difference other structural factors or kinetic effects during the crystallization could be more decisive for the orientation that emerges.
Conflicts of interest
The authors declare no conflict of interest.Acknowledgements
AvdL wishes to thank Jean-Claude Daran (Toulouse) for some very early remarks on the crystallography of BHH-BTBT. GHR gratefully acknowledges financial support from the CNRS. JSF acknowledges support from the French computational resource centers IDRIS and CINES, under Contract No. 0911750. All authors wish to thank the financial support from ANR grants “projet blanc ANR-13-BS07-0004-CrystOS” and “projet progelec ANR-13-PRGE-0006-Helios”.References
- W. Miller, C. W. Smith and D. S. Mackenzie, J. Mater. Sci., 2009, 44, 5441–5451 CrossRef CAS.
- C. Lund, Materials, 2012, 5, 1125–1154 CrossRef PubMed.
- J. Chen, L. Hu, J. Deng and X. Xing, Chem. Soc. Rev., 2015, 44, 3522–3567 RSC.
- K. D. Tran, T. J. Groshens and J. G. Nelson, Mater. Sci. Eng., A, 2001, 303, 234–240 CrossRef.
- O. Sigmund and S. Torquato, J. Mech. Phys. Solids, 1997, 45, 1037–1067 CrossRef CAS.
- H. Janocha, Springer Science & Business Media, 2007 Search PubMed.
- W. Zhou, H. Wu, T. Yildirim, J. R. Simpson and A. R. Hight Walker, Phys. Rev. B, 2008, 78, f054114 Search PubMed.
- A. Katrusiak and W. Cai, Nat. Commun., 2014, 5, f4337 Search PubMed.
- H.-L. Zhou, Y.-B. Zhang, J.-P. Zhang and X.-M. Chen, Nat. Commun., 2015, 6, f6917 CrossRef PubMed.
- S. Henke, A. Schneemann and R. A. Fischer, Adv. Funct. Mater., 2013, 23, 5990–5996 CrossRef CAS.
- T. A. Mary, J. S. O. Evans, T. Vogt and A. W. Sleight, Science, 1996, 272, 90–92 CAS.
- K. Takenaka, Y. Okamoto, T. Shinoda, N. Katayama and Y. Sakai, Nat. Commun., 2017, 8, f14102 CrossRef PubMed.
- A. L. Goodwin, M. Calleja, M. J. Conterio, M. T. Dove, J. S. O. Evans, D. A. Keen, L. Peters and M. G. Tucker, Science, 2008, 319, 794–797 CrossRef CAS PubMed.
- S. J. Hunt, M. J. Cliffe, J. A. Hill, A. B. Cairns, N. P. Funnell and A. L. Goodwin, CrystEngComm, 2015, 17, 361–369 RSC.
- M. K. Panda, T. Runčevsk, S. C. Sahoo, A. A. Belik, N. K. Nath, R. E. Dinnebier and P. Naumov, Nat. Commun., 2014, 5, f4811 CrossRef PubMed.
- E. R. Engel, V. J. Smith, C. X. Bezuidenhout and L. J. Barbour, Chem. Commun., 2014, 50, 4238–4241 RSC.
- D. Das, T. Jacobs and L. J. Barbour, Nat. Mater., 2010, 9, 36–39 CrossRef CAS PubMed.
- M. K. Panda, R. Centore, M. Causà, A. Tuzi, F. Borbone and P. Naumov, Sci. Rep., 2016, 6, f29610 CrossRef PubMed.
- G. H. Greyling, "Negative thermal expansion of organic materials", Stellenbosch University, MSc thesis, 2011 Search PubMed.
- D. P. van Heerden, C. Esterhuysen and L. J. Barbour, Dalton Trans., 2016, 45, 4141–4149 RSC.
- Y. Yuan, G. Giri, A. L. Ayzner, A. P. Zoombelt, S. C. B. Mannsfeld, J. Chen, D. Nordlund, M. F. Toney, J. Huang and Z. Bao, Nat. Commun., 2014, 5, f3005 Search PubMed.
- R. Janneck, N. Pilet, S. P. Bommanaboyena, B. Watts, P. Heremans, J. Genoe and C. Rolin, Adv. Mater., 2017, 29, f1703864 CrossRef PubMed.
- L. Lyu, D. Niu, H. Xie, Y. Zhao, N. Cao, H. Zhang, Y. Zhang, P. Liu and Y. Gao, Phys. Chem. Chem. Phys., 2017, 19, 1669–1676 RSC.
- A. N. Sokolov, S. Atahan-Evrenk, R. Mondal, H. B. Akkerman, R. S. Sánchez-Carrera, S. Granados-Focil, J. Schrier, S. C. B. Mannsfeld, A. P. Zoombelt, Z. Bao and A. Aspuru-Guzik, Nat. Commun., 2011, 2, f437 CrossRef PubMed.
- K. Nakayama, Y. Hirose, J. Soeda, M. Yoshizumi, T. Uemura, M. Uno, W. Li, M. J. Kang, M. Yamagishi, Y. Okada, E. Miyazaki, Y. Nakazawa, A. Nakao, K. Takimiya and J. Takeya, Adv. Biomater., 2011, 23, 1626–1629 CAS.
- Y. Kiyota, T. Kadoya, K. Yamamoto, K. Iijima, T. Higashino, T. Kawamoto, K. Takimiya and T. Mori, J. Am. Chem. Soc., 2016, 138, 3920–3925 CrossRef CAS PubMed.
- G. H. Roche, Y.-T. Tsai, S. Clevers, D. Thuau, F. Castet, Y. H. Geerts, J. J. E. Moreau, G. Wantz and O. J. Dautel, J. Mater. Chem. C, 2016, 4, 6742–6749 RSC.
- C. Wang, H. Dong, L. Jiang and W. Hu, Chem. Soc. Rev., 2018, 47, 422–500 RSC.
- Y. Li, V. Coropceanu and J.-L. Brédas, J. Phys. Chem. Lett., 2012, 3, 3325–3329 CrossRef CAS.
- N. L. Allan, G. D. Barrera, T. H. K. Barron and M. B. Taylor, Int. J. Thermophys., 2001, 22, 535–546 CrossRef CAS.
- Y. Wang, Z. K. Liu and L. Q. Chen, Acta Mater., 2004, 52, 2665–2671 CrossRef CAS.
- H. Zhang, S. L. Shang, Y. Wang, A. Saengdeejing, L. Q. Chen and Z. K. Liu, Acta Mater., 2010, 58, 4012–4018 CrossRef CAS.
- Y. N. Heit and G. J. O. Beran, Acta Crystallogr., Sect. B: Struct. Sci., Cryst. Eng. Mater., 2016, 72, 514–529 CAS.
- M.-C. Chen, S. Vegiraju, C.-M. Huang, P.-Y. Huang, K. Prabakaran, S. L. Yau, W.-C. Chen, W.-T. Peng, I. Chao, C. Kim and Y.-T. Tao, J. Mater. Chem. C, 2014, 2, 8892–8902 RSC.
- Y. Liu, C.-A. Di, C. Du, Y. Lu, K. Liu, W. Qiu and G. Yu, Chem.–Eur. J., 2010, 16, 2231–2239 CrossRef CAS PubMed.
- Y. Sun, Y. Ma, Y. Liu, Y. Lin, Z. Wang, Y. Wang, C. Di, K. Xiao, X. Chen, W. Qiu, B. Zhang, G. Yu, W. Hu and D. Zhu, Adv. Funct. Mater., 2006, 16, 426–432 CrossRef CAS.
- T. Izawa, E. Miyazaki and K. Takimiya, Adv. Mater., 2008, 20, 3388–3392 CrossRef CAS.
- H. Mieno, T. Yasuda, Y. S. Yang and C. Adach, Chem. Lett., 2014, 43, 293–295 CrossRef CAS.
- C. R. Groom, I. J. Bruno, M. P. Lightfoot and S. C. Ward, Acta Crystallogr., Sect. B: Struct. Sci., Cryst. Eng. Mater., 2016, 72, 171–179 CrossRef CAS PubMed.
- D. Quigley and M. I. J. Probert, J. Chem. Phys., 2004, 120, 11432–11441 CrossRef CAS PubMed.
- S. Haas, B. Batlogg, C. Besnard, M. Schiltz, C. Kloc and T. Siegrist, Phys. Rev. B, 2007, 76, f205203 CrossRef.
- T. Siegrist, C. Besnard, S. Haas, M. Schiltz, P. Pattison, D. Chernyshov, B. Batlogg and C. Kloc, Adv. Mater., 2007, 19, 2079–2082 CrossRef CAS.
- G. G. Simeoni, T. Bryk, F. A. Gorelli, M. Krisch, G. Ruocco, M. Santoro and T. Scopigno, Nat. Phys., 2010, 6, 503–507 CrossRef CAS.
- D. K. Banuti, J. Supercrit. Fluids, 2015, 98, 12–16 CrossRef CAS.
- A. G. Christy, Acta Crystallogr., Sect. B: Struct. Sci., 1995, 51, 753–757 CrossRef.
- I. P. Swainson, R. P. Hammond, J. K. Cockcroft and R. D. Weir, Phys. Rev. B, 2002, 66, f174109 CrossRef.
- C. Huang and L. Chen, Adv. Mater., 2016, 28, 8079–8096 CrossRef CAS PubMed.
Footnote |
| † Electronic supplementary information (ESI) available: Diffraction and crystallography, Cambridge Structural Database survey, DFT computational details, UV spectroscopy, differential scanning calorimetry, and optical microscopy. CCDC 1810678–1810688. For ESI and crystallographic data in CIF or other electronic format see DOI: 10.1039/c8sc00159f |
| This journal is © The Royal Society of Chemistry 2018 |