
 Open Access Article
 This Open Access Article is licensed under a Creative Commons Attribution-Non Commercial 3.0 Unported Licence
Models for aerobic carbon monoxide dehydrogenase: synthesis, characterization and reactivity of paramagnetic MoVO(μ-S)CuI complexes†
Craig
Gourlay‡
a,
David J.
Nielsen
 a,
David J.
Evans
a,
Jonathan M.
White
ab and
Charles G.
Young
*c
a,
David J.
Evans
a,
Jonathan M.
White
ab and
Charles G.
Young
*c
aSchool of Chemistry, University of Melbourne, Victoria 3010, Australia
bBio21 Molecular Science and Biotechnology Institute, University of Melbourne, Victoria 3010, Australia
cDepartment of Chemistry and Physics, La Trobe Institute for Molecular Science, La Trobe University, Melbourne, Victoria 3086, Australia. E-mail: Charles.Young@latrobe.edu.au
First published on 20th November 2017
Abstract
Reaction of [CoCp2][TpiPrMoOS(OAr)] [Cp = η5-cyclopentadienyl; TpiPr = hydrotris(3-isopropylpyrazol-1-yl)borate; OAr = phenolate or derivative thereof] with [Cu(NCMe)(Me3tcn)]BF4 (Me3tcn = 1,4,7-trimethyl-1,4,7-triazacyclononane) in MeCN at −30 °C results in the formation of red-brown/black, paramagnetic, μ-sulfido-Mo(V)/Cu(I) complexes, TpiPrMoO(OAr)(μ-S)Cu(Me3tcn). The complexes possess the MoO(μ-S)Cu core found in aerobic carbon monoxide dehydrogenases (CODHs) and exhibit X-band EPR spectra closely related to those of semi-reduced CODH, with giso ∼ 1.937, hyperfine coupling to 95,97Mo (aiso = 39–42 × 10−4 cm−1) and strong superhyperfine coupling to 63,65Cu (aiso = 34–63 × 10−4 cm−1). Anisotropic spectra exhibit monoclinic symmetry with g1 ∼ 1.996, g2 ∼ 1.944 and g3 ∼ 1.882, and nearly isotropic ACu values (75–90 × 10−4 cm−1). The X-ray structures of four derivatives (Ar = Ph, C6H4tBu-2, C6H4sBu-2, C6H4Ph-4) are reported and discussed along with that of the Ar = C6H3tBu2-3,5 derivative (communicated in C. Gourlay, D. J. Nielsen, J. M. White, S. Z. Knottenbelt, M. L. Kirk and C. G. Young, J. Am. Chem. Soc., 2006, 128, 2164). The complexes exhibit distorted octahedral oxo-Mo(V) and distorted tetrahedral Cu(I) centres bridged by a single bent μ-sulfido ligand, with Mo–S and Cu–S distances and Mo–S–Cu angles in the ranges 2.262–2.300 Å, 2.111–2.134 Å and 115.87–134.27°, respectively. The 2 t-butyl derivative adopts a unique phenolate conformation with O![[double bond, length as m-dash]](https://www.rsc.org/images/entities/char_e001.gif) Mo–O–Cα and OMo–S–Cu torsion angles of 92.7 and 21.1°, respectively, very different from those of the other structurally characterized derivatives (31–47 and 33–45°, respectively) and exhibits a relatively short Mo⋯Cu distance [3.752(2) Å vs. 3.806(7)–4.040(2) Å]. As well, the aCu value of this complex (34.3 × 10⁻⁴ cm−1) is much lower than the values observed for other members of the series (55–63 × 10−4 cm−1), supporting the hypothesis that the electronic structure of the MoO(μ-S)Cu core unit and the degree of intermetallic communication are strongly dependent on the geometry of the MoO(OR)(μ-S)Cu unit. The complexes participate in an electrochemically reversible Mo(VI)/Mo(V) redox couple and react with cyanide undergoing decupration and desulfurization reactions of the type observed for CODH.
Mo–O–Cα and OMo–S–Cu torsion angles of 92.7 and 21.1°, respectively, very different from those of the other structurally characterized derivatives (31–47 and 33–45°, respectively) and exhibits a relatively short Mo⋯Cu distance [3.752(2) Å vs. 3.806(7)–4.040(2) Å]. As well, the aCu value of this complex (34.3 × 10⁻⁴ cm−1) is much lower than the values observed for other members of the series (55–63 × 10−4 cm−1), supporting the hypothesis that the electronic structure of the MoO(μ-S)Cu core unit and the degree of intermetallic communication are strongly dependent on the geometry of the MoO(OR)(μ-S)Cu unit. The complexes participate in an electrochemically reversible Mo(VI)/Mo(V) redox couple and react with cyanide undergoing decupration and desulfurization reactions of the type observed for CODH.
Introduction
Carboxydotropic microorganisms employ carbon monoxide as their sole source of carbon and energy while acetogenic and methanogenic microbes convert carbon dioxide to carbon monoxide during the production of energy and/or cellular carbon via the Wood-Lungdahl pathway.1–4 These processes rely on the interconversion of CO and CO2 by Fe/Ni1–6 and Mo/Cu1–4,7,8 carbon monoxide dehydrogenases (CODHs), operative in anaerobic and aerobic organisms, respectively. It has been estimated that each year 200–600 million tonnes of atmospheric CO are converted into CO2 by microbial activity.4 This process contributes to the global carbon cycle and helps maintain atmospheric CO levels below those toxic to respiring organisms, including humans. Acetogens also contribute to the carbon cycle and are estimated to produce over 10 billion tonnes of acetic acid annually.2The CODH from Oligotropha carboxidovorans is an (αβγ)2 hexamer, with a large sub-unit (88.7 kDa) containing a unique heterobimetallic Mo/Cu active site and two smaller subunits (30.2 kDa) each containing FAD or ferredoxin-like [2Fe–2S] clusters.1–4,7,8 The oxidized active site (Fig. 1) contains a five-coordinate, square pyramidal oxo-Mo(VI) centre linked to a ‘two-coordinate’, nearly linear Cu(I) centre via a single bent μ-sulfido ligand. Initial crystallographic studies indicated the presence of an [(MCD)MoVIO(OH)(μ-S)CuI(SCys388)] (MCD = molybdopterin cytosine dinucleotide) moiety but EXAFS, computational studies and more recent crystallographic results favor the presence of an [(MCD)MoVIO2(μ-S)CuI(SCys388)] active site1–4,7,8 The most recent computational study also supports the presence of a dioxo-MoVI core and a protonated Glu763 in the active oxidized enzyme.9 A water molecule 2.4 Å from the Cu atom and H-bonded to the MoO/–OH unit and amino acid residues is also present but is displaced upon CO binding and turnover (not shown in Fig. 1). The enzyme is a member of the xanthine oxidase (XnO) family of enzymes and, like other members of the family, reacts with cyanide to produce an inactive decupro-desulfo ‘trioxo-based’ form of the enzyme (cf. desulfo XnO).1–4,7,8
 | ||
| Fig. 1 Simplified view of the active site of O. carboxidovorans CODH (PDB code 1N5W10). Only the molybdopterin (MPT) portion of MCD is shown (grey, blue, red and orange spheres represent C, N, O and P atoms, respectively). | ||
The enzyme has been characterized by a variety of advanced spectroscopic techniques including electron paramagnetic resonance (EPR) and electron-nuclear double resonance (ENDOR).7,8,11 The diamagnetic, oxidized MoVICuI form of CODH can be reduced by a variety of reagents to generate paramagnetic MoVCuI forms exhibiting multi-line EPR spectra featuring couplings to magnetic nuclei at or near the active site; these nuclei include 95,97Mo (I = 5/2, 25% total abundance), 63,65Cu (I = 3/2, 100%), solvent-exchangeable protons (1H, I = 1/2, ∼100%) and 13C (I = 1/2, when 99% enriched 13CO is employed). One of the earliest ‘bona fide’ frozen-glass EPR signals of CODH, elicited upon reduction of active, wild-type enzyme by dithionite, is reproduced in Fig. 2(a).12 Initially, the spectrum was not well understood and it was interpreted as evidence against Cu being an integral component of the enzyme, the signal being very different to that typical of Cu(II) species. The observation of closely related signals in the EPR spectra of the title MoVO(μ-S)CuI complexes, described herein and communicated earlier,13 was instrumental in defining the origin and aiding the correct interpretation of enzyme EPR spectra, the ‘4-line’ EPR spectra of both systems being due to superhyperfine coupling of the d1 Mo(V) electron to 63,65Cu.
 | ||
| Fig. 2 Selected X-band EPR spectra elicited by dithionite reduction of CODH. (a) Dithionite-reduced CODH in 50 mM HEPES, pH 7.2. Spectrum adapted from ref. 14 but first reported in ref. 12. (b) Dithionite-reduced CODH in 400 mM bicarbonate, pH 8. Vertical dashed bars indicate g1–3 values while vertical full bars indicate associated 4-line Cu superhyperfine splittings. Spectrum adapted from ref. 15. | ||
More recent EPR and ENDOR studies by Hille and coworkers15–18 have greatly advanced this area, with higher resolution spectra exhibiting 63,65Cu coupling (with some coincidental overlap) to each of the principal components of the g-tensor. For example, dithionite reduction of CODH in 400 mM bicarbonate buffer at pH 8 yields the frozen-glass spectrum shown in Fig. 2(b), which has been interpreted in terms of nearly isotropic 63,65Cu coupling (〈A〉 = 67.2 × 10⁻⁴ cm−1) to g1–3 (2.0020, 1.9618 and 1.9548, respectively).15 Similar splittings are observed in spectra generated by the reduction of CODH with CO or H2, the appearance of the spectra varying with g- and A-values, reaction conditions, pH, the presence of proton superhyperfine interactions and isotopic compositions.16 These studies, along with associated kinetics16 and computational investigations,9,18–20 have informed our understanding of the intimate mechanism of the enzyme8 and the role of electronic structure on enzyme behavior and function.21
The biological association of Mo and Cu extends beyond CODH. Perhaps the longest known association is in the area of Cu–Mo antagonism, which leads to Cu deficiency and anaemia, diarrhoea and growth retardation in ruminants.22 Here, the complexation of Cu(I) by thiomolybdate in the rumen of the animals is thought to be responsible for the observed Cu deficiency. More recently, the antagonistic interactions of Mo and Cu have been implicated in complications arising from diabetes mellitus type 2 in humans, e.g., renal dysfunction/failure, cardiac abnormalities, retinopathy, neuropathy and atherosclerosis.23 Similar species may be involved in the therapeutic use of thiomolybdate to reduce the high Cu levels associated with Wilson's disease.22 There is also evidence for a trinuclear [S2Mo(μ-S)2Cu(μ-S)2MoS2]3− unit in the so-called orange protein, a potential Cu scavenging or metal storage protein, isolated from Desulfovibrio gigas.24,25
In synthetic chemistry, heterobimetallic Mo/Cu compounds have been extensively studied on account of their biological relevance (vide supra),26 unusual structural and electro-optical properties27,28 and potential as catalysts.22 They range from small dinuclear species such as [S2Mo(μ-S)2Cu(CN)]2− to large clusters, polymers and supramolecular materials; all involve di-μ-sulfido linkages between Mo and Cu, the vast majority being derived from sulfur-rich Mo precursors, e.g., tetrathiomolybdate, and Cu(I) (cf. Mo–Cu antagonism).28–34 Molybdenum/copper compounds containing terminal oxo ligands are relatively rare and exhibit three principal core structures, (A)–(C) [X = halide, pseudohalide, thiolate, L = η5-cyclopentadienyl (Cp). The Cu ligands and charges are more variable for (C)], with the Mo and Cu centres again linked through di-μ2-sulfido or μ3-sulfido bridging units.28–34 The formation of di-μ-sulfido bridges between Mo and Cu appears to be strongly thermodynamically favored and has thwarted efforts to form singly-bridged MoO(μ-S)Cu models of CODH.26

The first good models for CODH (D) were reported by Tatsumi and coworkers in 2005.35 The best of these models, (NEt4)2[(bdt)MoO(μ-S)2Cu(SPh)] (bdt = benzene-1,2-dithiolate), contained a square pyramidal oxo-Mo(VI) centre linked to a three-coordinate, trigonal Cu(I) centre by a di-μ-sulfido bridge, with pseudo-dithiolene and thiophenolate ligands emulating the (Mo) MCD and (Cu) Cys388 ligands, respectively, of CODH. The complex has much in common with the active site of CODH [red highlights in (D)], the presence of a di-μ-sulfido bridge being a notable difference between the model and the enzyme. Related W complexes, e.g., (NEt4)2[(bdt)WO(μ-S)2Cu(SSiPh3)], were subsequently reported by Groysman et al.36
A short time later, we communicated the synthesis and characterization of the paramagnetic complexes TpiPrMoVO(OAr)(μ-S)CuI(Me3tcn) (E) (TpiPr = hydrotris(3-isopropylpyrazol-1-yl)borate; OAr = −OC6H3tBu2-3,5 and −OC6H4Ph-4; Me3tcn = 1,4,7-trimethyl-1,4,7-triazacyclononane), as models for the EPR-active, semi-reduced forms of CODH.13 These complexes have the distinction of being the only species to contain the singly-bridged MoO(μ-S)Cu core found in CODH [red highlights in (E)]. Significantly, the complexes exhibited enzyme-like EPR spectra featuring strong superhyperfine coupling of the unpaired d1 Mo(V) electron to the neighboring 63,65Cu centre. The EPR spectra of the complexes provided key insights into the EPR spectra, electronic communication and orbital control of reactivity in the enzyme.13 More recently, Zhang et al.28 have reported hydrotris(3,5-dimethylpyrazol-1-yl)borate (Tp*) complexes NEt4[Tp*MoO(μ-S)2CuX] (X = I−, CN−); interest in these and related compounds is centred on their electro-optical properties.
Herein, we report the synthesis and full characterization of the TpiPrMoO(OAr)(μ-S)Cu(Me3tcn) complexes (E), 1–7 (Chart 1), the crystal structures of four derivatives (1, 2, 3 and 5) and the enzyme-like EPR properties and cyanolysis reactions of the complexes. The report underscores the usefulness of scorpionate ligands to stabilize species containing chromophores (active site components) of biological relevance.37 It also contributes to our knowledge of paramagnetic, EPR-active Mo(V) species,38 specifically unprecedented heterobimetallic Mo(V)Cu(I) species of direct relevance to CODH.
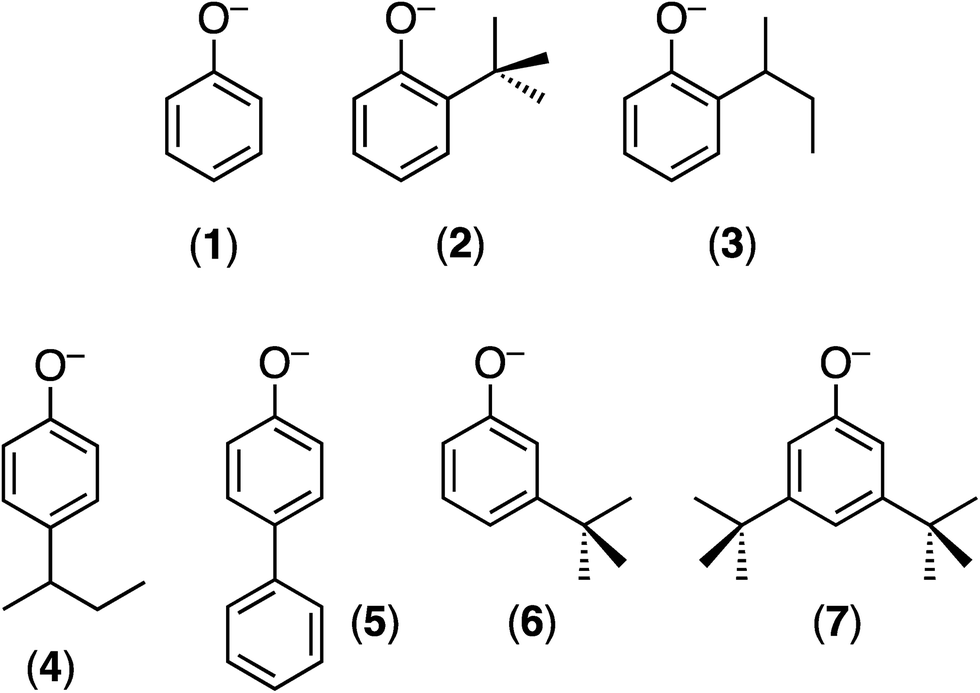 | ||
| Chart 1 The monoanionic OAr ligands employed and the numbers identifying their TpiPrMoO(OAr)(μ-S)Cu(Me3tcn) (E) derivatives. | ||
Experimental
Materials and methods
The precursor compounds [CoCp2][TpiPrMoOS(OAr)],39 Me3tcn,40 [Cu(NCMe)4]BF4 (ref. 41) and [Cu(CO)(Me3tcn)]BF4 (ref. 42) were prepared using literature methods or slight modifications thereof. All reactions and manipulations were performed under strictly anaerobic (N2) and anhydrous conditions using standard Schlenk techniques and dried, deoxygenated solvents. Infrared spectra were recorded on a Biorad FTS 165 FTIR spectrophotometer as KBr discs or in solutions in MeCN (prepared in a glove-box). Mass spectra were obtained using a Quattro II Micromass Triple-Quad mass spectrometer operating in the positive ion mode with capillary voltages between 30 and 120 V on solutions of the complexes in MeCN. EPR spectra were recorded on a Bruker FT ECS-106 spectrometer at X-band frequencies using 1,1-diphenyl-1,2-picrylhydrazyl as reference. Isotropic (room temperature) and anisotropic (110 K) spectra were recorded using solutions of the complexes in 10![[thin space (1/6-em)]](https://www.rsc.org/images/entities/char_2009.gif) :1 tetrahydrofuran(thf)/MeCN or MeCN, respectively. Spectra were simulated using the EasySpin toolbox in the MATLAB software package.43 Electrochemical experiments were performed on a Cypress Electrochemical System II using a 3 mm glassy-carbon working electrode and platinum auxiliary electrode. The reference electrode consisted of an Ag/AgNO3 (0.01 M in MeCN) electrode incorporated into a salt-bridge containing supporting electrolyte to minimize Ag+ leaching into solution. Samples were prepared in solutions of MeCN/0.1 M NBun4PF6 cooled to 243 K, and scans were calibrated using ferrocene as an internal reference.44 Potentials are reported relative to the Saturated Calomel Electrode (SCE).44 Microanalyses were obtained from Atlantic Microlab Inc., GA.
:1 tetrahydrofuran(thf)/MeCN or MeCN, respectively. Spectra were simulated using the EasySpin toolbox in the MATLAB software package.43 Electrochemical experiments were performed on a Cypress Electrochemical System II using a 3 mm glassy-carbon working electrode and platinum auxiliary electrode. The reference electrode consisted of an Ag/AgNO3 (0.01 M in MeCN) electrode incorporated into a salt-bridge containing supporting electrolyte to minimize Ag+ leaching into solution. Samples were prepared in solutions of MeCN/0.1 M NBun4PF6 cooled to 243 K, and scans were calibrated using ferrocene as an internal reference.44 Potentials are reported relative to the Saturated Calomel Electrode (SCE).44 Microanalyses were obtained from Atlantic Microlab Inc., GA.
Synthesis of [Cu(NCMe)(Me3tcn)]BF4
A solution of [Cu(NCMe)4]BF4 (2.08 g, 6.60 mmol) in 40 mL of 10:1 thf/MeCN was treated dropwise with Me3tcn (1.15 g, 6.71 mmol) and stirred for 16 h. The resultant white crystalline solid was isolated by filtration and recrystallized from MeCN/diethyl ether. The white crystals were filtered, washed with cold diethyl ether (2 × 5 mL) and dried in vacuo. Yield 1.87 g, 70%.
Synthesis of TpiPrMoO(OAr)(μ-S)Cu(Me3tcn) complexes
Acetonitrile (5 mL) cooled to −30 °C was added to a mixture of [CoCp2][TpiPrMoOS(OAr)] (400 mg, 0.45–0.47 mmol) and [Cu(NCMe)(Me3tcn)]BF4 (184–192 mg, 0.45–0.47 mmol) (or an equivalent amount of [Cu(CO)(Me3tcn)]BF4) resulting in the formation of a brown solution. The solution was stirred for 5 minutes and the solvent was removed in vacuo. Diethyl ether (15 mL) cooled to −30 °C was added and the suspension was triturated at −30 °C. The suspension was filtered to remove a brown solid (mainly [CoCp2]BF4), which was washed with diethyl ether (2 × 10 mL). The combined filtrate and washings was reduced to minimum volume and stored at −30 °C overnight. The brown crystals that precipitated were isolated by filtration, washed with cold MeCN (1 mL, −30 °C) and dried in vacuo. Yields range from 30–53% (see ESI†).Reactions with cyanide
In a typical experiment TpiPrMoO(OAr)(μ-S)Cu(Me3tcn) (20 mg, 0.022–0.026 mmol) and KCN or NEt4CN (4 equivalents) were dissolved in CH2Cl2 or 10:1 thf/MeCN and stirred at ambient temperature. Reactions were monitored by EPR spectroscopy and mass spectrometry. Detection of thiocyanate was achieved by mixing the reaction mixture with three equivalents of Sorbo's reagent,45 followed by stirring of the reaction mixture for 5 min in the absence of light. UV-visible spectrophotometry was then used to detect the characteristic absorbance at 460 nm that is indicative of thiocyanate.
X-ray crystallography
Diffraction-quality crystals of 1, 2, 3 and 5 (as various MeCN solvates) were grown by slowly cooling MeCN solutions of the complexes to −30 °C under anaerobic conditions. Diffraction data were collected at 132 K over a 2θ range of 2–28.5° using a Bruker CCD area detector and graphite-monochromated Mo Kα radiation (λ = 0.71073 Å). Cell parameters were acquired by the SMART software package and data reductions were performed using SAINT.46 Structures were solved by direct methods (SHELXS-97) and refined using full-matrix least-squares refinement on F2 (SHELXL-2014).47 Non-hydrogen atoms were refined anisotropically while hydrogen atoms were included in calculated positions using the riding model. Molecular projections (drawn at the 50% probability level (except 2 at 60%) with solvent molecules and hydrogen atoms removed for clarity) were generated using Mercury48 and CAChe49 software. X-ray crystallographic data for 1, 2, 3 and 5: CCDC 1576257–1576260, respectively.†Results and discussion
Syntheses
The reactions of [CoCp2][TpiPrMoOS(OAr)] with one equivalent of [CuL(Me3tcn)]BF4 (L = NCMe, CO) resulted in the rapid formation of paramagnetic, red-brown/black TpiPrMoO(OAr)(μ-S)Cu(Me3tcn), according to eqn (1). There was no evidence (e.g., by solution IR spectroscopy) of the formation of any Mo–Cu-carbonyl intermediates in the reactions involving [Cu(CO)(Me3tcn)]BF4. Related Mo(VI) complexes, e.g., TpiPrMoOS(OAr) and TpiPrMoO2(OAr), were unreactive towards Cu complexes.| [CoCp2][TpiPrMoOS(OAr)] + [CuL(Me3tcn)]BF4 → TpiPrMoO(OAr)(μ-S)Cu(Me3tcn) + [CoCp2]BF4 + L | (1) |
The reactions were performed in MeCN at −30 °C to limit thermal decomposition of the products. Isolation of the complexes generally involved evaporation of the solvent, trituration of the residue with diethyl ether and removal of insoluble [CoCp2]BF4 (identified by IR: [CoCp2]+, 863 and 461 cm−1; BF4−, 1085 and 1029 cm−1), volume reduction of the filtrate and cooling to induce crystallization of the product. Less-soluble derivatives, e.g., 2, 3 and 5, could be isolated directly from the reaction mixture by volume reduction and cooling to induce crystallization.
The complexes are highly air- and moisture-sensitive in solution and the solid state. In air, solid samples show signs of decomposition, into inter alia TpiPrMoO2(OAr) (detected by IR), within minutes, with complete decomposition within an hour. The complexes are also thermally unstable; accordingly, solutions must be handled at low temperature (<−30 °C) and solids should be stored in a refrigerator. Decomposition produced a variety of complexes, e.g., [TpiPrMoO]2(μ-O)(μ-S2),50 TpiPrMoO(OAr)2, TpiPrMoO(OSAr′) (OSAr′ = 2-mercaptophenolate derivative39,51) and TpiPrMoOCl(OAr) (with CH2Cl2) depending on solvent and conditions; the fate of the Cu remains unclear. Generally, the complexes are highly soluble in MeCN and chlorinated solvents and partially soluble in diethyl ether, thf, toluene and hexane.
Characterization
The complexes were characterized by microanalytical, mass spectrometric, spectroscopic, electrochemical and X-ray crystallographic techniques. Microanalytical and mass spectrometric data were consistent with the proposed formulations (see ESI†). IR spectra exhibited bands diagnostic of TpiPr [ν(BH) ∼ 2445 and 2480 cm−1 and ν(CN) ∼ 1510 cm−1] and a single, strong band indicative of an MoO group [ν(MoO) ca. 900 cm−1] [cf. ∼ 890 cm−1 for [CoCp2][TpiPrMoVOS(OAr)]39 and ∼910 cm−1 for TpiPrMoVIOS(OAr)51]. The exception was complex 2, which displayed two solid state IR bands in the ν(MoO) region (at 922 and 932 cm−1); these are likely to result from solid state effects as a single band at 918 cm−1 is observed in solution (MeCN) spectra. The stronger MoO bond in 2 [indicated by the higher ν(MoO)] reflects MoO σ- and π-bond stabilization due to the greater effective nuclear charge (Zeff) of Mo, a likely consequence of the unique geometry and reduced electronic delocalization from Mo to Cu in this complex (vide infra). The IR spectra were rich in co-ligand (OAr and Me3tcn) bands, including strong bands assigned to phenolate ring ν(CC) modes (ca. 1260 and 1580 cm−1).52 Bands assignable to the Mo–S–Cu moiety could not be unambiguously assigned. Representative spectra (for 2 and 5) and full IR listings for all complexes are included in the ESI.†
The electrochemical properties of the complexes were investigated by cyclic voltammetry; representative voltammograms are shown in Fig. 3. Initial scans, with a starting potential of −1.5 V (to maintain the original redox levels), revealed two electrochemical processes, a reversible oxidation at negative potentials (process I) and an irreversible oxidation at positive potentials (process II) [Fig. 3(a)]. Key electrochemical parameters of these processes are given in Table 1.
 | ||
| Fig. 3 Cyclic voltammograms for complex 5 in MeCN at −30 °C. (a) Complete single-sweep cyclic voltammogram showing Processes I and II. (b) Process I, recorded at increasing scan rates (with successively greater current flows) of 20 (brown), 80, 100, 200, 300, 400 and 500 (dark blue) mV s−1. | ||
| Cmpd | Process I | Process II | ||
|---|---|---|---|---|
| E 1/2 (V) | I pa/Ipc | ΔEpp (mV) | E pc (irrev.) (V) | |
| a In order of ascending E1/2 for process I. Data (with E vs. SCE) recorded at 100 mV s−1 in MeCN at −30 °C. | ||||
| 2 | −0.514 | 0.97 | 109 | 0.413 |
| 7 | −0.504 | 0.96 | 88 | 0.283 |
| 6 | −0.488 | 0.90 | 74 | 0.367 |
| 4 | −0.458 | 0.96 | 107 | 0.430 |
| 5 | −0.414 | 0.96 | 93 | 0.419 |
| 1 | −0.407 | 1.01 | 138 | 0.345 |
| 3 | −0.366 | 0.97 | 78 | 0.387 |
Process I, at −0.514 to −0.366 V vs. SCE, was electrochemically reversible by the following criteria:53 (i) measured E1/2 values were independent of scan rate, (ii) ΔEpp values were close to the theoretical value for a one-electron reduction (57 mV) with increases with scan rate within an experimentally acceptable range, (iii) peak current ratios (Ipa/Ipc) were close to unity for all scan rates, and (iv) plots of Ip against ν1/2 indicated diffusion controlled redox [see, e.g., Fig. 3(b)]. There is a broad correlation between the Mo(VI)/Mo(V) potentials and the electron withdrawing/donating capacity of the phenolate ligands, as measured by their Hammett constants (σm,p).54 Thus, data for 1 and 4–7 fit the equation E1/2 (V) = 0.50σ − 0.41 (R2 = 0.87), indicating a lowering of the reduction potentials of the complexes (equating to more energetically favourable oxidations) with increasing ligand electron-donor capability (increasing ligand field), as observed for the Mo(VI)/(V) couples of related complexes.39,51 Accordingly, process I is assigned to the MoVICuI/MoVCuI redox couple. The Mo(VI)/Mo(V) potentials across the series are ca. 50 mV more positive than those observed for related TpiPrMoVIOS(OAr)39,51 complexes and ca. 350 mV more positive than those of TpiPrMoVIO2(OAr), except for 2 (ΔE = 531 mV) and 3 (ΔE = 466 mV).55 It is possible that the reduced Mo–Cu interaction in 2 (vide infra) results in an increase in the energy of the predominantly Mo–S π* receptor orbital and a lowering of E(MoVI/MoV) for 2 relative to the other complexes.
Process II appears at ca. +0.35 V vs. SCE and is assigned to an irreversible one-electron oxidation of [TpiPrMoVIO(OAr)(μ-S)CuI(Me3tcn)]+. A similar process is observed in the cyclic voltammogram of [Cu(NCMe)(Me3tcn)]+ and it is likely to represent the oxidation of Cu(I) to Cu(II) and decomposition of the resultant dinuclear Mo(VI)Cu(II) complex. In CODH, the molybdenum centre is proposed to cycle between Mo(IV) and Mo(VI) while the Cu(I) centre maintains a monovalent oxidation state.10 This is consistent with the observed oxidation of Mo(V) to Mo(VI) ahead of Cu(I) to Cu(II) in the cyclic voltammograms of the title complexes.
Crystal structures
The crystal structures of 1, 2, 3 and 5 (as various MeCN solvates) were determined and ORTEP projections of the molecules are shown in Fig. 4–7. Selected bond distances and angles are presented in Tables 2 and 3, respectively. The structure of 7, which will be discussed in the context of the current work, has been communicated elsewhere.13 Overall, the structures are very similar but there is a marked conformational difference between 2 and the other structurally characterized complexes (group 1). The structures are discussed collectively below, with separate reference (where appropriate) to the disparities between those of group 1 and 2.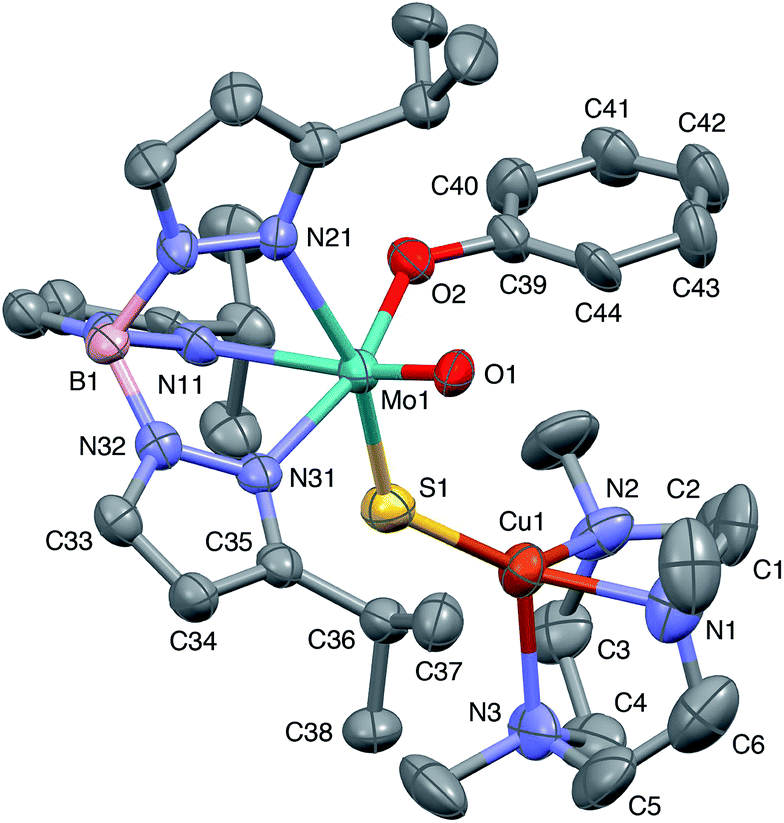 | ||
| Fig. 4 ORTEP projection for 1 showing (partial) general numbering scheme used for ring systems. Only one of the two conformers of the Me3tcn ring is shown. | ||
 | ||
| Fig. 5 ORTEP projection for 2. | ||
 | ||
| Fig. 6 ORTEP projection for 3. Only one of the two conformers of the phenolate sBu group is shown. | ||
 | ||
| Fig. 7 ORTEP projection for 5. | ||
| Parameter | 1 | 2 | 3 | 5 | 7 |
|---|---|---|---|---|---|
| a Data from ref. 13. | |||||
| Mo(1)−O(1) | 1.698(6) | 1.673(4) | 1.681(4) | 1.676(4) | 1.692(3) |
| Mo(1)−O(2) | 1.972(6) | 1.999(4) | 1.999(4) | 2.009(4) | 1.978(2) |
| Mo(1)−S(1) | 2.273(3) | 2.3004(18) | 2.268(2) | 2.262(2) | 2.2855(10) |
| Mo(1)−N(11) | 2.364(7) | 2.356(6) | 2.368(5) | 2.365(5) | 2.382(3) |
| Mo(1)−N(21) | 2.318(7) | 2.257 (5) | 2.315(5) | 2.323(5) | 2.293(3) |
| Mo(1)−N(31) | 2.220(7) | 2.214(5) | 2.226(5) | 2.226(5) | 2.225(3) |
| O(2)−C(39) | 1.392(10) | 1.338(7) | 1.373(7) | 1.349(6) | 1.337(4) |
| Cu(1)−S(1) | 2.111(3) | 2.1260(19) | 2.120(2) | 2.119(2) | 2.1336(11) |
| Cu(1)−N(1) | 2.136(9) | 2.158(5) | 2.129(6) | 2.137(6) | 2.156(4) |
| Cu(1)−N(2) | 2.104(8) | 2.131(6) | 2.148(6) | 2.121(5) | 2.156(3) |
| Cu(1)−N(3) | 2.214(9) | 2.212(6) | 2.189(6) | 2.199(6) | 2.201(4) |
| Mo(1)⋯Cu(1) | 4.040(2) | 3.752(2) | 3.928(2) | 4.028(2) | 3.806(2) |
| Parameter | 1 | 2 | 3 | 5 | 7 |
|---|---|---|---|---|---|
| a Data from ref. 13. | |||||
| Mo(1)−S(1)−Cu(1) | 134.27(13) | 115.87(9) | 126.99(10) | 133.70(9) | 118.89(5) |
| Mo(1)−O(2)−C(39) | 133.5(6) | 135.9(4) | 130.9(4) | 133.3(3) | 139.6(2) |
| O(1)−Mo(1)−S(1) | 107.6(2) | 105.19(16) | 108.6(3) | 108.15(13) | 108.19(9) |
| O(1)−Mo(1)−O(2) | 101.2(3) | 102.02(18) | 100.1(3) | 101.66(16) | 101.84(12) |
| O(1)−Mo(1)−N(11) | 162.2(3) | 167.2(2) | 160.8(2) | 162.28(15) | 162.80(13) |
| O(1)−Mo(1)−N(21) | 88.6(3) | 88.4(2) | 87.4(2) | 87.63(16) | 89.38(12) |
| O(1)−Mo(1)−N(31) | 90.2(3) | 91.1(2) | 88.31(19) | 90.04(16) | 90.10(11) |
| S(1)−Mo(1)−O(2) | 96.54(19) | 94.47(13) | 95.61(14) | 96.22(11) | 96.29(8) |
| S(1)−Mo(1)−N(11) | 88.17(19) | 86.06(12) | 87.69(14) | 87.41(13) | 86.65(8) |
| S(1)−Mo(1)−N(21) | 162.54(19) | 164.25(14) | 162.92(14) | 163.39(11) | 161.29(9) |
| S(1)−Mo(1)−N(31) | 89.7(2) | 90.46(14) | 90.67(14) | 89.65(12) | 89.52(9) |
| O(2)−Mo(1)−N(11) | 84.6(2) | 82.76(18) | 88.09(18) | 84.51(14) | 84.60(11) |
| O(2)−Mo(1)−N(21) | 86.3(3) | 90.36(18) | 87.49(18) | 85.27(13) | 85.99(11) |
| O(2)−Mo(1)−N(31) | 164.6(3) | 164.19(19) | 167.2(2) | 164.49(17) | 164.28(11) |
| N(11)−Mo(1)−N(21) | 74.9(2) | 79.68(18) | 75.61(19) | 76.25(16) | 75.05(11) |
| N(11)−Mo(1)−N(31) | 81.5(3) | 82.61(19) | 81.03(19) | 81.41(15) | 81.17(10) |
| N(21)−Mo(1)−N(31) | 83.6(3) | 81.16(19) | 83.33(19) | 85.08(16) | 83.94(11) |
| S(1)−Cu(1)−N(1) | 131.3(3) | 131.39(17) | 140.41(16) | 136.34(17) | 136.66(10) |
| S(1)−Cu(1)−N(2) | 133.5(3) | 138.58(16) | 129.92(17) | 132.85(17) | 132.77(11) |
| S(1)−Cu(1)−N(3) | 124.6(2) | 119.65(16) | 116.37(16) | 116.52(16) | 120.19(11) |
| N(1)−Cu(1)−N(2) | 84.8(3) | 83.4(2) | 83.7(2) | 85.0(2) | 83.33(13) |
| N(1)−Cu(1)−N(3) | 83.1(4) | 80.9(2) | 83.5(2) | 84.5(2) | 81.98(15) |
| N(2)−Cu(1)−N(3) | 81.6(3) | 82.5(2) | 83.5(2) | 82.5(2) | 82.24(15) |
| O(1)−Mo(1)−S(1)−Cu(1) | 44.48 | 21.13 | 33.14 | 44.90 | 38.73 |
| O(2)−Mo(1)−S(1)−Cu(1) | 59.50 | 82.59 | 69.58 | 59.59 | 66.01 |
| O(1)−Mo(1)−O(2)−C(39) | 45.07 | 92.67 | 38.82 | 46.86 | 31.27 |
The complexes feature a six-coordinate Mo(1) atom bridged to a four-coordinate Cu(1) atom via a single, bent μ-sulfido ligand S(1). The coordination sphere of Mo(1) contains a tridentate fac-TpiPr ligand and mutually cis, monodentate terminal oxo, phenolate and μ-sulfido ligands. The Mo(1) atoms lie ca. 0.28 Å out of the ‘equatorial’ planes, defined by S(1), O(2), N(21) and N(31), towards the terminal oxo atom O(1). The major distortions from octahedral geometry include the deviation of the ‘axial’ bond angles from 180° [O(1)–Mo(1)–N(11) ca. 162° for group 1 and 167° for 2] and acute TpiPr N–Mo–N angles (75–85°). The terminal oxo and phenoxide bond lengths, ranging from 1.673–1.698 Å and 1.972–2.009 Å, respectively, are typical of closely related structures.51 The Mo(1)–S(1) distances (av. 2.28 Å) are typical of values observed in Mo(μ-S)2Cu species (2.26–2.28 Å).28–34 The Mo–N distances are typical of oxosulfido-Mo-TpiPr species, the significant trans influence of the terminal oxo ligand leading to a lengthening of Mo(1)–N(11) (av. 2.37 Å) compared with Mo(1)–N(21) (av. 2.30 Å) and Mo(1)–N(31) (av. 2.22 Å).51
The distorted tetrahedral geometry of Cu(1) is defined by the ‘basal’ fac-tridentate Me3tcn ligand and the ‘apical’ μ-sulfido ligand. The major distortions from a tetrahedral geometry include N–Cu–N angles of av. 83.5° and S–Cu–N angles of ca. 120°. The Cu(1) atoms lie ca. 1.38 Å out of the basal planes. Similar distortions are observed in related complexes, e.g., [Cu(MeCN)(Me3tcn)]ClO4 and its N-alkyl derivatives.56,57 The Cu–N distances fall into two categories, Cu(1)–N(1) and Cu(1)–N(2) (av. 2.14 Å) being significantly shorter than Cu(1)–N(3) (av. 2.20 Å), the associated S(1)–Cu(1)–N angles being 129–140° for N(1) and N(2), and av. 119° for N(3). These parameters are indicative of a distortion towards a trigonal prismatic structure, with an apical N(3) atom, induced by steric interactions between the phenolate ligand and the N(1),N(2),S(1) face of the Cu polyhedron. The Cu(1)–S(1) (av. 2.12 Å) distances are slightly shorter than those observed for related Mo(μ-S)2Cu complexes (av. 2.22 Å).28–34
The phenolate rings in the group 1 complexes project away from TpiPr, lying out of the cleft between the pyrazole groups and adjacent to the N(1),N(2),S(1) face of the Cu polyhedron. The angles subtended at S(1) range from 118.89(5)° in the sterically encumbered 3,5-di-t-butyl derivative 7 to 134.27(13)° in the unsubstituted derivative 1, with the Mo(1)⋯Cu(1) distances ranging from 3.806(2) to 4.040(2) Å for 7 and 1, respectively. The torsion angles around the Mo(1)–S(1) and Mo(1)–O(2) bonds are broadly similar in all complexes (see Table 3). In contrast, the phenolate ring of 2 is nestled in a cleft of the TpiPr ligand and the t-butyl group projects away from TpiPr and into the N(1),N(2),S(1) face of the Cu polyhedron. The Mo(1)–S(1)–Cu(1) angle is only 115.87(9)° and the Mo(1)⋯Cu(1) distance is a short 3.752(2) Å. Moreover, the torsion angles around the Mo(1)–S(1) and Mo(1)–O(2) are very different from those for the group 1 complexes (see Table 3). The differences in the two conformational types are highlighted in Fig. 8. The geometry of 2 effectively reduces the Cu–S pseudo-σ* and Mo–Ophenolate π contributions to the SOMO in this complex relative to the other complexes and this is likely to account for the reduced aCu observed for 2 (vide infra). Both phenolate ligand conformations have been observed in related phenolato-Mo(V/VI) TpiPr complexes.51,55,58–60
 | ||
| Fig. 8 Superposition of structures 2 (in blue) and the members of group 1 (1, 3, 5 and 7, in grey) highlighting the two structural types observed. | ||
The structural parameters determined for the MoO(μ-S)Cu cores compare favourably with EXAFS data from oxidised and CO-reduced CODH,61 with generally comparable distances [quoted as average for group 1 followed by (2) versus oxidized/reduced enzyme, respectively] pertaining to the MoO [1.688 (1.673) Å vs. 1.737/1.700 Å], Mo–S [2.272 (2.300) Å vs. 2.289/2.495 Å] and Cu–S [2.120 (2.126) Å vs. 2.176/2.171 Å] bonds. The Mo–S–Cu angle is more variable being 115.9–134.3° for the models and 113/122° for the enzymes (by crystallography). The major difference between the models and enzyme related to the very different conformations of the MoO(μ-S)Cu unit and the relative position of the Cu and Mo centres; these conformational differences are reflected in disparate torsion angles within the (O)–Mo–S–Cu fragments, i.e., OMo–S–Cu [40.3 (21.1)° vs. 123.8/121.1°] and O–Mo–S–Cu [63.7 (82.6)° vs. 13.7/14.1°]. Interestingly, the Mo⋯Cu distances in the models [3.951 (3.752) Å] still lie close to (in fact just between) those of the oxidised and reduced forms of the enzyme (3.703 and 4.230 Å, respectively, by EXAFS). Steric factors (especially in the model complexes) and the influence of the protein (in positioning Cys388) are likely to be major factors determining the different OMo(μ-S)Cu conformations. Indeed, it is likely that the enzyme has evolved an optimal active site structure, one facilitating efficient substrate turnover and facile oxidative regeneration of the active site, through the protein induced positioning and relative orientations of the MCD, MoO and Cys388 moieties.
EPR spectroscopy
The isotropic (solution) X-band EPR spectra of the complexes exhibit multi-line signals at giso ∼ 1.937. Each spectrum is composed of a number of overlapping EPR signals arising from the various possible Mo and Cu isotopologues/isotopomers (95,97Mo, I = 5/2, 25%; others, I = 0, 75%. 63,65Cu, I = 3/2, 100%); the spectrum of 5 is typical of group 1 and is shown in Fig. 9(a), along with a splitting diagram showing the origins of the various spectral components (at top). Parameters derived from spectral simulations are presented in Table 4. The major four-line signal is due to species containing zero-spin Mo nuclei and 63,65Cu, while the minor four-line signals (Mo satellites) are produced by species containing 95,97Mo in combination with 63,65Cu. The giso-values are below the free electron value of 2.0023 and are indicative of a d1 Mo(V)/Cu(I) system rather than a d9 Mo(IV)/Cu(II) system.62,63 Heterobimetallic Mo/Cu systems containing Cu(II)-based paramagnets, such as [(NH3)2CuII]2[MoIV(CN)8]64 and [MoIV(CN)2(CN-CuIIL)6]8+ [L = tris(2-aminoethyl)amine],65 exhibit g-values in the range 2.12–2.20. The g-values are higher than those typical of [CoCp2][TpiPrMoOS(OAr)] compounds39 due to a reduction in the ligand field strength of the sulfido ligand upon binding to Cu, which in turn reduces the spin–orbit deviations of g1–3 from ge. The observation of hyperfine coupling to 95,97Mo (a ∼ 40 × 10−4 cm−1) further supports the assignment of the signals to Mo(V); the aMo values are smaller than those of [CoCp2][TpiPrMoOS(OAr)], consistent with the increase in g-value66 and delocalization of electron density across the Mo–S–Cu unit. The Mo hyperfine coupling constants are also typical of oxo-Mo(V) species bearing soft-donor co-ligands.38 The significant spin–orbit coupling in this system also excludes the presence of an organic or sulfur-based radical.62 | ||
| Fig. 9 (a) Isotropic EPR spectrum of 5 and spectral simulation, showing (above in green) the origins of the component signals. (b) Isotropic EPR spectrum of 2 and spectral simulation showing the effect of the smaller coupling to 63,65Cu. The splitting diagram for this spectrum is the same as that shown for (a) but with smaller splittings due to reduced 63,65Cu coupling. | ||
| Cmpd | g iso | a(95,97Mo) | a(63,65Cu) | g 1 | g 2 | g 3 | 〈g〉 |
|---|---|---|---|---|---|---|---|
| a Isotropic coupling constants in units of 10−4 cm−1. b Anisotropic parameters could not be reliably derived from X-band spectra (see text). | |||||||
| 1 | 1.937 | 40.5 | 56.6 | 1.995 | 1.948 | 1.880 | 1.941 |
| 2 | 1.937 | 38.8 | 34.3 | — | — | — | — |
| 3 | 1.936 | 39.1 | 57.9 | 1.995 | 1.943 | 1.882 | 1.940 |
| 4 | 1.936 | 40.3 | 59.0 | 1.997 | 1.947 | 1.880 | 1.941 |
| 5 | 1.937 | 41.3 | 55.0 | 1.998 | 1.943 | 1.886 | 1.942 |
| 6 | 1.937 | 41.0 | 62.5 | 1.996 | 1.941 | 1.880 | 1.939 |
| 7 | 1.937 | 39.7 | 57.6 | — | — | — | — |
The most notable feature of the EPR spectra is the remarkably large coupling of the unpaired d1 Mo(V) electron to the neighboring 63,65Cu(I) nucleus. Indeed, the aCu values of most complexes are similar in magnitude to those observed for mononuclear, tetrahedral Cu(II) complexes, where the unpaired electron is localized on the Cu centre.62 For example, blue copper proteins display 63,65Cu hyperfine of comparable magnitude (A∥ = 63 × 10−4 cm−1).67 Similar values are exhibited by partially and fully delocalized mixed-valence Cu(I)Cu(II) complexes.68,69 Here, the large aCu values are indicative of extensive delocalization of the d1 Mo(V) electron across the Mo(μ-S)Cu unit. However, there is a difference in the aCu values exhibited by structurally unique 2 (34.3 × 10⁻⁴ cm−1) [Fig. 9(b)] and members of group 1 (55–63 × 10−4 cm−1) [cf.Fig. 9(a)]. The reduced aCu for 2 is indicative of reduced delocalization of the unpaired electron across the Mo(μ-S)Cu unit due to a reduction in the pseudo-σ* interaction between Cu and S in this structurally unique complex (vide supra). In situ generated TpiPrMoO(OC6H4Ph-2)(μ-S)Cu(Me3tcn) also has a relatively low aCu = 45.0 × 10⁻⁴ cm−1 suggesting that other bulky 2-substituents can induce conformations that reduce electronic delocalization. The broader implication of these observations is that geometry significantly impacts on the bonding and degree of electronic communication in the MoO(μ-S)Cu moiety. These observations suggest that a specific MoO(μ-S)Cu geometry, one that is optimized for electron transfer and biological function, is enforced by the highly evolved sulfur-donor Cys388 and active site protein pocket of CODH.
The anisotropic (frozen-glass) X-band EPR spectra of the complexes generally exhibit ‘six-line’ spectra having apparent ‘peak intensities’ of 1:2:3:3:2:1; the spectrum of 5 is exemplary and is shown in Fig. 10. These spectra are very similar to a number reported for CODH (cf.Fig. 2 and 10), differences in the g- and A-values and additional superhyperfine couplings in the enzyme accounting for the differences observed. The almost uniform separation of the peaks is attributed to nearly isotropic coupling to 63,65Cu (vide infra), however, features allowing the determination of 95,97Mo hyperfine couplings were not readily discernable. In our hands, the frozen-glass, X-band EPR spectra of 2 and 7 were broad and unresolved, possibly on account of lower g anisotropy and 63,65Cu couplings (for 2) and/or poor glass formation with MeCN; these spectra could not be reliably simulated and will not be discussed further. Some broadening of the spectra of 1 and 6 was observed (due to sub-optimal glass formation) but the spectra were amenable to simulation (see Table 4).
 | ||
| Fig. 10 Frozen-glass EPR spectrum of 5 and spectral simulation, showing (above in green) the origins of the principal component signals. | ||
The complexes exhibit anisotropic g values, with g1 ∼ 1.997, g2 ∼ 1.946 and g3 ∼ 1.883, and with Δg ca. 0.114. The g1–3 values for dithionite reduced CODH are 2.002, 1.9618 and 1.9548, respectively, with 〈g〉 = 1.9729;15 the higher g-values may be ascribed to the presence of soft S-donor ligands in the enzyme and/or structural differences in the enzyme and models. The A1–3(Cu) values are all roughly similar in each case, with 〈ACu〉 values around 75–90 × 10−4 cm−1. The differences between 〈ACu〉 and aCu may be attributed to the rotational freedom of the Mo–S–Cu moiety, the isotropic spectra sampling a greater range of conformers than the low-temperature glass, where the lowest energy conformer is most likely favored. Similar rotational influences have been invoked to explain differences in the solution and low temperature EPR spectra of other complexes, e.g., (L3S)MoO(SePh)2 [L3S = 2-(dimethylethanethiol)bis(3,5-dimethylpyrazolyl)methane].70 The ACu-values for 2 could not be reliably estimated from X-band spectra but Q-band spectra suggest 〈ACu〉 ∼ 31 × 10−4 cm−1 for this complex.71 The A1–3(Cu) values for dithionite reduced CODH are also nearly isotropic with 〈ACu〉 ∼ 67 × 10−4 cm−1, in the range recorded for the title complexes.15
The large isotropic contribution to the 63,65Cu superhyperfine tensor is indicative of a significant Fermi contact term originating from Cu s-orbital character in the SOMO wavefunction. This indicates that the dz2 orbital on Cu is the dominant Cu d-orbital contributor to the SOMO as this orbital is of the appropriate symmetry to mix with the Cu s orbital under pseudo-C3v (title complexes) or linear C∞v (CODH) environments. The d–s orbital mixing is supported by bonding calculations performed on [(NH3)3MoO(OPh)(μ-S)Cu(tcn)]+ (tcn = 1,4,7-triazacyclononane),13 that show extensive delocalization of the SOMO over the Mo (Mo dxy, 44%) and S (S p, 25%) and onto the Cu site (21%, primarily Cu dxz and dz2 with ca. 2% Cu s character) via a pseudo-σ* Cu–S orbital interaction (Fig. 11). The substantial superhyperfine coupling of Mo(V) to Cu(I) in the title complexes and CODH, despite the significant structural differences and the geometry dependence of the coupling (cf.2 and group 1 complexes) suggests the presence of intrinsically effective Fermi coupling when the symmetry at Cu(I) allows d-s orbital mixing. Nevertheless, a significant reduction in the Cu s-orbital character of the SOMO of 2 is likely to be a major contributor to the smaller 63,65Cu coupling observed for this complex. Extensive delocalization of the SOMO over the Mo(μ-S)Cu unit of CODH is proposed to provide a conduit for electrons to reduce Mo upon substrate oxidation at Cu, without Csubstrate–Ssulfido bond formation during the course of catalysis.13,21 To the extent that electron delocalization in the catalytically competent Mo(VI)–S–Cu(I) oxidation state contributes significantly to the rate of the reductive half reaction, CO oxidation could occur directly at the Cu(I) site with two electron transfer to Mo occurring via a highly efficient super-exchange pathway mediated by the bridging sulfido ligand.13,21
 | ||
| Fig. 11 Two views of the SOMO wavefunction calculated for the computational model [(NH3)3MoO(OPh)(μ-S)Cu(tcn)]+ showing relevant Mo–S π* and S–Cu pseudo-σ* interactions (isosurface drawn at ± 0.05 a.u.). Reproduced with permission from ref. 13 (Copyright: American Chemical Society). | ||
The compounds have also been studied by Q-band EPR, visible, magnetic circular dichroism and S K-edge X-ray absorption spectroscopic techniques and advanced theoretical and computational methods in collaboration with Profs. Martin L. Kirk and Graham N. George. These results will be published in forthcoming papers.
Cyanolysis studies
The deactivation of CODH by cyanide releases ‘concomitantly’ up to 1 mol equivalent of thiocyanate (SCN−) and 1 mol equivalent of Cu per active site, i.e., 2 equivalents of each per (αβγ)2 enzyme.10 Structural studies of the deactivated enzyme reveal the presence of a ‘trioxo-based’ [(MCD)MoO2(OH)] or [(MCD)MoO(OH)2] active site, which is consistent with the observation of a Mo(V) EPR signal (g1–3 = 1.977, 1.967 and 1.953, respectively) resembling that of ‘desulfo-inhibited’ XnO upon reduction.10 The deactivated enzyme can be partially reactivated by sequential reaction with sulfide and dithionite followed by Cu(I), with return of the original 4-line EPR signal and the generation of ‘immature’ as well as ‘mature’ enzyme.72Cyanolysis of the title complexes has been probed using a combination of EPR spectroscopy and mass spectrometry, with two sequential reactions being identified upon reaction with KCN or NEt4CN. The first of these reactions was the cleavage of the MoS–Cu bond resulting in the formation of [TpiPrMoOS(OAr)]− (e.g., product from 5: giso = 1.925 and m/z = 888.6) and Cu(CN)(Me3tcn) (m/z = 261.9); the reaction is represented by eqn (2). The oxosulfido anions are characterized by distinctive EPR signals, with broad solution and anisotropic frozen-glass EPR signals quite different to those of dioxo-Mo(V) and oxo-Mo(V) species.39
| TpiPrMoO(OAr)(μ-S)Cu(Me3tcn) + CN− → [TpiPrMoOS(OAr)]− + Cu(CN)(Me3tcn) | (2) |
The addition (or presence) of a second equivalent of cyanide results in the removal of the terminal sulfido ligand of [TpiPrMoOS(OAr)]− as thiocyanate (detected using Sörbo's reagent45) with solvent- and condition-dependent decomposition of the resultant Mo complex as described elsewhere.39 Because of downstream decomposition it was not feasible to demonstrate ‘reconstitution’ reactions, although these are implicit in the known reaction chemistry to TpiPr complexes, i.e., the conversion of TpiPrMoO2(OAr) into [TpiPrMoOS(OAr)]− upon reduction/sulfurization with NBun4SH37 and subsequent conversion into the title complexes upon reaction with [Cu(NCMe)(Me3tcn)]BF4. Finally, while oxosulfido-Mo(V) EPR signals were not observed in the cyanolysis reactions of CODH (for sample production and monitoring reasons), it is very likely that the reaction is a two-step process of the type described here for the title complexes.
Conclusions
This paper describes full details of the synthesis and spectroscopic (IR and X-band EPR) and structural characterization of complexes possessing the paramagnetic MoVO(μ-S)CuI core found in semi-reduced forms of aerobic CODH. The highly air-sensitive and thermally unstable complexes are unprecedented in Mo/Cu chemistry in containing only a single μ-sulfido bridge between Mo and Cu centres. Significantly, the complexes display X-band EPR properties closely related to those of several forms of semi-reduced CODH. Solution spectra are dominated by a distinctive 4-line Mo(V) signal produced by superhyperfine coupling to 63.65Cu (aiso = 34–63 × 10−4 cm−1), with satellite peaks due to 95,97Mo hyperfine coupling (aiso = 39–42 × 10−4 cm−1). The frozen-glass EPR spectra are interpreted in terms of a monoclinic symmetry, with g1 ∼ 1.997, g2 ∼ 1.946 and g3 ∼ 1.883, and nearly isotropic 〈ACu〉 values in the range 75–90 × 10−4 cm−1. Similar patterns of g and A values are exhibited by the enzyme, with differences between the models and enzymes being attributable to donor atom and geometrical effects. The results reported inform the interpretation of enzyme EPR spectra and provide insights into the electronic structure and orbital control of the mechanism of the enzyme. Additional insights into the electronic structures of the complexes (and by inference, enzymes) have been obtained using advanced spectroscopic, theoretical and computational techniques (vide supra); the results of these studies will appear in forthcoming publications. Cyanolysis of the complexes proceeds by successive decupration and desulfurization steps and a similar two-stage process is proposed for the cyanolytic deactivation of the enzymes.Conflicts of interest
The authors declare no competing financial interest.Acknowledgements
We thank Ms Sioe See Volaric for mass spectrometric results, Dr Stephen P. Best for invaluable assistance with the EPR studies and Profs Martin L. Kirk (University of New Mexico) and Graham N. George (University of Saskatchewan) for sharing unpublished results and insights. We gratefully acknowledge the financial support of the Australian Research Council, the donors of the Petroleum Research Fund (administered by the American Chemical Society) and the Albert Shimmins Writing Up Award (to CG).References
- S. W. Ragsdale, Crit. Rev. Biochem. Mol. Biol., 2004, 39, 165–195 CrossRef CAS PubMed.
- S. W. Ragsdale, Ann. N. Y. Acad. Sci., 2008, 1125, 129–136 CrossRef CAS PubMed.
- A. M. Appel, J. E. Bercaw, A. B. Bocarsly, H. Dobbek, D. L. DuBois, M. Dupuis, J. G. Ferry, E. Fujita, R. Hille, P. J. A. Kenis, C. A. Kerfeld, R. H. Morris, C. H. F. Peden, A. R. Portis, S. W. Ragsdale, T. B. Rauchfuss, J. N. H. Reek, L. C. Seefeldt, R. K. Thauer and G. L. Waldrop, Chem. Rev., 2013, 113, 6621–6658 CrossRef CAS PubMed.
- J.-H. Jeoung, J. Fesseler, S. Goetzl and H. Dobbek, Met. Ions Life Sci., 2014, 14, 37–69 CAS.
- Y. Kung and C. L. Drennan, Curr. Opin. Chem. Biol., 2011, 15, 276–283 CrossRef CAS PubMed.
- M. Can, F. A. Armstrong and S. W. Ragsdale, Chem. Rev., 2014, 114, 4149–4174 CrossRef CAS PubMed.
- R. Hille, J. Hall and P. Basu, Chem. Rev., 2014, 114, 3963–4038 CrossRef CAS PubMed.
- R. Hille, S. Dingwall and J. Wilcoxen, J. Biol. Inorg Chem., 2015, 20, 243–251 CrossRef CAS PubMed.
- D. Rokhsana, T. A. G. Large, M. C. Dienst, M. Retegan and F. Neese, J. Biol. Inorg Chem., 2016, 21, 491–499 CrossRef CAS PubMed.
- H. Dobbek, L. Gremer, R. Kiefersauer, R. Huber and O. Meyer, Proc. Natl. Acad. Sci. U. S. A., 2002, 99, 15971–15976 CrossRef CAS PubMed.
- R. Hille, in Metals in Biology: Applications of High-Resolution EPR to Metalloenzymes (Biological Magnetic Resonance), ed. G. R. Hanson and L. J. Berliner, Springer, New York, 2010, vol. 29, pp. 91–120 Search PubMed.
- O. Meyer, L. Gremer, R. Ferner, M. Ferner, H. Dobbek, M. Gnida, W. Meyer-Klaucke and R. Huber, Biol. Chem., 2000, 381, 865–876 CrossRef CAS PubMed.
- C. Gourlay, D. J. Nielsen, J. M. White, S. Z. Knottenbelt, M. L. Kirk and C. G. Young, J. Am. Chem. Soc., 2006, 128, 2164–2165 CrossRef CAS PubMed.
- A. M. Pelzmann, F. Mickoleit and O. Meyer, J. Biol. Inorg Chem., 2014, 19, 1399–1414 CrossRef CAS PubMed.
- J. Wilcoxen and R. Hille, J. Biol. Chem., 2013, 288, 36052–36060 CrossRef CAS PubMed.
- B. Zhang, C. F. Hemann and R. Hille, J. Biol. Chem., 2010, 285, 12571–12578 CrossRef CAS PubMed.
- J. Wilcoxen, S. Snider and R. Hille, J. Am. Chem. Soc., 2011, 133, 12934–12936 CrossRef CAS PubMed.
- M. Shanmugam, J. Wilcoxen, D. Habel-Rodriguez, G. E. Cutsail III, M. L. Kirk, B. M. Hoffman and R. Hille, J. Am. Chem. Soc., 2013, 135, 17775–17782 CrossRef CAS PubMed.
- M. Hofmann, J. K. Kassube and T. Graf, J. Biol. Inorg Chem., 2005, 10, 490–495 CrossRef CAS PubMed.
- P. E. M. Siegbahn and A. F. Shestakov, J. Comput. Chem., 2005, 26, 888–898 CrossRef CAS PubMed.
- B. W. Stein and M. L. Kirk, Chem. Commun., 2014, 50, 1104–1106 RSC.
- S. H. Laurie, Eur. J. Inorg. Chem., 2000, 2443–2450 CrossRef CAS.
- C. Rodríguez-Flores, M. Preciado-Puga, W. Wrobel, M. E. Garay-Sevilla and K. Wrobel, Diabetes Res. Clin. Pract., 2011, 91, 333–341 CrossRef PubMed.
- G. N. George, I. J. Pickering, E. Y. Yu, R. C. Prince, S. A. Bursakov, O. Y. Gavel, I. Moura and J. J. G. Moura, J. Am. Chem. Soc., 2000, 122, 8321–8322 CrossRef CAS.
- M. S. P. Carepo, S. R. Pauleta, A. G. Wedd, J. J. G. Moura and I. Moura, J. Biol. Inorg Chem., 2014, 19, 605–614 CrossRef CAS PubMed.
- C. G. Young, in Molybdenum and Tungsten Enzymes: Bioinorganic Chemistry, RSC Metallobiology Series, No. 6, ed. R. Hille, C. E. Schulzke and M. L. Kirk, Royal Society of Chemistry, Cambridge, UK, 2017, ch. 7, pp. 194–238 Search PubMed.
- Z.-H. Wei, C.-Y. Ni, H.-X. Li, Z.-G. Ren, Z.-R. Sun and J. P. Lang, Chem. Commun., 2013, 49, 4836–4838 RSC.
- Z.-Y. Zhang, W.-J. Gong, F. Wang, M.-M. Chen, L.-K. Zhou, Z.-G. Ren, Z. R. Sun and J.-P. Lang, Dalton Trans., 2013, 42, 9495–9504 RSC.
- A. Müller, Polyhedron, 1986, 5, 323–340 CrossRef.
- C. D. Garner, in Comprehensive Coordination Chemistry, ed. G. Wilkinson, R. D. Gillard and J. A. McCleverty, Pergamon, Oxford, 1987, vol. 3, ch. 36.6, pp. 1421–1444 Search PubMed.
- H.-W. Hou, X.-Q. Xin and S. Shi, Coord. Chem. Rev., 1996, 153, 25–56 CrossRef CAS.
- J.-P. Lang, S.-J. Ji, Q.-F. Xu, Q. Shen and K. Tatsumi, Coord. Chem. Rev., 2003, 241, 47–60 CrossRef CAS.
- L. Chen and X.-T. Wu, in Inorganic Chemistry in Focus II, ed. G. Meyer, D. Naumann and L. Wesemann, Wiley-VCH, Weinheim, 2005, pp. 207–219 Search PubMed.
- J.-P. Lang, W.-H. Zhang, H.-X. Li and Z.-G. Ren, in Design and Construction of Coordination Polymers, ed. M.-C. Hong and L. Chen, Wiley, Hoboken, NJ, 2009, pp. 267–306 Search PubMed.
- M. Takuma, Y. Ohki and K. Tatsumi, Inorg. Chem., 2005, 44, 6034–6043 CrossRef CAS PubMed.
- S. Groysman, A. Majumdar, S.-L. Zheng and R. H. Holm, Inorg. Chem., 2010, 49, 1082–1089 CrossRef CAS PubMed.
- C. G. Young, Eur. J. Inorg. Chem., 2016, 2357–2376 CrossRef CAS.
- C. G. Young, J. Inorg. Biochem., 2016, 162, 238–252 CrossRef CAS PubMed.
- C. J. Doonan, C. Gourlay, D. J. Nielsen, V. W. L. Ng, P. D. Smith, D. J. Evans, G. N. George, J. M. White and C. G. Young, Inorg. Chem., 2015, 54, 6386–6396 CrossRef CAS PubMed.
- K. Wieghardt, P. Chaudhuri, B. Nuber and J. Weiss, Inorg. Chem., 1982, 21, 3086–3090 CrossRef CAS.
- A. Hetherington, W. Levason and M. D. Spicer, Polyhedron, 1990, 9, 1609–1612 CrossRef.
- P. Chaudhuri and K. Oder, J. Organomet. Chem., 1989, 367, 249–258 CrossRef CAS.
- S. Stoll and A. Schweiger, J. Magn. Reson., 2006, 178, 42–55 CrossRef CAS PubMed.
- N. G. Connelly and W. E. Geiger, Chem. Rev., 1996, 96, 877–910 CrossRef CAS PubMed.
- B. Sörbo, Biochim. Biophys. Acta, 1957, 24, 324–329 CrossRef.
- SMART, SAINT and SADABS Software Programs, Siemens Analytical X-ray Instruments Inc., Madison, Wisconsin, USA, 1999 Search PubMed.
- G. M. Sheldrick, Acta Crystallogr., Sect. C: Struct. Chem., 2015, 71, 3–87 CrossRef PubMed.
- C. F. Macrae, P. R. Edgington, P. McCabe, E. Pidcock, G. P. Shields, R. Taylor, M. Towler and J. van de Streek, J. Appl. Crystallogr., 2006, 39, 453–457 CrossRef CAS.
- CAChe - Computer-Aided Chemistry Modeling Software, CAChe Research, Oregonhttp://cacheresearch.com/ Search PubMed.
- C. Gourlay, M. K. Taylor, P. D. Smith and C. G. Young, Inorg. Chim. Acta, 2010, 363, 1126–1132 CrossRef CAS.
- C. J. Doonan, D. J. Nielsen, P. D. Smith, J. W. White, G. N. George and C. G. Young, J. Am. Chem. Soc., 2006, 128, 305–316 CrossRef CAS PubMed.
- S. R. Acott, C. D. Garner, J. R. Nicholson and W. Clegg, J. Chem. Soc., Dalton Trans., 1983, 713–719 RSC.
- E. R. Brown and R. F. Large, in Physical Methods of Chemistry. Part IIA. Electrochemical Methods, ed. A. Weissberger and B. W. Rossiter, Wiley–Interscience, 1971, pp. 423–530 Search PubMed.
- C. Hansch, A. Leo and R. W. Taft, Chem. Rev., 1991, 91, 165–195 CrossRef CAS.
- C. J. Doonan, A. J. Millar, D. J. Nielsen and C. G. Young, Inorg. Chem., 2005, 44, 4506–4514 CrossRef CAS PubMed.
- B. M. T. Lam, J. A. Halfen, V. G. Young Jr, J. R. Hagadorn, P. L. Holland, A. Lledós, L. Cucurull-Sánchez, J. J. Novoa, S. Alvarez and W. B. Tolman, Inorg. Chem., 2000, 39, 4059–4072 CrossRef CAS PubMed.
- A. Thangavel, M. Wieliczko, J. Bacsa and C. C. Scarborough, Inorg. Chem., 2013, 52, 13282–13287 CrossRef CAS PubMed.
- L. M. R. Hill, M. K. Taylor, V. W. L. Ng and C. G. Young, Inorg. Chem., 2008, 47, 1044–1052 CrossRef CAS PubMed.
- V. W. L. Ng, M. K. Taylor, J. M. White and C. G. Young, Inorg. Chem., 2010, 49, 9460–9469 CrossRef CAS PubMed.
- P. D. Smith, D. A. Slizys, G. N. George and C. G. Young, J. Am. Chem. Soc., 2000, 122, 2946–2947 CrossRef CAS.
- M. Gnida, R. Ferner, L. Gremer, O. Meyer and W. Meyer-Klaucke, Biochemistry, 2003, 42, 222–230 CrossRef CAS PubMed.
- F. E. Mabbs and D. Collison, Electron Paramagnetic Resonance of d Transition Metal Compounds, Elsevier, Amsterdam, 1992 Search PubMed.
- G. Palmer, in Physical Methods in Bioinorganic Chemistry: Spectroscopy and Magnetism, ed. L. Que Jr, University Science Books, Sausalito, CA, 2000, p. 121 Search PubMed.
- T. Hozumi, T. Nuida, K. Hashimoto and S. Ohkoshi, Cryst. Growth Des., 2006, 6, 1736–1737 CAS.
- J. M. Herrera, V. Marvaud, M. Verdaguer, J. Marrot, M. Kalisz and C. Mathoniére, Angew. Chem., Int. Ed., 2004, 43, 5468–5472 CrossRef CAS PubMed.
- B. A. Goodman and J. B. Raynor, Adv. Inorg. Chem. Radiochem., 1970, 13, 135–362 CrossRef CAS.
- E. I. Solomon, M. J. Baldwin and M. D. Lowery, Chem. Rev., 1992, 92, 521–542 CrossRef CAS.
- R. R. Gagne, C. A. Koval, T. J. Smith and M. C. Cimolino, J. Am. Chem. Soc., 1979, 101, 4571–4580 CrossRef CAS.
- L. Yang, D. R. Powell, E. L. Klein, A. Grohmann and R. P. Houser, Inorg. Chem., 2007, 46, 6831–6833 CrossRef CAS PubMed.
- K. Peariso, B. S. Chohan, C. J. Carrano and M. L. Kirk, Inorg. Chem., 2003, 42, 6194–6203 CrossRef CAS PubMed.
- M. L. Kirk, personal communication of unpublished results.
- M. Resch, H. Dobbek and O. Meyer, J. Biol. Inorg Chem., 2005, 10, 518–528 CrossRef CAS PubMed.
Footnotes |
| † Electronic supplementary information (ESI) available: Synthetic yields and microanalytical, mass spectrometric and IR spectroscopic data for all new compounds. CCDC 1576257–1576260. For ESI and crystallographic data in CIF or other electronic format see DOI: 10.1039/c7sc04239f |
| ‡ Deceased: 12 July, 2012. |
| This journal is © The Royal Society of Chemistry 2018 |