 Open Access Article
Target-activated streptavidin–biotin controlled binding probe†
Yung-Peng
Wu‡
a,
Chee Ying
Chew‡
a,
Tian-Neng
Li
b,
Tzu-Hsuan
Chung
a,
En-Hao
Chang
a,
Chak Hin
Lam
a and
Kui-Thong
Tan
 *a
*a
aDepartment of Chemistry, National Tsing Hua University, 101 Sec. 2, Kuang Fu Rd, Hsinchu 30013, Taiwan, Republic of China. E-mail: kttan@mx.nthu.edu.tw
bInstitute of Molecular and Cellular Biology, Department of Life Science, National Tsing Hua University, 101 Sec. 2, Kuang Fu Rd, Hsinchu 30013, Taiwan, Republic of China
First published on 17th November 2017
Abstract
Target-activated chemical probes are important tools in basic biological research and medical diagnosis for monitoring enzyme activities and reactive small molecules. Based on the fluorescence turn-on mechanism, they can be divided into two classes: dye-based fluorescent probes and caged-luciferin. In this paper, we introduce a new type of chemical probe in which the fluorescence turn-on is based on controlled streptavidin–biotin binding. Compared to conventional probes, the streptavidin–biotin controlled binding probe has several advantages, such as minimal background at its “OFF” state, multiple signal amplification steps, and unlimited selection of the optimal dyes for detection. To expand the scope, a new synthetic method was developed, through which a wider range of analyte recognition groups can be easily introduced to construct the binding probe. This probe design was successfully applied to image and study secreted peroxynitrite (ONOO−) at the cell surface of macrophages where information on ONOO− is difficult to obtain. As the signals are generated upon the binding of streptavidin to the biotin probe, this highly versatile design can not only be used in fluorescence detection but can also be applied in various other detection modes, such as electrochemical and enzyme-amplified luminescence detection.
Introduction
Chemical probes are important tools in basic biological research and medical diagnosis because they allow for sensitive, simple, and specific detection of the target molecules in complex environments, such as cell lysates, living cells, and in vivo.1,2 Currently, most chemical probes are reaction-based and designed for monitoring enzyme activities and reactive small molecules using fluorescence detection technique.3–5 Based on the fluorescence turn-on mechanism, they can be divided into two classes: dye-based fluorescent probes and caged-luciferin. In the presence of a target molecule, the fluorophore of the fluorescent probe can be turned-on via FRET, PET, AIE, or the restoration of fluorophore π-conjugation,6–9 while the fluorescence turn on mechanism of caged-luciferin is based on the specific enzymatic reaction of luciferase with luciferin to emit yellow to green light.10Although undoubtedly valuable and widely described in the literature, these two chemical probe designs pose several limitations. The first limitation is the presence of intrinsic background fluorescence from the “fluorescence off” probe. Regardless of how efficiently the fluorescence of the dye molecule is suppressed before target activation, the fluorescent probe will always emit a very weak background fluorescence in its “OFF” state. As a result, the analytical sensitivity of the probe is reduced. The second limitation is that a reaction-based chemical probe only reacts with one reactive small molecule to produce a single fluorescence signal. This “one target to one signal” detection mode has limited the sensitivity of most fluorescent probes. Although chemical probes based on self-immolative polymers have been reported to achieve “one target to multiple signals” detection, this approach normally requires long synthetic steps to assemble multiple fluorophores into the chemical probe to achieve significant fluorescence amplification.11 The third limitation is that fluorescence detection is restricted by the type of fluorophore used to construct the fluorescent probe. For example, a fluorescent probe based on Cy5 dye can only be ideally detected by excitation light of around 640 nm. To date, a chemical probe that allows for the liberal choice of excitation and emission wavelengths for fluorescence detection has yet to be reported.
In this paper, we describe a general approach to overcome the three limitations of conventional chemical probes by developing a streptavidin–biotin controlled binding probe (CBP, Fig. 1). The rationale behind this new CBP concept is based on the fact that biotin has extremely high binding affinity (Kd = 10−14 M) with streptavidin, while chemical modification at the N′-1 urea nitrogen of biotin to form caged-biotin can dramatically reduce its streptavidin binding affinity (Kd ≈ 10−5 M).12 In the absence of the target analyte, the CBP on the cell surface would not be able to bind with fluorophore conjugated streptavidin due to the low binding affinity of caged-biotin with streptavidin. The fluorophore conjugated streptavidin can then be washed away to eliminate any background fluorescence. In the presence of the target analyte triggering biotin uncaging, the fluorophore conjugated streptavidin would bind to the biotin probe. As there are multiple fluorophore units on one streptavidin molecule, significant signal amplification can be achieved. Furthermore, streptavidin conjugated with different bright fluorophores, such as Cy5, Cy3 or Alexa488, can be added on demand to generate the desired fluorescence signals. Thus, detection is no longer restricted by the type of fluorescent dye, such as in the case of fluorescent probes. Since the fluorescence turn-on mechanism is different from the fluorescent probes and caged-luciferin, this novel CBP approach can be considered as a third type of chemical probe. This CBP approach would be very useful for the detection of a low concentration of reactive oxygen and nitrogen species (ROS/RNS), such as H2O2, ONOO−, and HOCl. Currently, ROS/RNS are mostly detected by fluorescent probes that react rapidly with the ROS/RNS to produce dramatic changes in the absorption and fluorescence signals.13–16
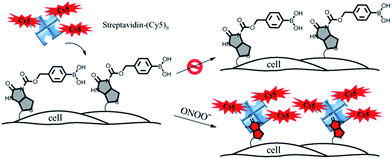 | ||
| Fig. 1 A schematic illustration of the membrane-anchored streptavidin–biotin controlled binding probe for the imaging of ONOO− at the cell surface. | ||
The CBP approach was applied to image and study local peroxynitrite (ONOO−) secreted from the plasma membrane of macrophages upon phorbol-12-myristate-13-acetate (PMA) stimulation.17,18 ONOO− is a RNS and plays multiple roles in biological processes. It may exert a contributory effect by participating in microorganism killing and nitrosylation signaling.19,20 It can also be deleterious due to its nitrosative damage to lipids, proteins, and DNA. Therefore, ONOO− is widely assumed to account for most of the cytotoxicity previously ascribed to NO and O2−. Although several fluorescent probes have been described previously for the detection of ONOO−, all of them either detect ONOO− in the bulk solution or in cytosol, but not ONOO− secretion along the plasma membrane.21–25 The difficulty in detecting local ONOO− immediately after its secretion from the extracellular surface can be attributed to two main reasons: the fast diffusion of ONOO− to the bulk solution and the limited sensitivity of the existing chemical probes to detect very low concentrations of ONOO− at the cell surface. We believe that the ability to detect and image local ONOO− along the extracellular surface of a single cell is biologically significant as the plasma membrane is where most of the ROS and RNS exert their functions for host defense and signal transductions.
In order to image membrane secreted ONOO− in the living cells, we constructed a cell-impermeable membrane-anchored streptavidin–biotin controlled binding probe, ONOO-CBP, which contains an ONOO− responsive boronic acid moiety and a sulfo-NHS ester moiety (Scheme 1). ONOO-CBP can be anchored onto the cell surface via the reaction of the sulfo-NHS moiety with the amine of the cell membrane proteins and the boronic acid group is hence well-placed to react with the secreted ONOO− to form phenol, which concomitantly triggers the cleavage of the carbamate group to activate the probe for binding with the streptavidin–fluorophore (Fig. S1†). While the boronate derivatives were first described to detect H2O2,26,27 it was determined recently that boronate reacts stoichiometrically and rapidly with ONOO− (k = 1.1 × 10⁶ M−1 s−1) in comparison to the slower reaction rate with H2O2 (k ∼ 1 M−1 s−1).23 Thus, the fast reaction between boronate and ONOO− should enable the membrane-anchored ONOO-CBP probe to capture the secreted ONOO− at the extracellular membrane before its degradation and/or diffusion into the bulk solution.
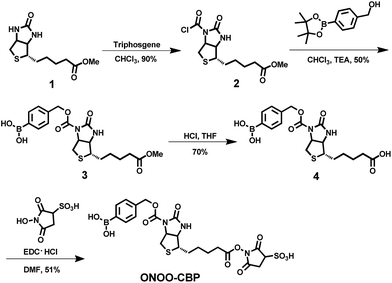 | ||
| Scheme 1 The synthesis of the cell-impermeable membrane-anchored streptavidin–biotin controlled binding probe, ONOO-CBP, for the detection of secreted ONOO− at the extracellular surface. | ||
Results and discussion
Synthesis of the peroxynitrite-responsive streptavidin–biotin controlled binding probe ONOO-CBP
Although it has been well known that chemical modification at the N′-1 urea nitrogen of biotin can dramatically reduce its binding affinity with streptavidin, all the caged-biotins previously reported were mainly applied to protein site-specific immobilization to retain the protein activities by photo- or electrochemical stimulation.12,28–30 To date, the caged-biotin approach has yet to be applied directly for analyte detection. The main reason is that caged-biotin with chemical modification at the N′-1 urea nitrogen is difficult to prepare due to the low reactivity of the N′-1 urea nitrogen. Therefore, only the highly reactive acyl chloride moiety can be used as an electrophile, which limits the types of chemical modification that can be introduced on the N′-1 urea nitrogen.In order to develop this CBP strategy as a general design, we developed a new synthetic method to prepare caged-biotin derivatives, through which a wider range of chemical modifications can be easily introduced on the N′-1 urea nitrogen of biotin (Scheme 1). The synthesis commences with the reaction of triphosgene with methyl ester biotin to form the important biotin derivative 2, which can then be reacted with different types of nucleophile to form the caged-biotin derivatives. It is important to note that compound 2 is stable enough to be purified by column chromatography, which greatly enhances its practicability. Following the acid hydrolysis of the methyl ester, compound 3 was reacted with sulfo-NHS under standard ester coupling conditions to generate the target product, ONOO-CBP. When stored in an acidic medium at −80 °C, ONOO-CBP was stable for at least two months without signs of degradation (Fig. S2†). This synthetic method is highly versatile as nucleophiles containing different analyte-responsive groups, such as nitro, TBDPS, and TPA, can be reacted with compound 2 to obtain different caged-biotin derivatives (Scheme S2†). Previously, these three moieties have been used for the detection of nitroreductase and fluoride and Cu(I) ions.31–33
Imaging of exogenous ONOO− and selectivity studies
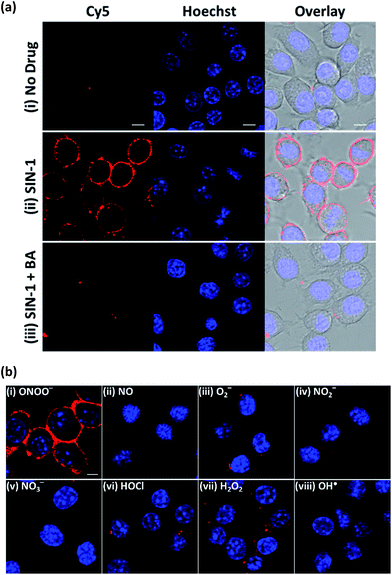
To establish the applicability of ONOO-CBP to image secreted ONOO− at the cell surface, we first employed 3-morpholinosydnonimine hydrochloride (SIN-1) as an external source of ONOO− to characterize ONOO-CBP.34,35 In a buffer or biological medium, SIN-1 can slowly release NO and O2−, which can then combine to form ONOO−. Using the existing method, we have determined that 100 μM SIN-1 can generate about 7% of ONOO− in one hour (Fig. S3†).36,37 We labeled the cell surface of the RAW264.7 macrophages with 10 μM ONOO-CBP in HBSS buffer for 30 minutes at 37 °C. The unreacted ONOO-CBP was removed by washing with the medium, followed by the treatment of 100 μM SIN-1 for 60 minutes at 37 °C to uncage the biotin probe. After the removal of excess SIN-1, streptavidin–Cy5 was added and incubated for 10 minutes. Fluorescent images were taken immediately after the excess unbound streptavidin–Cy5 was washed away. For the cells treated with SIN-1, strong fluorescence was only observed along the plasma membrane of the RAW264.7 cells, while minimal fluorescence was detected in the absence of SIN-1 (Fig. 2a and S4†). When SIN-1 was incubated with 250 μM 4-(hydroxymethyl)phenylboronic acid (BA) for 60 minutes, the fluorescence was reduced dramatically, indicating that the strong fluorescence observed on the cell surface is due to the specific reaction of ONOO− with the boronic acid moiety of ONOO-CBP (Fig. 2aiii). Notably, the fluorescence was barely detectable inside the cells, indicating the practicability of our CBP approach to image secreted ONOO− along the plasma membrane. This is because the large streptavidin–Cy5 cannot diffuse easily across the plasma membrane to cause nonspecific fluorescence inside the cells. Furthermore, the specific and bright fluorescence on the plasma membrane of the macrophages indicates that the immobilization of ONOO-CBP on the cell surface using NHS ester chemistry is an effective approach to generate high quality images. The cytotoxicity test using MTT assays indicates that the labeling of the extracellular surface with ONOO-CBP was not cytotoxic for the cells (Fig. S5†).To further evaluate the applicability of ONOO-CBP for imaging ONOO− on the extracellular membrane, we proceeded to perform several selectivity tests with other ROS and RNS. As shown in Fig. 2b, bright fluorescence was obtained only in the presence of SIN-1, while the treatment of the cells with H2O2, OH˙, O2−, NO, HOCl, NO2−, and NO3− gave either weak or no detectable fluorescence along the membrane (Fig. S6†).
To validate the controlled binding probe concept in vitro, we have also synthesized a fluorogenic caged biotin probe ONOO-SBD, which can be activated by ONOO− for binding with avidin (a streptavidin derivative with equal biotin affinity) to generate strong fluorescence (Fig. S7 and Scheme S3†).31ONOO-SBD consists of an environment-sensitive dye, SBD, linked with compound 4. In the absence of ONOO− or avidin, the probe shows a weak fluorescence signal. Whereas, in the presence of ONOO−, the caged-biotin moiety of the probe can be activated for binding with avidin to produce strong fluorescence. Similar to the imaging results obtained using ONOO-CBP, the fluorogenic ONOO-SBD probe responded selectively to ONOO− and the fluorescence increased over time (Fig. S8†).
The streptavidin–biotin controlled binding probe enables fluorescence imaging with diverse excitation and emission light
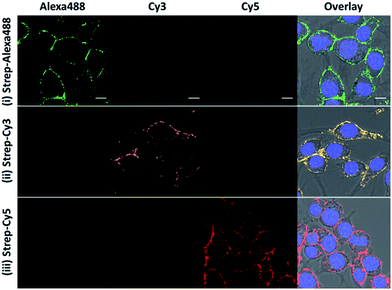
Besides the high selectivity, there are two additional advantages of this CBP approach for ONOO− imaging. First, there is no restriction on the fluorescent dye to be used for generating the fluorescent image so long as the dye can be conjugated to streptavidin. In our study, we demonstrated that bright fluorescence can also be generated with streptavidin–Cy3 and streptavidin–Alexa488 (Fig. 3). This feature allows for the use of many previously untapped bright near-infrared dyes for detection. The second advantage is that our CBP approach can achieve further signal amplification due to the fact that one streptavidin contains four biotin binding sites. To illustrate the signal amplification, a cell-impermeable Cy5–biotin was added to the cells that were already stained with streptavidin–Cy3 and streptavidin–Alexa488. After removing the unbound Cy5–biotin, we can observe clear fluorescence along the plasma membrane from the Cy5 channel (Fig. S9†). These two advantages demonstrate the high versatility and promising potential of CBP to detect low concentrations of the ROS and RNS.Imaging secreted peroxynitrite under PMA stimulation
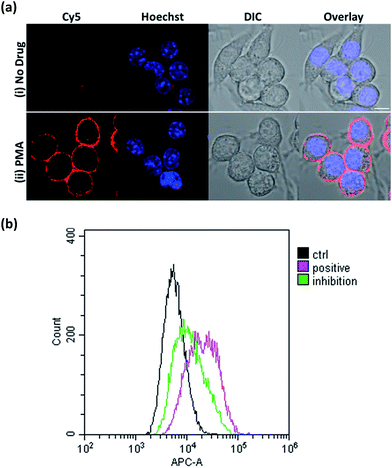
Next, we focused on assessing the performance of ONOO-CBP in imaging endogenously secreted ONOO− in the RAW264.7 cells, using phorbol-12-myristate-13-acetate (PMA) to stimulate the production of ONOO−. PMA activates phosphokinase C (PKC) to phosphorylate and translocates the NADPH oxidase subunits to the plasma membrane. Upon the assembly of the NADPH oxidase subunits, the membrane-bound NADPH oxidase can produce O2−, which can then react with secreted NO to form ONOO− at diffusion-controlled rates (k ∼ 1 × 10¹⁰ M−1 s−1).38–40To image ONOO− along the plasma membrane immediately after its secretion, ONOO-CBP labeled RAW264.7 macrophages were treated with 1 μg mL−1 PMA in DMEM medium for 60 minutes at 37 °C. After staining with streptavidin–Cy5, we observed distinct fluorescence along the extracellular surface of the RAW264.7 cells (Fig. 4a). In the presence of PMA, our membrane-anchored ONOO-CBP probe was able to detect that more than 95% of the RAW264.7 cells released ONOO− (Fig. S10†). On the other hand, no fluorescence was detected in the absence of PMA stimulation. To further demonstrate the quantitative application for detecting secreted ONOO− in live cells, fluorescence-activated cell sorting (FACS) cytometry was used for the analysis of the RAW264.7 cell population in the absence or presence of PMA. As shown in Fig. 4b, robust streptavidin–Cy5 labeling was observed for the cells treated with PMA, which can be reduced in the presence of superoxide dismutase (SOD) by quenching O2−, and this is required in the reaction with NO to form ONOO−. In the absence of PMA, the cells were hardly labeled by streptavidin–Cy5 and showed weaker fluorescence signals. These results showed that membrane-anchored ONOO-CBP based on the CBP approach can convincingly detect secreted ONOO− along the extracellular membrane both at the single cell level and from a population of cells.
The validation of secreted peroxynitrite with various NO, O2− and ONOO− inhibitors
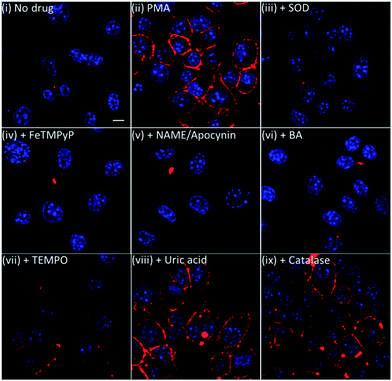
To further validate our membrane-anchored ONOO-CBP probe, we examined the fluorescence response of ONOO-CBP in the presence of various NO, O2− and ONOO− inhibitors during PMA stimulation. In these experiments, we used 15 μg mL−1 superoxide dismustase (SOD) and 1 mM 4-hydroxy-TEMPO (TEMPO) to quench O2−, 1 mM Nω-nitro-L-arginine methyl ester (L-NAME) to suppress NO production by inhibiting NO synthase activity,41 1 mM apocynin to inhibit NADPH oxidase,42,43 1 mM FeTMPyP, 5 mM uric acid and 250 μM 4-(hydroxymethyl)phenylboronic acid (BA) to quench ONOO− and 10 μg mL−1 catalase separately to show that ONOO-CBP would selectively detect ONOO− and not H2O2 during PMA stimulation.In the presence of SOD, FeTMPyP, L-NAME/apocynin mixture, and BA, we observed minimal fluorescence, similar to the control experiment without PMA treatment (Fig. 5 and S11†). In the presence of TEMPO, weak fluorescence was observed on the cell surface, indicating the partial inhibition of O2− to form ONOO−. On the other hand, brighter fluorescence was observed both for the cells treated with uric acid and with catalase. The inability of TEMPO and uric acid to completely quench the endogenous O2− and ONOO− can be attributed to the slower reaction rate of ONOO− with uric acid (k = 155 M−1 s−1) and O2− with TEMPO (2.5 × 10⁵ M−1 s−1).44,45 It was reported that FeTMPyP and boronic acid can react with ONOO− with very fast reaction rates of 2.2 × 10⁶ M−1 s−1 and 1.1 × 10⁶ M−1 s−1, respectively.46,47 Furthermore, the reaction rate of O2− with SOD is diffusion-limited with a rate of 7 × 10⁹ M−1 s−1.48 From these kinetic data, we believe that there is a rapid reaction between O2− and NO to form ONOO−, which can then react instantly with the membrane-anchored ONOO-CBP and lead to the failure of uric acid and TEMPO to completely deplete the ONOO− and O2− precursors. Overall, the results from the inhibitor studies and catalase addition confirmed that the membrane-anchored ONOO-CBP probe can accurately image ONOO− secretion on the extracellular surface upon PMA stimulation of the RAW264.7 macrophages.
The initiation and duration of the peroxynitrite burst in RAW264.7 cells under PMA stimulation
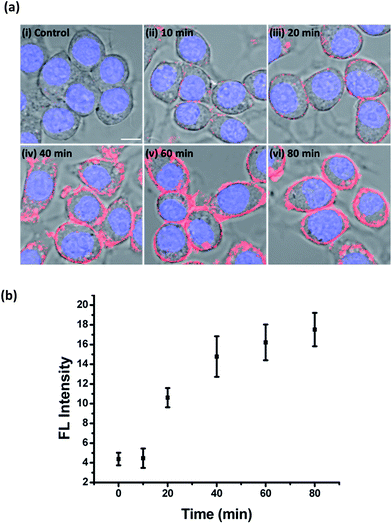
Currently, most analytical methods are developed for the detection of ONOO− in bulk solutions. Although several microelectrode methods have been reported to be able to determine ONOO− secretion in the vicinity of the plasma membrane, the lack of high spatial resolution and being limited to studying just a few cells in each experiment have severely restricted their real application.49,50 To date, obtaining accurate information about the time course of ONOO− release at the plasma membrane remains a very challenging task. In this regard, we believe that our membrane-anchored ONOO-CBP probe would not only be able to image ONOO− secretion in living cells, but also in more precise spatiotemporal resolution.To gain insights into the initiation and duration of ONOO− secretion upon PMA stimulation, ONOO-CBP labeled RAW264.7 cells were incubated with 1 μg mL−1 PMA for 10, 20, 40, 60 and 80 minutes. The imaging results showed time-dependent fluorescence enhancement along the plasma membrane and distinct fluorescence images were obtained within 20 minutes of PMA stimulation (Fig. 6a and S12†). From the fluorescence time course study, it was estimated that most of the ONOO− ions were released into the extracellular medium within the 40 to 60 minutes after initiation (Fig. 6b). After the bursting period, the secretion of ONOO− continued but with a slower releasing rate. These results are consistent with the studies of ONOO− in bulk solutions.51 To further validate these imaging results and observations, we performed real-time tracking of the PMA-stimulated macrophages without washing away the streptavidin–Cy5 (Fig. S13†). Although the signal-to-background ratio was reduced due to the presence of unbound streptavidin–Cy5, we were still able to track the increase of fluorescence along the plasma membrane over the 110 minute imaging time course.
Conclusion
In conclusion, by controlling the specific interaction of biotin and streptavidin with caged-biotin, we have introduced a new chemical probe design. To expand the scope, a new synthetic method was developed through which a wider range of analyte recognition group can be easily introduced to cage the biotin. The streptavidin–biotin controlled binding probe exhibits significant fluorescence amplification with minimum background and can adopt an unlimited selection of optimal dyes that cannot be achieved by the conventional chemical probes. The application of our controlled binding probe was demonstrated by imaging the ONOO− secretion at the cell surface of the RAW264.7 macrophages upon PMA stimulation. The ONOO− secretion from more than 95% of the cells was successfully captured and imaged at the cell surface, and the results were validated by flow cytometry. With this membrane-anchored controlled binding probe, we revealed that the RAW264.7 macrophages secrete ONOO− within the 20 minutes after PMA treatment and most of the ONOO− ions have been released into the extracellular medium 40–60 minutes later. Although the application of this CBP approach was demonstrated by imaging secreted ONOO− at the cell surface in this study, this design can also be used to image analytes inside the cells if a fixed-cell technique is employed (Fig. S14†). As the signals are generated upon the binding of streptavidin to the biotin probe, this highly versatile design can not only be used in fluorescent detection, but it can also be applied in various other detection modes, such as electrochemical and enzyme-amplified luminescence detection.Conflicts of interest
There are no conflicts to declare.Acknowledgements
We thank Prof. Lily Hui-Ching Wang for the FACS experiment. We are grateful to the Ministry of Science and Technology (Grant No.: 105-2113-M-007-004) and Ministry of Education (“Aim for the Top University Plan”; Grant No.: 105N501CE1), Taiwan (ROC), for financial support.Notes and references
- R. Weissleder, Nat. Biotechnol., 2001, 19, 316–317 CrossRef CAS PubMed.
- I. Johnson, The Molecular Probes Handbook: A Guide to Fluorescent Probes and Labeling Technologies, Life Technologies Corporation, 11th edn, 2010 Search PubMed.
- B. Xing, A. Khanamiryan and J. Rao, J. Am. Chem. Soc., 2005, 127, 4158–4159 CrossRef CAS PubMed.
- M. Sakabe, D. Asanuma, M. Kamiya, R. J. Iwatate, K. Hanaoka, T. Terai, T. Nagano and Y. Urano, J. Am. Chem. Soc., 2012, 135, 409–414 CrossRef PubMed.
- A. R. Lippert, E. J. New and C. J. Chang, J. Am. Chem. Soc., 2011, 133, 10078–10080 CrossRef CAS PubMed.
- X. Li, X. Gao, W. Shi and H. Ma, Chem. Rev., 2014, 114, 590–659 CrossRef CAS PubMed.
- X. Chen, X. Tian, I. Shin and J. Yoon, Chem. Soc. Rev., 2011, 40, 4783–4804 RSC.
- H. Kobayashi, M. Ogawa, R. Alford, P. L. Choyke and Y. Urano, Chem. Rev., 2010, 110, 2620–2640 CrossRef CAS PubMed.
- Y. Hong, J. W. Y. Lam and B. Z. Tang, Chem. Soc. Rev., 2011, 40, 5361–5388 RSC.
- J. Li, L. Chen, L. Du and M. Li, Chem. Soc. Rev., 2013, 42, 662–676 RSC.
- M. E. Roth, O. Green, S. Gnaim and D. Shabat, Chem. Rev., 2016, 116, 1309–1352 CrossRef CAS PubMed.
- T. Terai, E. Maki, S. Sugiyama, Y. Takahashi, H. Matsumura, Y. Mori and T. Nagano, Chem. Biol., 2011, 18, 1261–1272 CrossRef CAS PubMed.
- T. Peng, X. Chen, L. Gao, T. Zhang, W. Wang, J. Shen and D. Yang, Chem. Sci., 2016, 7, 5407–5413 RSC.
- J. J. Hu, N.-K. Wong, M.-Y. Lu, X. Chen, S. Ye, A. Q. Zhao, P. Gao, R. Yi-Tsun Kao, J. Shen and D. Yang, Chem. Sci., 2016, 7, 2094–2099 RSC.
- W. Chen, C. Liu, B. Peng, Y. Zhao, A. Pacheco and M. Xian, Chem. Sci., 2013, 4, 2892–2896 RSC.
- J. Chan, S. C. Dodani and C. J. Chang, Nat. Chem., 2012, 4, 973–984 CrossRef CAS PubMed.
- H. Ischiropoulos, L. Zhu and J. S. Beckman, Arch. Biochem. Biophys., 1992, 298, 446–451 CrossRef CAS PubMed.
- K. A. Broniowska, C. E. Mathews and J. A. Corbett, J. Biol. Chem., 2013, 288, 36567–36578 CrossRef CAS PubMed.
- F. C. Fang, Nat. Rev. Microbiol., 2004, 2, 820–832 CrossRef CAS PubMed.
- J. S. Stamler, S. Lamas and F. C. Fang, Cell, 2001, 106, 675–683 CrossRef CAS PubMed.
- A. Sikora, J. Zielonka, M. Lopez, J. Joseph and B. Kalyanaraman, Free Radical Biol. Med., 2009, 47, 1401–1407 CrossRef CAS PubMed.
- X. Sun, Q. Xu, G. Kim, S. E. Flower, J. P. Lowe, J. Yoon, J. S. Fossey, X. Qian, S. D. Bull and T. D. James, Chem. Sci., 2014, 5, 3368–3373 RSC.
- N. A. Sieracki, B. N. Gantner, M. Mao, J. H. Horner, R. D. Ye, A. B. Malik, M. E. Newcomb and M. G. Bonini, Free Radical Biol. Med., 2013, 61, 40–50 CrossRef CAS PubMed.
- T. Peng, N.-K. Wong, X. Chen, Y.-K. Chan, D. H.-H. Ho, Z. Sun, J. J. Hu, J. Shen, H. El-Nezami and D. Yang, J. Am. Chem. Soc., 2014, 136, 11728–11734 CrossRef CAS PubMed.
- X. Li, R.-R. Tao, L.-J. Hong, J. Cheng, Q. Jiang, Y.-M. Lu, M.-H. Liao, W.-F. Ye, N.-N. Lu, F. Han, Y.-Z. Hu and Y.-H. Hu, J. Am. Chem. Soc., 2015, 137, 12296–12303 CrossRef CAS PubMed.
- E. W. Miller, A. E. Albers, A. Pralle, E. Y. Isacoff and C. J. Chang, J. Am. Chem. Soc., 2005, 127, 16652–16659 CrossRef CAS PubMed.
- A. R. Lippert, G. C. Van de Bittner and C. J. Chang, Acc. Chem. Res., 2011, 44, 793–804 CrossRef CAS PubMed.
- K. Kim, H. Yang, S. Jon, E. Kim and J. Kwak, J. Am. Chem. Soc., 2004, 126, 15368–15369 CrossRef CAS PubMed.
- S. A. Sundberg, R. W. Barrett, M. Pirrung, A. L. Lu, B. Kiangsoontra and C. P. Holmes, J. Am. Chem. Soc., 1995, 117, 12050–12057 CrossRef CAS.
- M. Hengsakul and A. E. Cass, Bioconjugate Chem., 1996, 7, 249–254 CrossRef CAS PubMed.
- T.-W. Wu, F.-H. Lee, R.-C. Gao, C. Y. Chew and K.-T. Tan, Anal. Chem., 2016, 88, 7873–7877 CrossRef CAS PubMed.
- R. Hu, J. Feng, D. Hu, S. Wang, S. Li, Y. Li and G. Yang, Angew. Chem., Int. Ed., 2010, 49, 4915–4918 CrossRef CAS PubMed.
- M. Taki, S. Iyoshi, A. Ojida, I. Hamachi and Y. Yamamoto, J. Am. Chem. Soc., 2010, 132, 5938–5939 CrossRef CAS PubMed.
- R. J. Singh, N. Hogg, J. Joseph, E. Konorev and B. Kalyanaraman, Arch. Biochem. Biophys., 1999, 361, 331–339 CrossRef CAS PubMed.
- J. L. Trackey, T. F. Uliasz and S. J. Hewett, J. Neurochem., 2001, 79, 445–455 CrossRef CAS PubMed.
- M. Kirsch and H. de Groot, J. Biol. Chem., 1999, 274, 24664–24670 CrossRef CAS PubMed.
- F. J. Martin-Romero, Y. Gutiérrez-Martin, F. Henao and C. Gutiérrez-Merino, J. Fluoresc., 2004, 14, 17–23 CrossRef CAS PubMed.
- P. Pacher, J. S. Beckman and L. Liaudet, Physiol. Rev., 2007, 87, 315–424 CrossRef CAS PubMed.
- A. G. McBride and G. C. Brown, FEBS Lett., 1997, 417, 231–234 CrossRef CAS PubMed.
- G. Ferrer-Sueta and R. Radi, ACS Chem. Biol., 2009, 4, 161–177 CrossRef CAS PubMed.
- S. Pfeiffer, E. Leopold, K. Schmidt, F. Brunner and B. Mayer, Br. J. Pharmacol., 1996, 118, 1433–1440 CrossRef CAS PubMed.
- J. M. Simons, B. A. Hart, T. R. Ip Vai Ching, H. Van Dijk and R. P. Labadie, Free Radical Biol. Med., 1990, 8, 251–258 CrossRef CAS PubMed.
- S. Heumuller, S. Wind, E. Barbosa-Sicard, H. H. Schmidt, R. Busse, K. Schroder and R. P. Brandes, Hypertension, 2008, 51, 211–217 CrossRef PubMed.
- G. L. Squadrito, R. Cueto, A. E. Splenser, A. Valavanidis, H. Zhang, R. M. Uppu and W. A. Pryor, Arch. Biochem. Biophys., 2000, 376, 333–337 CrossRef CAS PubMed.
- M. C. Krishna, A. Russo, J. B. Mitchell, S. Goldstein, H. Dafni and A. Samuni, J. Biol. Chem., 1996, 271, 26026–26031 CrossRef CAS PubMed.
- M. K. Stern, M. P. Jensen and K. Kramer, J. Am. Chem. Soc., 1996, 118, 8735–8736 CrossRef CAS.
- J. Zielonka, A. Sikora, J. Joseph and B. Kalyanaraman, J. Biol. Chem., 2010, 285, 14210–14216 CrossRef CAS PubMed.
- J. A. Fee and C. Bull, J. Biol. Chem., 1986, 261, 13000–13005 CAS.
- C. Amatore, S. Arbault and A. C. W. Koh, Anal. Chem., 2010, 82, 1411–1419 CrossRef CAS PubMed.
- M. K. Hulvey, C. N. Frankenfeld and S. M. Lunte, Anal. Chem., 2010, 82, 1608–1611 CrossRef CAS PubMed.
- A. Kumar, S. H. Chen, M. B. Kadiiska, J. S. Hong, J. Zielonka, B. Kalyanaraman and R. P. Mason, Free Radical Biol. Med., 2014, 73, 51–59 CrossRef CAS PubMed.
Footnotes |
| † Electronic supplementary information (ESI) available. See DOI: 10.1039/c7sc04014h |
| ‡ These authors contributed equally. |
| This journal is © The Royal Society of Chemistry 2018 |

