 Open Access Article
Creative Commons Attribution 3.0 Unported Licence
Praeruptorin B improves diet-induced hyperlipidemia and alleviates insulin resistance via regulating SREBP signaling pathway
Zu-Guo Zheng a,
Chong Lua,
Pyone Myat Thua,
Xin Zhanga,
Hui-Jun Lia,
Ping Li
 *a and
Xiaojun Xu*ab
aState Key Laboratory of Natural Medicines, China Pharmaceutical University, 210009, Nanjing, Jiangsu, China. E-mail: xiaojunxu2000@163.com; liping2004@126.com
bJiangsu Key Laboratory of Drug Discovery for Metabolic Diseases, China Pharmaceutical University, 210009, Nanjing, Jiangsu, China
First published on 2nd January 2018
Abstract
Many metabolic diseases are caused by disruption of lipid homeostasis. Sterol regulatory element-binding proteins (SREBPs) are a family of nuclear transcription factors that are associated with lipid de novo synthesis, thereby, SREBPs have been considered as targets for the treatment of metabolic diseases. In this study, we identified praeruptorin B as a novel inhibitor of SREBPs. HepG2 cells were used to verify lipid-lowering effects of praeruptorin B. The expression of SREBPs, as well as their target genes was markedly suppressed. Furthermore, we found that praeruptorin B inhibits the proteins expression of SREBP by regulating PI3K/Akt/mTOR pathway. In praeruptorin B-treated high fat diet (HFD)-fed obese mice, HFD induced lipid deposition, hyperlipidemia and insulin resistance were significantly ameliorated, and SREBPs and related genes in liver were down-regulated. These findings suggest that praeruptorin B exerts lipid-lowering effects through SREBPs regulation and could serve as a possible therapeutic option to improve hyperlipidemia and hyperlipidemia-induced comorbidities.
1. Introduction
Metabolic syndrome is one of the major global escalating public health concerns.1 Hyperlipidemia is closely related to metabolic diseases, such as insulin resistance, type 2 diabetes mellitus (T2DM) and atherosclerosis.2,3 Thus, regulating the signaling pathway of lipid metabolism and inhibition of the accumulation of triglyceride and cholesterol are important targets for preventing obesity and associated metabolic diseases.3–5SREBPs are a family of transcription factors of a basic-helix-hoop-helix-leucine zipper (bHLH-LZ) that regulate lipid homeostasis by controlling the expression of a range of genes required for fatty acids, cholesterol, triacylglycerides and phospholipids synthesis.6,7 The three isoforms of SREBPs, namely, SREBP-1a, SREBP-1c and SREBP-2 play different roles in lipid biosynthesis. SREBP-1a and SREBP-1c primarily regulate fatty acid synthesis. SREBP-2 mainly stimulates cholesterol synthesis and LDL receptor (LDLR) expression.8 In mammalian, SREBPs are synthesized as inactive precursors that are retained in the endoplasmic reticulum (ER). When they are stimulated by insulin or exposed to low sterol condition, N-terminus of SREBPs (N-SREBPs) released from ER.9 After binding to sterol-sensing protein, SREBP cleavage-activating protein (SCAP), SREBPs are transported via the coated protein II (COP II) vesicles to the Golgi apparatus where site-1 protease (S1P) and site-2 protease (S2P) proteolytically release the N-SREBPs, the N-SREBPs then translocate to the nucleus and bind on SRE or E-box sequences of their target genes, and subsequently activate the expression of these fatty acid and cholesterol biosynthesis related genes.10–12 Therefore, inhibition of SREBPs by small molecules may be an effective strategy to treat metabolic diseases, such as obesity, T2DM and atherosclerosis.7,13,14
Peucedani Radix (Qian-Hu in Chinese), the dried roots of Peucedanum praeruptorum Dunn, has been widely applied for the therapy of cough with thick sputum and dyspnea, nonproductive cough and upper respiratory infections in traditional medicinal assay.15–18 There are several types of compounds reported in Peucedani Radix, and the major constituents are coumarins containing praeruptorin A, B, C, D and E. Praeruptorin B exhibited several pharmacological activities including angiectasis, sputum-resolving, asthma-relieving, inhibition of tumor promoter induced phenomenon in vivo and potent anti-inflammatory action.19 However, the effects of praeruptorin B on metabolic diseases, such as obesity, hyperlipidemia and insulin resistance, and the detailed mechanisms have not yet been clarified. The aim of this study is to investigate the hypolipidemic effect of praeruptorin B and unravel the mechanism of praeruptorin B on lipid metabolism by targeting SREBPs pathway.
2. Materials and methods
2.1. Reagents
Praeruptorin B was purchased from Chengdu Pufei De Biotech Co., Ltd (Chengdu, China). Okadaic acid was from Selleckchem (Shanghai, China). Filipin were from (APExBIO, Houston, USA). MHY1485 was purchased from MedChem Express (Shanghai, China). Luciferase assay reagents were from Promega (Madison, Wisconsin, USA). 3-(4,5-Dimethylthiazol-2-yl)-2, 5-diphenyltetrazoliumbromide (MTT), 25-hydroxycholesterol (25-HC), lovastatin, compactin, and nile-red were purchased from Sigma-Aldrich (St. Louis, MO, USA). Fetal Bovine Serum (FBS), DMEM and F12K medium were purchased from GIBCO (Grand Island, New York, USA). Lipoprotein-deficient serum (LPDS) was purchased from Kalen Biomedical (Montgomery Cillage, MD, USA). Plasmids sh-TSC1 was kindly provided by Prof. Aurelio Teleman at DKFZ. HA-Akt was a gift from Prof. Yong Liao (Chongqing Medical University).2.2. Antibodies
Antibodies against SREBP-1 (cat. no. sc-8984) and β-actin (cat. no. sc-47778) were obtained from Santa Cruz (Dallas, USA), SREBP-2 (cat. no. 30682) were from Abcam (Cambridge, Britain). Antibodies against mTOR (cat. no. 2983s), phospho-mTOR (Ser2448) (cat. no. 2971s), Akt (cat. no. 4691), phospho-Akt (Ser473) (cat. no. 4060), p70SK6 (cat. no. 9202), phospho-p70S6K (Thr389) (cat. no. 9206s) and phospho-PI3K (Tyr458) (cat. no. 4228) were purchased from Cell Signaling Technology (Beverly, USA). PI3K (cat. no. A0054) and HA (cat. no. AE008) was purchased from ABclonal Technology (Wuhan, China).2.3. Cell culture
HepG2 cells were originally obtained from ATCC. HL-7702 cells were purchased from Keygen Biotech (Nanjing, China). All cell lines were cultured at 37 °C, 5% CO2 in DMEM supplemented with 10% FBS. To generate of HL-7702/SRE-Luc reporter cell lines, HL-7702 cells were transfected with pSRE-Luc and the monoclonal cells were screened out by renewing medium with hygromycin B (Roche, Germany).20,212.4. Cell proliferation assay
Cell proliferation was determined by the MTT assays. The HepG2 cells were seeded in 96-well plates with 2.0 × 10⁴ cells per well in DMEM containing 10% FBS for 24 h. Cells were further treated with or without praeruptorin B for 18 h. Then, cells were incubated with MTT solution (5 mg ml−1) for 4 h at 37 °C, the supernatant was aspirated, and 150 μl dimethyl sulfoxide (DMSO) was added to each well.2.5. Luciferase reporter assay
The HL-7702/SRE-Luc reporter cells were seeded into the 96-well plate, treated with or without praeruptorin B and cultured in DMEM containing 5% lipoprotein-deficient fetal bovine serum (LPDS), 10 μM compactin and 10 μM mevalonate (medium E) for 18 h. The media was removed. Cells were washed in PBS twice and incubated in reporter lysis buffer in room temperature for 20 min. Subsequently, the liquid was transferred to the 96-well white plate, and the luciferase assay solution was added into each well in the dark.2.6. Western blot analysis
HepG2 cells were lysed with ice-cold lysis buffer.36 Individual immunoblot was probed with rabbit anti-SREBP-1, SREBP-2, mTOR, p-mTOR, Akt, p-Akt, p70s6k, p-p70s6k, p-PI3K and PI3K antibodies diluted 1![[thin space (1/6-em)]](https://www.rsc.org/images/entities/char_2009.gif) :
:![[thin space (1/6-em)]](https://www.rsc.org/images/entities/char_2009.gif) 1000, and mouse anti-β-actin antibody diluted 1
1000, and mouse anti-β-actin antibody diluted 1![[thin space (1/6-em)]](https://www.rsc.org/images/entities/char_2009.gif) :
:![[thin space (1/6-em)]](https://www.rsc.org/images/entities/char_2009.gif) 1000. Chemiluminesence signals were semi-quantified as previously described.22
1000. Chemiluminesence signals were semi-quantified as previously described.22
2.7. Nile-red staining and filipin staining
HepG2 cells were seeded in 96-well plates at the density of 2 × 10⁴ cells per well cultured in 5% CO2 at 37 °C for 24 h. And then the cells were incubated in medium E with or without praeruptorin B for 18 h. The cells were fixed with 4% paraformaldehyde (PFA) for 10 min and then washed in PBS for three times. 0.5 μg ml−1 nile-red solution and 50 μg ml−1 filipin solution were used to stain the treated cells for 30 min at 25 °C. The cells were observed by the EVOS FL Auto microscope (Life technologies, USA) and analyzed using Image Pro Plus.2.8. Quantitative real-time RT-PCR
Total RNA extraction was performed using Trizol (Vazyme, Nanjing, China) according to the manufacturer's instructions. RNA concentrations were equalized and converted to cDNA using Hiscript II reverse transcriptase, (Vazyme, Nanjing, China). Gene expression was measured with a LightCycler 96 Real-Time PCR System (Roche, Basel, Switzerland) using SYBR-green dyes (Roche, Basel, Switzerland). All data were analyzed using GAPDH gene expression as internal standard. The sequences of primers used are listed in Table 1.| Specifies | Gene name | Sequence of forward and reverse primers (5′ to 3′) |
|---|---|---|
| Mus musculus | GAPDH | TGTGTCCGTCGTGGATCTGA |
| CCTGCTTCACCACCTTCTTGAT | ||
| SREBP-1a | GGCCGAGATGTGCGAACT | |
| TTGTTGATGAGCTGGAGCATGT | ||
| SREBP-2 | GCGTTCTGGAGACCATGGA | |
| ACAAAGTTGCTCTGAAAACAAATCA | ||
| SCAP | ATTTGCTCACCGTGGAGATGTT | |
| GAAGTCATCCAGGCCACTACTAATG | ||
| HMGCS | GCCGTGAACTGGGTCGAA | |
| GCATATATAGCAATGTCTCCTGCAA | ||
| HMGCR | CTTGTGGAATGCCTTGTGATTG | |
| AGCCGAAGCAGCACATGAT | ||
| FDPS | ATGGAGATGGGCGAGTTCTTC | |
| CCGACCTTTCCCGTCACA | ||
| SS | CCAACTCAATGGGTCTGTTCCT | |
| TGGCTTAGCAAAGTCTTCCAACT | ||
| LDLR | AGGCTGTGGGCTCCATAGG | |
| TGCGGTCCAGGGTCATCT | ||
| ACC | TGACAGACTGATCGCAGAGAAAG | |
| TGGAGAGCCCCACACACA | ||
| Fasn | GCTGCGGAAACTTCAGGAAAT | |
| AGAGACGTGTCACTCCTGGACTT | ||
| SCD-1 | CCGGAGACCCCTTAGATCGA | |
| TAGCCTGTAAAAGATTTCTGCAAACC | ||
| ACOX1 | TTTGTTGTCCCTATCCGTGAGA | |
| CCGATATCCCCAACAGTGATG | ||
| ApoB | CGTGGGCTCCAGCATTCTA | |
| TCACCAGTCATTTCTGCCTTTG | ||
| ApoE | GCTGGGTGCAGACGCTTT | |
| TGCCGTCAGTTCTTGTGTGACT | ||
| Mus musculus | GK | CCGTGATCCGGGAAGAGAA |
| GGGAAACCTGACAGGGATGAG | ||
| ACL | GCCAGCGGGAGCACATC | |
| CTTTGCAGGTGCCACTTCATC | ||
| ACS | GCTGCCGACGGGATCAG | |
| TCCAGACACATTGAGCATGTCAT | ||
| G-6-PD | GAACGCAAAGCTGAAGTGAGACT | |
| TCATTACGCTTGCACTGTTGGT | ||
| IRS-1 | GCGGGCTGACTCCAAGAAC | |
| GCTATCCGCGGCAATGG | ||
| IRS-2 | GGAGAACCCAGACCCTAAGCTACT | |
| GATGCCTTTGAGGCCTTCAC | ||
| PEPCK | CCACAGCTGCTGCAGAACA | |
| GAAGGGTCGCATGGCAAA | ||
| ABCA1 | CGTTTCCGGGAAGTGTCCTA | |
| GCTAGAGATGACAAGGAGGATGGA | ||
| ABCG5 | TGGATCCAACACCTCTATGCTAAA | |
| GGCAGGTTTTCTCGATGAACTG | ||
| Insig-1 | TCACAGTGACTGAGCTTCAGCA | |
| TCATCTTCATCACACCCAGGAC | ||
| Insig-2a | CCCTCAATGAATGTACTGAAGGATT | |
| TGTGAAGTGAAGCAGACCAATGT | ||
| Insig-2b | CCGGGCAGAGCTCAGGAT | |
| GAAGCAGACCAATGTTTCAATGG | ||
| HL | GGAGGAATCTGTTCAACTCTCTCG | |
| AGAAAGACGATTGCTGGGGG | ||
| SR-B1 | TGGACAAATGGAACGGACTC | |
| GTGAAGCGATACGTGGGAAT | ||
| LPL | CTTCTTGATTTACACGGAGGT | |
| ATGGCATTTCACAAACACTG | ||
| PPARα | TCTGTGGGCTCACTGTTCT | |
| AGGGCTCATCCTGTCTTTG | ||
| Leptin | CGGTTCCTGTGGCTTTGG | |
| GGTCTGAGGCAGGGAGCA | ||
| Adiponectin | GTTGCAAGCTCTCCTGTTCC | |
| TCTCCAGGAGTGCCATCTCT | ||
| Glut1 | GAGCATCTTCGAGAAGGCAGGTGT | |
| GGCCACAATGAACCATGGAATA | ||
| Glut4 | AGTGACTGGGACACTGGTCCTT | |
| ACATTGTTGGCCAGCATAGC | ||
| Mus musculus | PPAR-γ | GGCTGAGGAGAAGTCACACTCTG |
| AAATCTTGTCTGTCACACAGTCCTG | ||
| UCP-1 | GTGAAGGTCAGAATGCAAGC | |
| AGGGCCCCCTTCATGAGGTC | ||
| UCP-2 | GCCCCTTCACCTCTTTAGCA | |
| CCAAGCACTGGGAAGGTCTAAC | ||
| PCSK9 | ACCCTCATAGGCCTGGAGTT | |
| CTGTGATGACCTCTGGAGCA | ||
| Homo sapiens | SREBP-2 | AACGGTCATTCACCCAGGTC GGCTGAAGAATAGGAGTTGCC |
| HMGCR | TGATTGACCTTTCCAGAGCAAG CTAAAATTGCCATTCCACGAGC | |
| LDLR | ACCAACGAATGCTTGGACAAC ACAGGCACTCGTAGCCGAT | |
| SREBP-1c | ACAGTGACTTCCCTGGCCTAT GCATGGACGGGTACATCTTCAA | |
| ACC-1 | ATGTCTGGCTTGCACCTAGTA CCCCAAAGCGAGTAACAAATTCT | |
| SCD | TCTAGCTCCTATACCACCACCA TCGTCTCCAACTTATCTCCTCC | |
| FASD-2 | GACCACGGCAAGAACTCAAAG GAGGGTAGGAATCCAGCCATT |
2.9. Animal experiments
All experiments and animal care in this study were conducted in accordance with the Provision and General Recommendation of Chinese Experimental Animals Administration Legislation and approved by the Science and Technology Department of Jiangsu Province (SYXK (SU) 2016-0011). All mice were housed in colony cages and maintained on a light/dark cycle. All mice were fed with HFD (TROPHIC, Nantong, China) or with a normal diet (TROPHIC, Nantong, China). On a caloric basis, the HFD (product#; TP23300) contained 60% fat, 20.6% carbohydrate and 19.4% protein, whereas the normal diet (product#; XT007) contained 13% fat, 60% carbohydrate and 27% protein. Six-week-old male C57BL/6J mice were purchased from Nanjing Biomedical Research Institute (Nanjing, China), were allowed to acclimatize for one week before the experiment. Then mice were randomly divided into the following four groups (n = 6 per group): vehicle-treated chow group, vehicle-treated HFD group, lovastatin-treated HFD group (30 mg per kg per day) and praeruptorin B-treated HFD group (25 or 50 mg per kg per day). HFD-fed mice were gavaged with praeruptorin B or lovastatin dissolved in 0.5% CMC-Na for 6 weeks. All mice were sacrificed by cervical dislocation after overnight fasting at the termination of the experiment. All animal experiments were performed in accordance with the approved guidelines.2.10. Metabolic measurements
After administration for 6 weeks, mice randomly selected from each group were maintained in a comprehensive lab animal monitoring system (TSE PhenoMaster, Thuringia, Germany) according to the instructions of the manufacturer. After mice were acclimated in the metabolic chamber for 12 h, volume of O2 consumption and CO2 production were continuously recorded over 24 h period. RQ equals volumes of CO2 released/volumes of O2 consumed.2.11. Rectal temperature measurement
The rectal temperatures of the mice were measured with a rectal probe attached to a digital thermometer (OMRON, Japan).2.12. Glucose tolerance and insulin tolerance tests
Glucose tolerance tests (GTT) and insulin tolerance tests (ITT) were performed on mice fasted overnight with free access to water. Mice were injected with 0.75 U kg−1 insulin (Sigma) by i. p. or gavaged with 2 g kg−1 glucose (Sigma) by i. g. Glucose levels were measured from tail blood and 15, 30, 60, or 120 min after the injection. All animals were sacrificed 3 days after glucose tolerance or insulin tolerance tests, and blood and liver were harvested. Area under the curve (AUC) was calculated to quantify the GTT and ITT results.2.13. Body composition analysis by NMR
After 5 week treatment, the mice were scanned with the minispec TD-NMR designed for experimental animals (Bruker, Germany). The fat ratio was calculated according to the measurement of body fat, lean and liquid in mice.2.14. Fecal cholesterol and triglyceride measurements
Fecal samples were collected over the final 3 days of the study, which were lyophilized and pulverized prior to analysis. Dry feces (250 mg) were extracted twice with 4 ml of methanol![[thin space (1/6-em)]](https://www.rsc.org/images/entities/char_2009.gif) :
:![[thin space (1/6-em)]](https://www.rsc.org/images/entities/char_2009.gif) chloroform (1
chloroform (1![[thin space (1/6-em)]](https://www.rsc.org/images/entities/char_2009.gif) :
:![[thin space (1/6-em)]](https://www.rsc.org/images/entities/char_2009.gif) 2, v/v). The supernatants were pooled, and 100 μL of the supernatant was removed exactly and evaporated to dryness. Triglycerides were measured with determination kit (Kehua Biotechnology, Shanghai, China). The preparation for determination of total cholesterol in samples by GC-MS was performed as described previously.21
2, v/v). The supernatants were pooled, and 100 μL of the supernatant was removed exactly and evaporated to dryness. Triglycerides were measured with determination kit (Kehua Biotechnology, Shanghai, China). The preparation for determination of total cholesterol in samples by GC-MS was performed as described previously.21
2.15. Gas chromatography-mass spectrometry analysis
GC-MS analysis was performed with an Agilent 7890B gas chromatograph interfaced to an Agilent 5977A mass-selective detector equipped with HP-5ms Ultra Inert (30 m × 250 m × 0.25 m) column (Agilent Technologies, USA). The parameter settings were used as previous reported.212.16. Serum and liver lipid determination
Serum total cholesterol (TC), triglycerides (TG), alanine aminotransferase (ALT), aspartate aminotransferase (AST), low-density lipoprotein cholesterol (LDL-c) and high-density lipoprotein cholesterol (HDL-c) were quantified using assay kits (Nanjing Jiancheng Bioengineering Institute, Nanjing, China) with a biochemistry analyzer (Biotek, Vermont, USA). Serum insulin levels were analyzed using ELISA kits (CUSABIO, Wuhan, China). Cholesterol and triglycerides levels were also quantified in liver homogenates.2.17. Histological analysis of liver and adipose tissues
Livers, interscapular brown adipose tissues (BAT) and epididymal white adipose tissues (WAT) were fixed in 4% paraformaldehyde solution at 4 °C. Overnight and embedded in paraffin wax. The paraffin sections were cut at 5 μm onto poly-L-lysine-coated slides, and stained with hematoxylin and eosin. Livers were embedded in Tissue-Tek OCT cryostat molds (Leica Biosystem, Shanghai, China) and frozen at −20 °C. Then, they were sectioned at 10 μm in a crytostat and stained in 0.5% oil red O (Sigma, USA).2.18. Statistical analysis
All quantitative values are presented as mean ± SD. Statistical data were analyzed using a two-tailed Student's t-test. A P value <0.05 was considered as statistically significant.3. Results
3.1. Praeruptorin B inhibits the SREBPs activity and decreases intracellular lipid levels in vitro
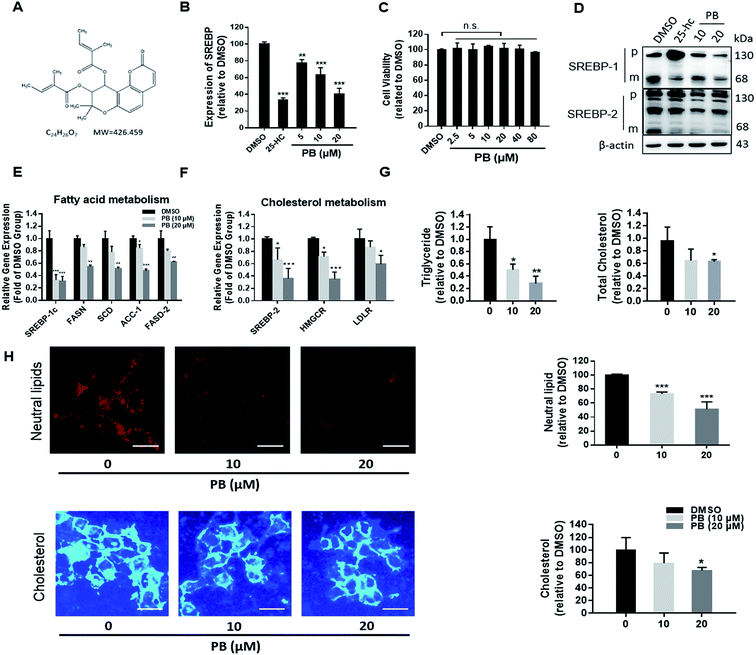
In the previous work, we established a human liver HL-7702/SRE-Luc cell lines expressing a luciferase reporter driven by a SRE-containing promoter.21 In order to verify the reliability of the luciferase reporter system, 25-HC, a well-known inhibitor of SREBP processing,23 was used as a positive control. As shown in Fig. 1B, 25-HC significantly decreased the luciferase activity. Using this screening system, praeruptorin B (Fig. 1A) was found to powerfully decrease the SRE-luciferase activity, and this effect is dose dependent (Fig. 1B). Those results demonstrated that praeruptorin B is a potent SREBP inactivator. MTT assay was next used to investigate its safety in vitro, praeruptorin B showed negligible cytotoxicity, even at the higher concentration (Fig. 1C). SREBPs are synthesized as inactive precursors. When cellular choleserol is low, the inactive precursors are proteolytically processed to the mature forms that function as active transcription factors. Previous studies have reported that 25-HC blocks SREBPs processing by binding to Insigs, triggering their binding to SCAP and retaining the SCAP/SREBP complex in the ER.24 25-HC significancy decreased the levels of mature SREBP-1 and -2 (Fig. 1D), but upregulated the precursor SREBP levels (Fig. 1D), because of activating LXR that in turn upregulates the transcription of SREBP. Different from 25-HC, praeruptorin B reduced the level of precursor and mature forms of both SREBP-1 and -2 (Fig. 1D). Those results suggesting that the mechanism by which praeruptorin B inhibits SREBP activity may be different from that of 25-HC. We next detected the mRNA level of SREBP-1c target genes, such as FASN, SCD and ACC-1, involved in fatty acid synthesis, and found that all of the mRNA level of these genes were reduced (Fig. 1E). Similarly, SREBP-2 target genes, such as HMGCR and LDLR were significantly decreased by praeruptorin B (Fig. 1F). Praeruptorin B also significantly downregulated the expression of SREBP-1c and SREBP-2 (Fig. 1F). SREBPs are considered as master regulators of lipid homeostasis by controlling the expression of target genes which are required for cholesterogenesis and lipogenesis.6 Therefore, we examined the level of cellular lipid in HepG2 cells. Notably, praeruptorin B reduced both total cholesterol and triglycerides contents (Fig. 1G). Consistent with the above results, praeruptorin B decreased the steady-state levels of neutral lipids (mainly cholesterol and triglyceride) and cellular cholesterol (Fig. 3H). These results indicated that praeruptorin B inhibits the SREBPs activity and decreases intracellular lipid levels in vitro.3.2. Praeruptorin B inhibits the expression of SREBPs through PI3K/Akt/mTOR pathway
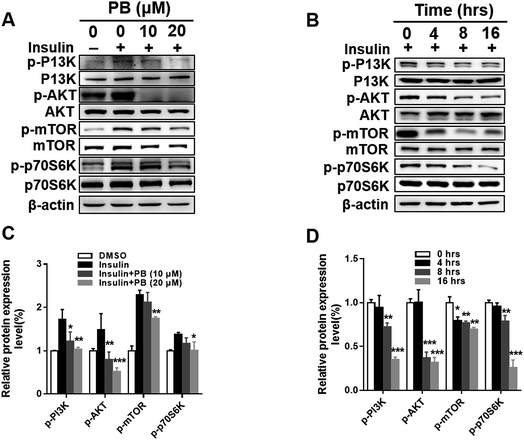
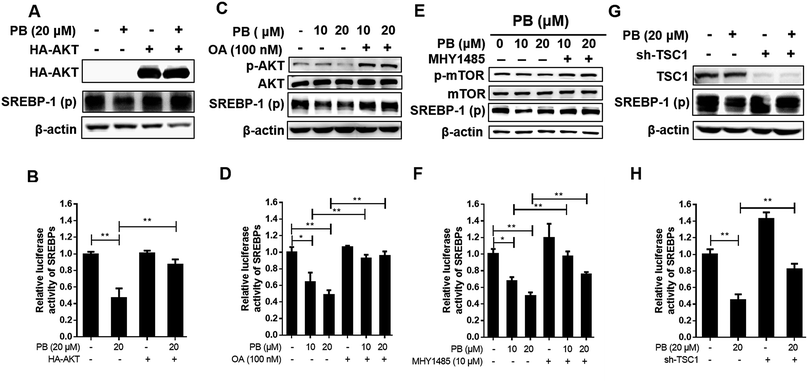
Praeruptorin B significantly decreased the expression of SREBPs in the mRNA and protein (precursor and mature formation) levels (Fig. 1D–F). Therefore, we put forward a hypothesis that praeruptorin B inhibits the SREBPs activity through disturbing the SREBPs transcription expression. The SREBPs transcription expression is mainly regulated by insulin signaling pathway. Studies have shown that the enhanced transcription of SREBP is partially through PI3K/Akt/mTORC1.25–27 Next, we performed experiments to confirm whether the inhibition of SREBPs expression by praeruptorin B is inhibited through the PI3K/Akt pathway. Insulin or insulin-like growth factor upregulates PI3K and its downstream targets including Akt and mTOR, resulting in inactivation of SREBPs expression.28 As shown in Fig. 2A and C, insulin treatment for 1 h significantly phosphorylated PI3K and activated its downstream kinases activity, including Akt, mTOR and p70s6k. The insulin-induced activation of both PI3K and Akt was suppressed by praeruptorin B in a concentration- and time-dependent manner (Fig. 2A–D). In addition, the downstream kinases mTOR and p70s6k activation were also abolished upon praeruptorin B treatment in HepG2 cells (Fig. 2A–D). These results demonstrated that insulin signaling pathway may mediate the inhibition of SREBP transcription expression by praeruptorin B. To further verify that the decreased SREBPs transcription expression by praeruptorin B is through PI3K/Akt/mTOR signaling pathway, we overexpressed exogenous Akt followed by praeruptorin B (10 μM) for 6 h. As shown in Fig. 3A, pre-overexpression of Akt rescued the decreased SREBP-1 by praeruptorin B in HepG2 cells. Moreover, the dilapidated SREBP activity was recovered by overexpressed Akt (Fig. 3B). Okadaic acid, a PP2A phosphatase inhibitor, facilitates the Akt maintaining phosphorylation level.29 Actually, okadaic acid resistanted the decreased phosphp-Akt induced by praeruptorin B. More importantly, the protein expression and transcription activity of SREBP were recovered by okadaic acid (Fig. 3C and D). Moreover, MHY1485, which is a potent mTOR activator (Fig. 3E), rescued SREBP abundance and activity (Fig. 3E). Similarly, the inhibition of SREBP could also be reversed by shRNA of TSC1, which is a negative regulator of mTOR by suppressing Rheb (Fig. 3G). When the activity of mTOR was activated by MHY1485 or the shRNA of TSC1, the reduction of SREBPs activity (Fig. 3F and H) was reversed. All together, these data indicated that mTOR mediates the inhibition of SREBPs processing by praeruptorin B. Therefore, praeruptorin B inhibits the SREBPs transcription expression through PI3K/Akt/mTOR signaling pathway.3.3. Praeruptorin B ameliorates diet-induced obesity in mice
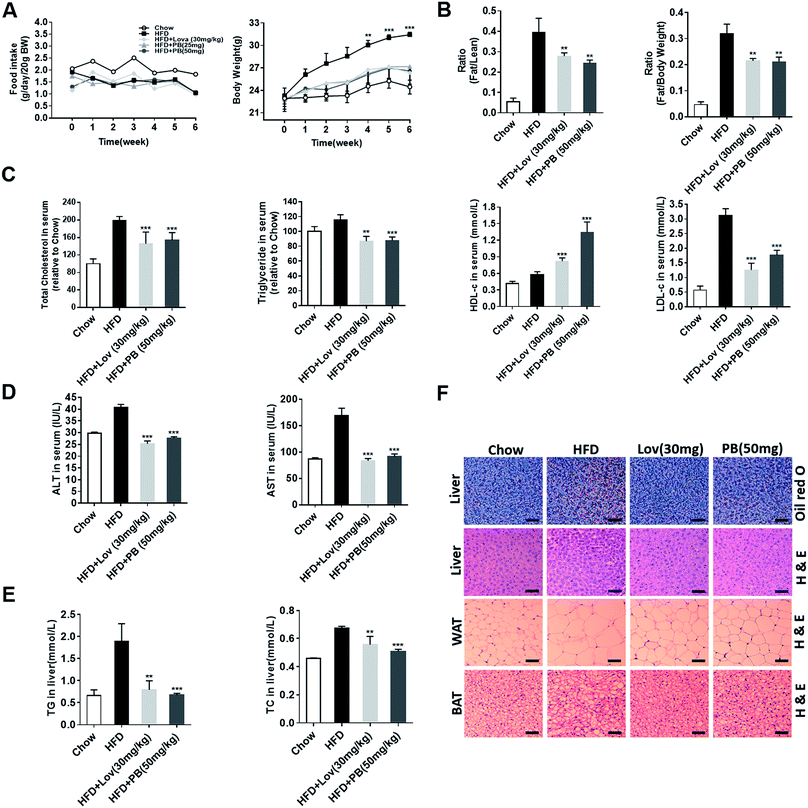
To verify the effect of praeruptorin B in vivo, the high fat diet (HFD)-fed C57BL/6J mice were treated with vehicle (0.5% CMC-Na), lovastatin (30 mg per kg per day), or praeruptorin B (25 or 50 mg per kg per day) for 6 weeks. During the process, no significant difference of food intake was either in praeruptorin B or lovastatin treated groups (Fig. 4A). The mice treated with praeruptorin B (50 mg kg−1) or lovastatin (30 mg kg−1) were significantly lighter than the vehicle treated mice, although they were still heavier than the chow diet-fed mice, suggesting that praeruptorin B and lovastatin can ameliorate diet-induced obesity (DIO) (Fig. 4A). More importantly, the fat/lean and fat/body-weight ratios were obviously dropped at the same dosage of praeruptorin B and lovastatin treated mice by nuclear magnetic response (NMR) analysis (Fig. 4B). These results demonstrated that praeruptorin B ameliorates diet-induced obesity in mice.3.4. Praeruptorin B ameliorates diet-induced lipid accumulation in blood, liver and adipose tissues in DIO mice
Next, we measured the lipid levels in blood, liver and adipose tissues to determine the potential role of praeruptorin B in the improvement of lipid accumulation of HFD-fed mice. As shown in Fig. 4C, the serum TC and TG levels of lovastatin and praeruptorin B treated mice were significantly lower than those of the HFD-fed mice. Praeruptorin B increased HDL-c and decreased LDL-c similar as lovastatin (Fig. 4C). In addition, compared with vehicle treated mice, praeruptorin B significantly lowered the level of TC and TG in liver (Fig. 4E), comparable to lovastatin. Lipid accumulation in the liver leads to liver dyfunction, induced fatty liver and liver injury. Alanine aminotransferase (ALT) and aspartate aminotransferase (AST) in blood are the most common indicators for hepatic and extra hepatic tissue damage, the elevated ALT and AST induced by HFD were decreased by lovastatin and praeruptorin B treatment (Fig. 4D). Moreover, the lipid accumulation in the liver was visualized by oil red O and H&E staining. The staining results revealed that praeruptorin B-treated mice exhibited less lipid accumulation than that of vehicle treated mice (Fig. 4F). This is consistent with the previous data that praeruptorin B notably inhibited hepatic TC and TG accumulation (Fig. 4E). Histological analysis showed that praeruptorin B also reduced the cell size of both WAT and BAT (Fig. 4F). Taken together, these results suggested that praeruptorin B improves lipid accumulation in blood, liver and adipose tissues in DIO mice.3.5. Praeruptorin B improves glucose homeostasis and insulin resistance in DIO mice
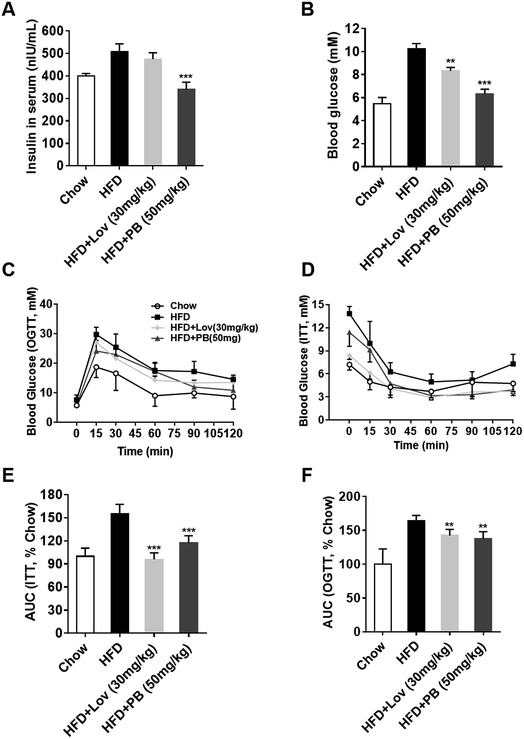
Since praeruptorin B decreases the lipid contents in blood, liver and adipose tissues, we next investigated whether praeruptorin B improves insulin resistance in vivo. The elevated fasting blood glucose and insulin in HFD-fed mice were significantly reduced by praeruptorin B. In contrast, lovatatin treatment only decreased blood glucose but did not affected serum insulin levels (Fig. 5A and B). Both praeruptorin B and lovastatin treatment dramatically improved glucose tolerance and insulin resistance (Fig. 5C–F). Collectively, these results demonstrated that praeruptorin B improves glucose tolerance and insulin resistance in HFD-fed mice.3.6. Praeruptorin B does not influence the basic energy metabolism in DIO mice
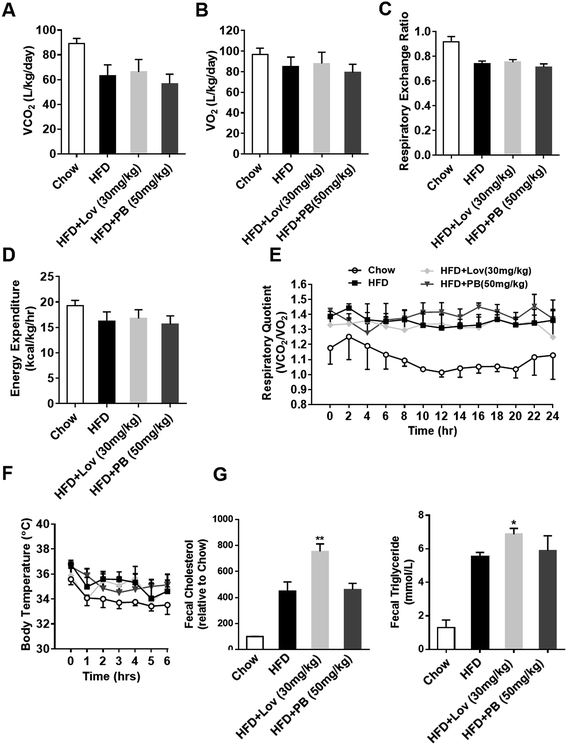
In order to further understand the effect of praeruptorin B on energy metabolism of DIO mice, the physical activity and energy expenditure were analyzed. The oxygen consumption, carbon dioxide evolution and total respiratory exchange ratio were not affected by praeruptorin B treatment (Fig. 6A–C). The energy expenditure and RQ of praeruptorin B treatment mice were still similar to HFD-fed mice (Fig. 6D and E). Meanwhile, no significant difference in the body temperature between praeruptorin B and vehicle treatmented mice was observed when they were exposed to cold environment (Fig. 6F). Lovastatin reduced the lipid absorption through increased fecal triglyceride and cholesterol (Fig. 6G), suggesting that lovastatin decreased lipid absorption or increased lipid excretion to antagonize DIO. However, this effect was not observed in the mice treated with praeruptorin B (Fig. 6G). These date suggested that praeruptorin B does not influence the basic energy metabolism in DIO mice.3.7. Praeruptorin B improves lipid and glucose homeostasis by regulating SREBP pathway
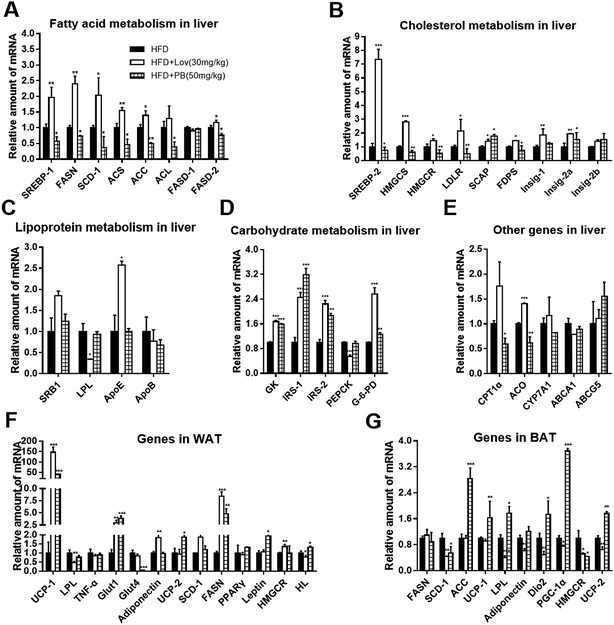
To explore the mechanistic involvement of SREBP in the effect reflected by praeruptorin B on HFD-fed mice, we determined expression of SREBP important downstream targeted genes and other related genes in liver and adipose tissues of mice. Our results showed the hepatic mRNA levels of genes involved in cholesterol biosynthesis including FDPS, Insig-2a, Insig-2b, SCAP, HMGCS and SREBP-2 were decreased in DIO mice treated with praeruptorin B (50 mg kg−1) (Fig. 7A). Consistent with in vitro results, praeruptorin B inhibited SREBP-1c expression and its related genes containing FASN, SCD-1, ACS, ACC, ACL and FASD-2 in mice livers (Fig. 7B). However, the mRNA expression of genes referring to lipoprotein metabolism was not affected by praeruptorin B (Fig. 7C). Futhermore, praeruptorin B increased mRNA levels of genes involving in carbohydrate metabolism such as GK, IRS-1/2 and G-6-PD, and decreased CPT1α and ACO mRNA levels (Fig. 7D–E). In white adipose tissues (WAT), praeruptorin B up-regulated mRNA expression of UCP-1/2, Glut1, FASN and Leptin, and down-regulated Glu4 expression. In BAT, praeruptorin B dramatically increased ACC, LPL, Dio2 and PGC-1α and decreased SCD-1, and HMGCR mRNA levels (Fig. 7F and G).Taken together, these findings indicated that praeruptorin B improves lipid accumulation and insulin sensitivity in HFD-fed obese mice on account of regulating SREBP-1 target genes and metabolism-related genes in liver and adipose tissues.
4. Discussion
SREBPs are major transcription factors that control the biosynthesis of cholesterol, fatty acid and triglyceride. In mammals, SREBP-1 primarily regulate fatty acid metabolism and SREBP-2 is the main regulator of cholesterol metabolism.30 Praeruptorin B is isolated from the dry roots of peucedanum praeruptorum. Several pharmacological activities have been reported, such as anti-heart failure,31 blocking osteoclast differentiation,32 anti-asthmatic airway inflammation32,33 and anti-cancer.34 However, biological activity of praeruptorin B has not been studied well before. In this report, we found praeruptorin B might inhibit the activity of SRE-Luciferase through a cell-based assay for SREBP pathway by previous compound screening. Interestingly, praeruptorin B hindered SREBP activation principally by decreasing SREBP protein and mRNA levels, which leads to the reduction of intracellular neutral lipids and cholesterol storage. SREBP-1a and SREBP-1c transcripts differs in their first exon (exon 1a and exon 1c) result in the different transcriptional activity. SREBP-1c is the predominant isoform which is expressed in most of the tissues such as livers, WAT and skeletal muscle in mice and humans. While SREBP-1a is highly expressed in cell lines and tissues such as spleen and intestine.35 Hence, we speculated that inhibiting SREBP-1c expression may be the main reason for hypolipidemic effect of praeruptorin B.Mounting evidence suggests that SREBP-1 and related lipogenic enzymes expression are regulated by insulin-mediated PI3K/Akt/mTORC1 signaling pathway for controlling lipid biosynthesis.36 Inactivation of PI3K decreases in Akt phosphorylation which lead to reduction of triglyceride and free fatty acid in blood and SREBP-1c expression, which requires the mammalian target of rapamycin complex1 (mTORC1) activation. Meanwhile, mTORC1 feedback inhibits insulin signal transduction,37–39 and its downstream p70S6K promotes SREBP-1c maturation, but has no effect on SREBP-1c transcript levels.40 Our study proved that praeruptorin B suppressed insulin-stimulated PI3K/Akt/mTORC1 signaling, and further inhibited p70S6K and SREBP-1 expression. Akt phosphorylation level was elevated by negative feedback regulation of mTORC1. Moreover, these results were further confirmed through signaling pathway activator, or overexpression of exogenous gene technology. In this study, we also investigated the effect of praeruptorin B on lipid metabolism in vivo based on HFD-induced obese mice model. Praeruptorin B reduced the body weight and fat ratio of HFD-fed mice without affecting their basal metabolism. TC and TG levels both in liver and serum were decreased, and abnormal lipid accumulation in different tissues and insulin resistance were alleviated by praeruptorin B. These results demonstrated that praeruptorin B might improve diet-induced obesity, hyperlipidemia and insulin sensibility. The mRNA expression of genes involved in cholesterol and fatty acid metabolism and the related pathways showed that praeruptorin B down-regulated the mRNA levels of SREBP-1/2 and its several target genes expression, which was in accordance with the data in vitro. Because there are three ester bonds in the structure of praeruptorin B, they are easily to be degraded especially in aqueous system. Therefore, we speculate that the substance, which exerts its biological activity in vivo, may not be praeruptorin B itself. For the present results, the mRNA expression of SREBPs and their target genes were reduced by praeruptorin B treatment in vivo, which is similar to the in vitro results. Those results demostrate that the three ester bonds and adjacent groups of praeruptorin B do not play a major role in inhibiting SREBP activity. We will examine whether praeruptorin B is degraded in vivo and whether its degradation products have an inhibitory effect on SREBP activity in the future study.
In mammals, white fat storage seems to provide the main fuel for sustaining thermogenesis via lipolysis,41 while BAT is the major place for facultative thermogenesis.42–45 Peroxisome proliferator activated receptor γ coactivator 1α (PGC1α) controls BAT-mediated thermogenesis by regulating the expression of UCP1. Our study revealed that praeruptorin B promoted the expression of genes related to brown adipocyte functions such as UCP1 and PGC1α which lead to browning process of WAT.46 Lipoprotein lipase (LPL) plays a crucial role in lipid metabolism and primarily accelerates proteolysis of triglyceride in very low density lipoproteins (VLDL) and chylomicrons. The higher expression of LPL genes in BAT by praeruptorin B compared with HFD group stated that praeruptorin B might promote fatty acid release, and subsequently stimulated UCP2 expression.
In conclusion, our study suggests that praeruptorin B ameliorates obesity, insulin resistance, fatty accumulation in liver and hyperlipemia without serious adverse reactions. Thus, praeruptorin B can serve as a leading compound for pharmacological control of metabolic diseases.
Conflicts of interest
There is a pending patent application of praeruptorin B for the treatment of metabolic diseases.Abbreviations
| ABCA1 | ATP-binding cassette transporter 1 |
| ACC | Acetyl-CoA carboxylase |
| ACO | Acyl-CoA oxidase |
| AKT | Protein kinase B |
| AMPK | AMP-activated protein kinase |
| ApoB | Apolipoprotein B |
| ApoE | Apolipoprotein E |
| BAT | Brown adipose tissue |
| CPT1 | Carntine palmitoyltransferase 1 |
| CYP7A1 | Cholesterol α-hydroxylase |
| Dio2 | Type 2 iodothyronine deiodinase |
| FASN | Fatty acid synthase |
| FDPS | Farnesyl diphosphate synthase |
| G-6-PD | Glucose-6-phosphate dehydrogenase |
| GK | Glucokinase |
| Glut1 | Glucose transporter 1 |
| Glut4 | Glucose transporter 4 |
| GSK3β | Glycogen synthase kinase 3 beta |
| HFD | High fat diet |
| HMGCR | 3-Hydroxy-3-methylglutary-CoA reductase |
| HMGCS | 3-Hydroxy-3-methylglutary-CoA synthase |
| HL | Hepatic lipase |
| Insig | Insulin induced gene |
| IRS | Insulin receptor substrate |
| LDL-c | Serum low-density cholesterol |
| LDLR | Low density lipoprotein receptor |
| LPDS | Lipoprotein deficient serum |
| LPL | Lipoprotein lipase |
| LXR | Liver X receptor |
| mTOR | Mammalian target of rapamycin |
| p70s6k | p70 ribosomal protein S6 kinase |
| PEPCK | Phosphoenolpyruvate carboxkinase |
| PGC-1α | PPARγ-coactivator-1α |
| PPARγ | Peroxisome proliferator-activated receptor γ |
| RQ | Respiratory quotient |
| SCAP | SREBP cleavage activated protein |
| SCD | Stearoyl-CoA desaturase |
| SREBPs | Sterol regulatory element-binding proteins |
| SR-BI | Scavenger receptor class B member 1 |
| TC | Total cholesterol |
| TG | Triglyceride |
| TNF-α | Tumor necrosis factor α |
| UCP | Uncoupling protein |
Acknowledgements
This work was supported by the Chinese National Science Foundation (81274159, 81573562, 81322051, and 8107300), the Nature Science Foundation of Jiangsu Province (BK 20151442), the Priority Academic Program Development of Jiangsu Higher Education Institutions (PAPD), and New Century Excellent Talents in University (NCET-12-0976). The authors acknowledge technical support from Ms Ping Zhou for cell culture and Ms Xin Dong for GC-MS analysis.References
- M. Aguilar, T. Bhuket, S. Torres, B. Liu and R. J. Wong, JAMA, 2015, 313, 1973–1974 CrossRef CAS PubMed.
- M. C. Carr and J. D. Brunzell, J. Clin. Endocrinol. Metab., 2004, 89, 2601–2607 CrossRef CAS PubMed.
- J. Kaur, Cardiol. Res. Pract., 2014, 2014, 943162 Search PubMed.
- M. E. Dumas, J. Kinross and J. K. Nicholson, Gastroenterology, 2014, 146, 46–62 CrossRef PubMed.
- L. Zhang, C. Virgous and H. Si, J. Nutr. Biochem., 2016, 44, 1–10 CrossRef PubMed.
- D. Eberle, B. Hegarty, P. Bossard, P. Ferre and F. Foufelle, Biochimie, 2004, 86, 839–848 CrossRef CAS PubMed.
- S. M. Soyal, C. Nofziger, S. Dossena, M. Paulmichl and W. Patsch, Trends Pharmacol. Sci., 2015, 36, 406–416 CrossRef CAS PubMed.
- P. Ferre and F. Foufelle, Horm. Res., 2007, 68, 72–82 CAS.
- T. I. Jeon and T. F. Osborne, Trends Endocrinol. Metab., 2012, 23, 65–72 CrossRef CAS PubMed.
- J. Han, E. Li, L. Chen, Y. Zhang, F. Wei, J. Liu, H. Deng and Y. Wang, Nature, 2015, 524, 243–246 CrossRef CAS PubMed.
- T. F. Osborne and P. J. Espenshade, Genes Dev., 2009, 23, 2578–2591 CrossRef CAS PubMed.
- W. Shao and P. J. Espenshade, Cell Metab., 2012, 16, 414–419 CrossRef CAS PubMed.
- D. E. Moller, Nature, 2001, 414, 821–827 CrossRef CAS PubMed.
- R. P. Naoumova and D. J. Betteridge, Lancet, 2002, 359, 2215–2216 CrossRef.
- Y. L. Song, W. H. Jing, R. Yan and Y. T. Wang, Pak. J. Pharm. Sci., 2015, 28, 71–81 CAS.
- M. Takata, T. Okuyama and S. Shibata, Planta Med., 1988, 54, 323–327 CrossRef CAS PubMed.
- I. Sakakibara, T. Okuyama and S. Shibata, Planta Med., 1982, 44, 199–203 CrossRef CAS PubMed.
- T. Okuyama and S. Shibata, Planta Med., 1981, 42, 89–96 CrossRef CAS PubMed.
- Y. L. Song, W. H. Jing, Y. G. Chen, Y. F. Yuan, R. Yan and Y. T. Wang, J. Pharm. Biomed. Anal., 2014, 93, 86–94 CrossRef CAS PubMed.
- J. J. Tang, J. G. Li, W. Qi, W. W. Qiu, P. S. Li, B. L. Li and B. L. Song, Cell Metab., 2011, 13, 44–56 CrossRef CAS PubMed.
- Z. G. Zheng, Y. P. Zhou, X. Zhang, P. M. Thu, Z. S. Xie, C. Lu, T. Pang, B. Xue, D. Q. Xu, Y. Chen, X. W. Chen, H. J. Li and X. Xu, Biochem. Pharmacol., 2016, 122, 42–61 CrossRef CAS PubMed.
- D. Xu, Z. Wang, Y. Zhang, W. Jiang, Y. Pan, B. L. Song and Y. Chen, Nat. Commun., 2015, 6, 8100 CrossRef CAS PubMed.
- C. M. Adams, J. Reitz, J. K. De Brabander, J. D. Feramisco, L. Li, M. S. Brown and J. L. Goldstein, J. Biol. Chem., 2004, 279, 52772–52780 CrossRef CAS PubMed.
- L. P. Sun, J. Seemann, J. L. Goldstein and M. S. Brown, Proc. Natl. Acad. Sci. U. S. A., 2007, 104, 6519–6526 CrossRef CAS PubMed.
- N. Dif, V. Euthine, E. Gonnet, M. Laville, H. Vidal and E. Lefai, Biochem. J., 2006, 400, 179–188 CrossRef CAS PubMed.
- D. Azzout-Marniche, D. Becard, C. Guichard, M. Foretz, P. Ferre and F. Foufelle, Biochem. J., 2000, 350(2), 389–393 CrossRef CAS PubMed.
- J. R. Krycer, L. J. Sharpe, W. Luu and A. J. Brown, Trends Endocrinol. Metab., 2010, 21, 268–276 CrossRef CAS PubMed.
- T. Porstmann, C. R. Santos, B. Griffiths, M. Cully, M. Wu, S. Leevers, J. R. Griffiths, Y. L. Chung and A. Schulze, Cell Metab., 2008, 8, 224–236 CrossRef CAS PubMed.
- S. Sato, N. Fujita and T. Tsuruo, Proc. Natl. Acad. Sci. U. S. A., 2000, 97, 10832–10837 CrossRef CAS PubMed.
- J. D. Horton, J. L. Goldstein and M. S. Brown, J. Clin. Invest., 2002, 109, 1125–1131 CrossRef CAS PubMed.
- C. Wang, T. H. Chang, X. H. Zhang and H. L. Wang, Acta Pharmacol. Sin., 2004, 25, 35–40 Search PubMed.
- J. T. Yeon, K. J. Kim, S. W. Choi, S. H. Moon, Y. S. Park, B. J. Ryu, J. Oh, M. S. Kim, M. Erkhembaatar, Y. J. Son and S. H. Kim, PLoS One, 2014, 9, e88974 Search PubMed.
- P. J. Yu, H. Jin, J. Y. Zhang, G. F. Wang, J. R. Li, Z. G. Zhu, Y. X. Tian, S. Y. Wu, W. Xu, J. J. Zhang and S. G. Wu, Inflammation, 2012, 35, 967–977 CrossRef CAS PubMed.
- T. G. Liang, W. Y. Yue and Q. S. Li, Molecules, 2010, 15, 8060–8071 CrossRef CAS PubMed.
- I. Shimomura, H. Shimano, J. D. Horton, J. L. Goldstein and M. S. Brown, J. Clin. Invest., 1997, 99, 838–845 CrossRef CAS PubMed.
- K. Miyake, W. Ogawa, M. Matsumoto, T. Nakamura, H. Sakaue and M. Kasuga, J. Clin. Invest., 2002, 110, 1483–1491 CrossRef CAS PubMed.
- K. Duvel, J. L. Yecies, S. Menon, P. Raman, A. I. Lipovsky, A. L. Souza, E. Triantafellow, Q. C. Ma, R. Gorski, S. Cleaver, M. G. V. Heiden, J. P. MacKeigan, P. M. Finan, C. B. Clish, L. O. Murphy and B. D. Manning, Mol. Cell, 2010, 39, 171–183 CrossRef PubMed.
- S. J. Li, M. S. Brown and J. L. Goldstein, Proc. Natl. Acad. Sci. U. S. A., 2010, 107, 3441–3446 CrossRef CAS PubMed.
- M. Amemiya-Kudo, H. Shimano, T. Yoshikawa, N. Yahagi, A. H. Hasty, H. Okazaki, Y. Tamura, F. Shionoiri, Y. Iizuka, K. Ohashi, J. Osuga, K. Harada, T. Gotoda, R. Sato, S. Kimura, S. Ishibashi and N. Yamada, J. Biol. Chem., 2000, 275, 31078–31085 CrossRef CAS PubMed.
- J. L. Owen, Y. Y. Zhang, S. H. Bae, M. S. Farooqi, G. S. Liang, R. E. Hammer, J. L. Goldstein and M. S. Brown, Proc. Natl. Acad. Sci. U. S. A., 2012, 109, 16184–16189 CrossRef CAS PubMed.
- K. Chechi, W. D. van Marken Lichtenbelt and D. Richard, J. Appl. Physiol., 2017 DOI:10.1152/japplphysiol.00021.2017.
- R. Oelkrug, E. T. Polymeropoulos and M. Jastroch, J. Comp. Physiol., B, 2015, 185, 587–606 CrossRef CAS PubMed.
- J. E. Silva, Physiol. Rev., 2006, 86, 435–464 CrossRef CAS PubMed.
- J. Nedergaard, T. Bengtsson and B. Cannon, Am. J. Physiol.: Endocrinol. Metab., 2007, 293, E444–E452 CrossRef CAS PubMed.
- C. Contreras, F. Gonzalez, J. Ferno, C. Dieguez, K. Rahmouni, R. Nogueiras and M. Lopez, Ann. Med., 2015, 47, 150–168 CrossRef CAS PubMed.
- K. A. Lo and L. Sun, Biosci. Rep., 2013, 33, 711–719 CrossRef CAS PubMed.
| This journal is © The Royal Society of Chemistry 2018 |

