 Open Access Article
Creative Commons Attribution 3.0 Unported Licence
Pressure-driven supercritical CO2 transport through a silica nanochannel†
Bing Liu *,
Xiaoqi Li,
Chao Qi,
Tingyi Mai,
Kaiyun Zhan*,
Li Zhao and
Yue Shen
School of Science, China University of Petroleum, Qingdao 266580, Shandong, China. E-mail: liubing19720115@gmail.com; zhanky@upc.edu.cn
First published on 4th January 2018
Abstract
A thorough understanding of supercritical CO2 (scCO2) transport through nanochannels is of prime significance for the effective exploitation of shale resources and the mitigation of greenhouse gas emission. In this work, we employed the non-equilibrium molecular dynamics simulations method to investigate the pressure-driven scCO2 transport behavior through silica nanochannels with different external forces and pore sizes. The simulations reveal that the capability of scCO2 diffusion enhances both in the bulk region and the surface adsorbed layer with the increasing of pressure gradient or nanochannel size, in addition, the slip length increases nonlinearly with the external acceleration or nanochannel width increases and finally reaches a maximum value. The negative slippage occurs at lower pressure gradient or within the narrower nanochannel. Overall, it is the combined effect of strong adsorption, surface diffusion and slippage that causes the nonlinear relation between flow rate and pressure gradient or nanochannel size. The present work would provide theoretical guidance for the scCO2 enhanced shale oil/gas recovery, CO2 storage, and mass transport in nanoporous materials.
1. Introduction
Recently, the behaviors of supercritical CO2 (scCO2) in narrow pores and confined spaces have attracted extensive attention in the exploration and development of hydrocarbons stored in shale,1,2 such as scCO2 fracturing3,4 and injecting.5,6 On the other hand, CO2 injection into tight shales is one of the promising solutions for mitigating carbon emissions7,8 and global warming.9,10 The nanopores are widely present in shale reservoirs.11–14 The basis for scCO2 geosequestration15,16 and enhanced hydrocarbon recovery depends on its unique transport properties induced by the confinement of shale nanopores. The evaluation of scCO2 enhancing hydrocarbon recovery, enhancement of fracturing efficiency, and estimation of storage capacity require understanding of microscopic behaviors of scCO2 through shale nanopores, such as adsorption, diffusion and flow.Confined fluids in nanopores demonstrate microstructural, dynamical and thermophysical behavior that differ significantly from their bulk counterparts due to the molecular asymmetry between fluid–fluid and solid–fluid interactions.17 This asymmetry leads to inhomogeneous local fluid density distributions, where the superimposition of the attractive potentials from two walls induces confined environments.18 Extensive molecular simulation studies were reported on CO2 sorption in the graphite slit-pores18–24 usually treated as the organic matrix of shale reservoirs. In addition, several molecular simulations were addressed on the adsorption structure of CO2 confined in clay-like25,26 and silica17,27 slit pores. The results revealed that the nanopore size dramatically influences the adsorption structure of CO2, which would has potentially significant effects on the transport properties of CO2 inside the nanopore.28 The diffusion of confined CO2 obviously weakens as compared with that in bulk fluid25,27 and CO2 diffusion coefficient reduces with the decrease in the pore size.25 The diffusion and migration of CO2 in silica nanopore occur predominantly along the surface due to hydrogen bonds formed between CO2 and the surface –OH group.27,29 Besides, the widely developed nanopores and ultra-low permeability in shale reservoirs raise concerns on the applicability of Darcy's law to account for mass transport in shale. However, it breaks down for flow through very narrow pores because the continuum flow hypothesis is invalid.23,28 Efforts have been made to moderate for the breakdown of Darcy's law via gas slippage theory,23 for example, the Klinkenberg effect.30,31 Such empirical corrections can not capture the complex adsorption and transport behavior of the fluid in ultra-confining porous materials.32 Falk et al. demonstrated that the non-Darcy behavior results from strong adsorption in kerogen and the breakdown of hydrodynamics at the nanoscale.32 Monteiro et al. suggested a hydrodynamic model of gas flow in nanoporous media by introducing a pressure gradient-dependent permeability of kerogen, which obeys power function relationship.33 Wang et al. reported the pressure-driven flow behavior of scCO2 confined in shale organic nanopores.24 They observed that the streaming velocity profile tends to a plug flow and the magnitude far exceeds the prediction of the no-slip Poiseuille equation. Firouzi and Wilcox investigated the gas slippage and Klinkenberg effects of CO2 confined in carbon slit pores.23 They reported a plug flow occurs at pore size less than 2 nm, a parabolic velocity profile at pore size larger than 10 nm, and the dramatic underestimation of the CO2 permeability using the bulk phase viscosity. In summary, the transport of scCO2 in inorganic nanochannel remains unclear, and there is a strong need for a reliable theoretical framework of scCO2 transport inside nanoporous matrix due to the constraint of the lowest permeability in the fluid path to the overall permeability of the shale.
Herein, non-equilibrium molecular dynamics (NEMD) simulations were conducted to investigate the pressure-driven scCO2 transport through the silica nanochannel. The effects of flow driving pressure gradient and nanochannel size on scCO2 transport were determined by exploring the adsorption, diffusion and flow of scCO2 molecules. The density profiles and residence autocorrelation functions were employed to describe adsorption. The velocity profiles, the slippage effect, and the flow rate as the function of pressure gradients or nanochannel sizes were applied to characterize the flow behavior.
2. Models and methodology
The nanochannel with the size of 71.60 × 50.12 × H Å3 was formed by two 10.5 Å cristobalite plates. H denoted the interlayer space of two plates providing the nanochannel for scCO2 transport. The silica nanochannels with hydroxylated surfaces34 were fixed in all simulations. Periodic boundary conditions were applied in three dimensions. To obtain saturated adsorption of scCO2 in nanochannels under 373.15 K and 35 MPa, equilibrium molecular dynamics (EMD) simulations were carried out for 2 ns to get the isothermal adsorption curve35 (ESI Fig. S1†). The initial model was shown in Fig. 1(a).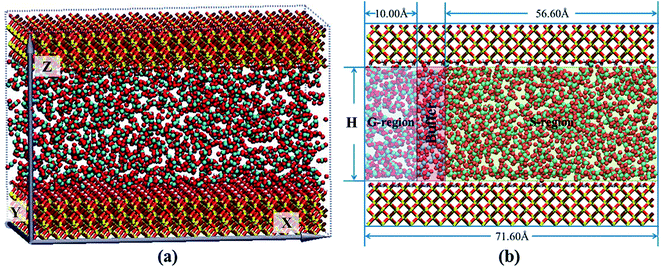 | ||
| Fig. 1 The MD simulation model: (a) snapshot of simulation model. (b) Schematic images of different region distribution. | ||
As applying an acceleration or a force on all atoms directly24,36–38 was improper to simulate desorption from surfaces, the whole nanochannel was divided into three segments along X dimension, named G-region, Buffer and S-region, respectively, as shown in Fig. 1(b). A driving pressure gradient was exerted on the system by applying an acceleration along X direction on scCO2 molecules in G-region in order to generate the Poiseuille flow through the nanochannel. A bigger acceleration corresponds to a greater pressure gradient. The effect of pressure gradient on transport behavior was examined by altering the acceleration ranged from 0.001 to 0.05 kcal (Å−1 g−1) as H is 28.50 Å. The effect of nanochannel sizes on transport behavior was studied by altering H from 7.25 to 50.00 Å as the acceleration is 0.01 kcal (Å−1 g−1). All calculations were executed in S-region. The NEMD simulations were performed to simulate mass transport for 6 ns which is enough to obtain a steady scCO2 flow.
Both the EMD and NEMD simulations were performed using large-scale atomic/molecular massively parallel simulator (LAMMPS)39 software in the NVT ensemble with a time step of 1 fs. Visualization of the dynamics process was carried out using the program VMD.40 The Nosé–Hoover41,42 thermostat was employed to control the temperature. The silica nanochannel was modeled with the CLAYFF43 force field. CO2 molecules were described by the three-site EPM2 (ref. 44) model which was successfully demonstrated to reproduce critical point of CO2 in experiment. All the VDW interactions were described by the 12–6 Lennard-Jones potential. The cutoff of non-bonded interaction was set to be 9.5 Å. Long-range electrostatic interaction was calculated by PPPM45 summation method with the accuracy of 0.0001e. The interaction between different types of atoms was determined by the Lorentz–Berthelot rule: and σij = (σi + σj)/2. All parameters were given in the ESI Table S1.†
3. Results and discussions
3.1 Effect of pressure gradient
In order to quantify the residence time of scCO2 molecules remaining near the nanochannel surface, residence autocorrelation function, CR(t), was calculated by:48–50
 | (1) |
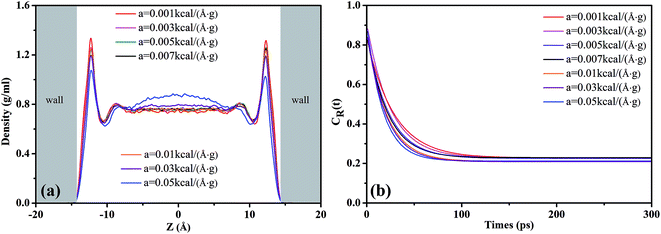
The CR(t) for scCO2 at the different pressure gradients is shown in Fig. 2(b). CR(t) decreases faster as pressure gradient increases, implying a shorter residence time of scCO2 in the adsorption layer at bigger pressure gradients. The high pressure gradients could facilitate the fluid mobility and enhance the occurrence of molecular collisions, and then driving the adsorbed scCO2 molecules away from the surface. The CR(t) plateaus occurs after about 120 ps, indicating that some of the adsorbed scCO2 molecules are not desorbed within the simulation time because of the electrostatic interaction and the hydrogen bond between scCO2 and the surface.51 These scCO2 molecules that can not be desorbed from the surfaces will reduce the scCO2 flow in shale reservoirs but benefit the CO2 sequestration.
 | (2) |
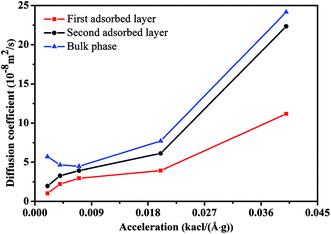
Fig. 3 illustrates the diffusion coefficients of scCO2 at different pressure gradients and areas in the nanochannel. As pressure gradient increases, the diffusion coefficient of scCO2 in the adsorption layers increases while it decreases firstly and then rises for bulk scCO2. The variation of diffusion coefficients of scCO2 under lower pressure gradients was mainly affected by the variation in the density distribution. As shown in Fig. 2(a), the density near the surface reduces with the increasing pressure gradient as the acceleration is less than 0.007 kcal (Å−1 g−1). This indicates that the partial pressure in adsorbed layers decreases, leading to the increase of scCO2 diffusion coefficient. The increasing density of bulk scCO2 indicates the enhancement of the partial pressure in the central area of nanochannel, resulting in the decrease of scCO2 diffusion coefficient. In this case, the density distribution plays the dominant role in the diffusibility of scCO2 within the nanochannel. As the acceleration is greater than 0.007 kcal (Å−1 g−1), the largely undermined adsorption strength with increasing pressure gradient indicates the increase of the scCO2 velocity within the nanochannel. The raising velocity may lead to the decrease of scCO2 pressure, which induces the increase of the diffusion coefficient. Herein, the increasing velocity plays the pivotal role in scCO2 diffusibility inside the nanochannel. As indicated from the Stokes–Einstein relation, the increase in the diffusion coefficient implies the decrease in the viscosity. Therefore, we conclude that such changes could affect the flow of scCO2 within the nanochannel.
| v(z) = az2 + bz + c | (3) |
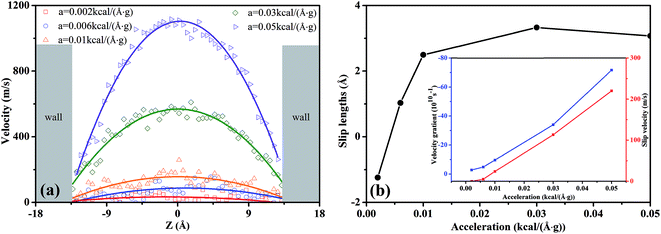 | ||
| Fig. 4 (a) The effects of external acceleration on the velocity profiles of scCO2 molecular in nanochannel. (b) Slip length as a function of the external acceleration for scCO2 molecular. | ||
In Fig. 4(a), the velocity profiles with the parabolic shape24,36,38 are symmetrical about the central axis of the nanochannel. The larger pressure gradients induce the greater axial velocities and sharper parabolic velocity curves. Moreover, we notice that there are non-zero velocities near the surfaces, which leads to the slippage phenomenon. The slip velocity increases as the pressure gradient increases. Here, we employed the slip length Ls to describe the slippage phenomenon, as defined by52
 | (4) |
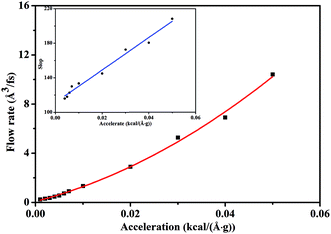
Fig. 5 depicts the scCO2 flow rate as a function of pressure gradient, revealing a nonlinear relationship different from Darcy's law where permeability is defined as a material property of the rock. This indicates that Darcy's law dramatically fails to describe scCO2 transport in nanochannel. Form the analysis of Fig. 2 and 3 mentioned above, we conclude that the permeability increases and the viscosity decreases as pressure gradient increases. Hence, the ratio of the permeability to the viscosity, i.e., mobility, increases with the increasing of pressure gradient, characterizing the seepage capacity of scCO2 in nanochannel. It is observed that the mobility is linearly related to pressure gradient shown by the inset in Fig. 5. This corresponds to the hydrodynamic model of gas flow in nanoporous media where permeability is power function of pressure gradient.33
3.2 Effect of nanochannel width
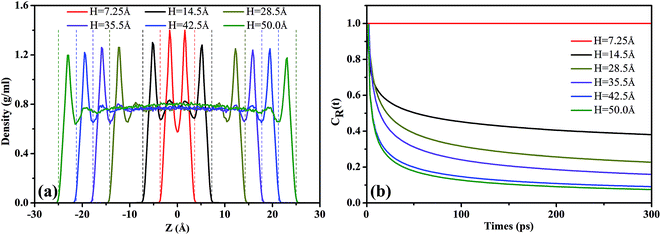
Fig. 6(b) shows the residence autocorrelation functions, CR(t), as a function of the residence time of scCO2 molecules remaining near the surface. As H increases, CR(t) decays fast, implying the shorter time that scCO2 remains in the absorbed layer. As H increases, the overlapping attractive potentials from two surfaces gradually separate from each other and finally form two single potential systems near the surfaces. This weakens the interaction between scCO2 and the surfaces resulting in the shorter residence time of scCO2 on the surface, and also implies a more frequent exchange of scCO2 appeared between the adsorption layer and bulk phase in the center of nanochannel inside the wider nanochannel. For H = 7.25 Å, CR(t) always equals to one indicating that all scCO2 molecules reside in the adsorption layer. As H further increases from 14.5 Å to 50.0 Å, CR(t) plateaus appears after about 120 ps indicating that a part of scCO2 molecules always reside near the surface within the simulation time. Value of CR(t) plateaus decrease as H increases, also showing the stronger adsorption for narrower nanochannels. As H ranges from 35.5 Å to 50.0 Å, CR(t) curves are basically coincident, suggesting that scCO2 adsorption is independent of H larger than 35.5 Å. This is mainly due to that attractive potentials from two surfaces have been effectively divided into two single potential systems near the channel surface. The results also demonstrate that the narrower nanochannel storages CO2 more securely while the wider nanochannel favors scCO2 transport.
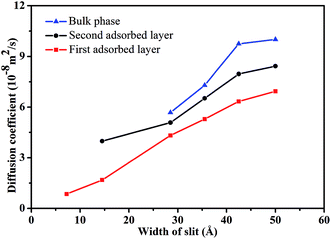 | ||
| Fig. 7 The diffusion coefficient of scCO2 molecular in different adsorbed layers behind various width of nanochannel. | ||
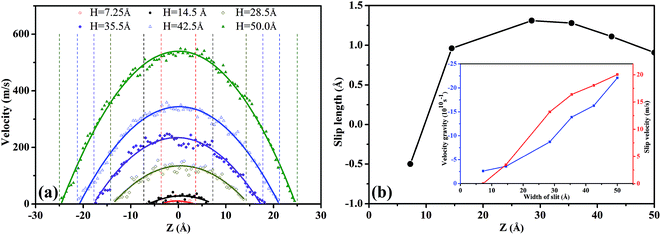
In Fig. 8(a), the scCO2 velocity profiles exhibit a parabolic shape and are symmetrical about the central axis of the nanochannel. Moreover, as H increases, the velocity curve becomes sharper and the axial velocity of scCO2 increased. This is caused by the intensive constraint on the scCO2 molecules near the surface in the smaller nanochannel, as shown in Fig. 6. However, the bulk scCO2 in the central area of the wider nanochannel are rare constrained.
In Fig. 8(b), the slip length exhibits non-monotonous increase with a maximum value as H increases. For 7.25 Å < H < 14.5 Å, the slip velocity increases fast while the velocity gradient increment is small as H expands, as indicated by the inset in Fig. 8(b). Then the ratio of the slip velocity to the velocity gradient, i.e., slip length, increases rapidly. For 14.5 Å < H < 28.5 Å, both the slip velocity and the velocity gradient increase rapidly. Ratio of slip velocity to velocity gradient enhances gradually and reaches the maximum value as H = 28.5 Å. Therefore, the slip length increases slowly and its maximum value occurs. For 35.5 Å < H < 50.0 Å, the increase of the slip velocity becomes slower while the velocity gradient increase rapidly. The ratio of them weakens gradually. Consequently, the slip length decreases slowly.
Fig. 8(b) also shows a negative slip length54–57 occurring at H less than about 10.0 Å. In this case, the overlapping between attractive potentials from the surfaces is so strong that a part of scCO2 molecules stick on the surfaces. The external pressure gradient cannot completely overcome the attractive interactions between scCO2 and the surface. This leads to the zero velocity near the surfaces, indicated the presence of scCO2 in boundary layer.
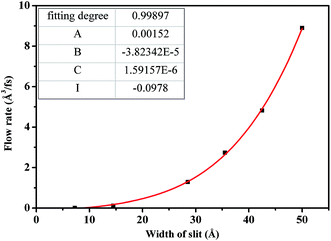
Fig. 9 describes the dependence of flow rate on H. As H is less than 30.0 Å, flow rate increases slowly due to the strong constraint on scCO2 molecules from the superimposition of attractive potentials of two surfaces. The attractive potential from the surface has a significant effect on scCO2 transport through nanochannel. As H is larger than 30.0 Å, flow rate increases rapidly because of the less constraint on scCO2 molecules where attractive potentials from two surfaces separate completely. Here, the attractive potential from the surface has little effect on the transport of scCO2 in nanochannel. Therefore, nanochannels with H less than 30.0 Å contribute to CO2 storage in shale. To quantitatively describe the dependence of the flow rate on H, the relationship between them was obtained by fitting data applying the power function polynomial
| Q = AH2 + BH3 + CH4 + I | (5) |
The fitting parameters were shown by the inset in Fig. 9. Compared to the continuum flow with slip effect,52 the fourth power of H appears in the fitted formula. This could be mainly due to the fact that both the viscosity and the slip length of scCO2 in nanochannel relate to H, as indicated in Fig. 7 and 8(b).
4. Conclusions
NEMD simulations were employed to study the scCO2 transport behavior within the silica nanochannel in shale. The influences of flow driving pressure gradient and nanochannel size were systematically investigated. These effects were understood by exploring density distribution of scCO2 molecules, residence time of scCO2 in the first adsorption layer, the diffusion coefficient, the velocity profile, the slippage effect, and the flow rate.Our simulations reveal that the structuring adsorption layers of scCO2 molecules occur within the silica nanochannel yet under the driving of pressure gradient. As either pressure gradient or nanochannel width increases, the peaks of scCO2 density profiles decrease and the density of the bulk phase increases. The higher pressure gradients result in the larger shear force, which leads to desorbing scCO2 molecules near the nanochannel surfaces. The wider nanochannel leads to the weaker overlapping of the attractive potentials from the two surfaces, attenuating the adsorption of scCO2 molecules near the surfaces. The higher pressure gradients and the wider nanochannel can promote scCO2 diffusibility for both bulk region and the adsorption layers near the surfaces. The improvement of scCO2 diffusion ability may be mainly determined by the decrease of partial pressure near the surfaces, the increase of velocity of the central area in the nanochannel, and the surface diffusion of scCO2 hopping from one site to another. The increased diffusion ability also indicates the reduction in scCO2 viscosity. The negative slippage occurs at lower pressure gradients or within the narrower nanochannel is mainly due to the stronger adsorption of scCO2 molecules near the surfaces. The slip length exhibits non-monotonic increase and existence of a maximum value with the increase in the pressure gradient or the nanochannel size. The flow rate of scCO2 through the nanochannel shows a nonlinear characteristic with pressure gradient or nanochannel size. It is also found that the mobility is proportional to the pressure gradient. This implies the breakdown of Darcy's law at nanoscale because of the strong adsorption effect, surface diffusion and slippage effect.
Associated content
Additional simulation results to determine the initial state of scCO2 in channel, parameters of force field and a part of fitting parameters are described in the text.Conflicts of interest
There are no conflicts to declare.Acknowledgements
This work is financially supported by PetroChina Innovation Foundation (2017D-5007-0206) and National Basic Research Program of China (2014CB239204) and the Fundamental Research Funds for the Central Universities (15CX08003A 16CX02052A) and Natural Science Foundation of China (NSFC) (61605251).References
- H. Wang, G. Li and Z. Shen, Energy Sources, Part A, 2012, 34, 1426–1435 CrossRef CAS.
- Y. Li, H. Nie and P. Long, Nat. Gas Ind., 2009, 12, 40 CAS.
- R. S. Middleton, J. W. Carey, R. P. Currier, J. D. Hyman, Q. Kang, S. Karra, J. Jiménez-Martínez, M. L. Porter and H. S. Viswanathan, Appl. Energy, 2015, 147, 500–509 CrossRef CAS.
- K. Edlmann, S. Haszeldine and C. McDermott, Environ. Earth Sci., 2013, 70, 3393–3409 CrossRef CAS.
- C. Doughty and K. Pruess, Vadose Zone J., 2004, 3, 837–847 CrossRef CAS.
- S. A. Hosseini, S. A. Mathias and F. Javadpour, Transp. Porous Media, 2012, 94, 795–815 CrossRef CAS.
- G. R. Van der Werf, D. C. Morton, R. S. DeFries, J. G. Olivier, P. S. Kasibhatla, R. B. Jackson, G. J. Collatz and J. T. Randerson, Nat. Geosci., 2009, 2, 737–738 CrossRef CAS.
- K. Paustian, O. Andrén, H. H. Janzen, R. Lal, P. Smith, G. Tian, H. Tiessen, M. v. Noordwijk and P. L. Woomer, Soil Use Manage., 1997, 13, 230–244 CrossRef.
- J. Gibbins and H. Chalmers, Energy Policy, 2008, 36, 4317–4322 CrossRef.
- W. D. Nordhaus, Econ. J, 1991, 101, 920–937 CrossRef.
- R. W. Howarth, R. Santoro and A. Ingraffea, Clim. Change, 2011, 106, 679 CrossRef CAS.
- J. D. Walls and S. Sinclair, First Break, 2011, 29, 97–101 Search PubMed.
- A. H. Kohli and M. D. Zoback, J. Geophys. Res.: Solid Earth, 2013, 118, 5109–5125 CrossRef.
- C. R. Clarkson, N. Solano, R. Bustin, A. Bustin, G. Chalmers, L. He, Y. B. Melnichenko, A. Radliński and T. P. Blach, Fuel, 2013, 103, 606–616 CrossRef CAS.
- M. G. Little and R. B. Jackson, Environ. Sci. Technol., 2010, 44, 9225–9232 CrossRef CAS PubMed.
- R. Leuning, D. Etheridge, A. Luhar and B. Dunse, Int. J. Greenhouse Gas Control, 2008, 2, 401–414 CrossRef CAS.
- A. A. Chialvo, L. Vlcek and D. R. Cole, J. Phys. Chem. C, 2012, 116, 13904–13916 CAS.
- H. Wu, J. Chen and H. Liu, J. Phys. Chem. C, 2015, 119, 13652–13657 CAS.
- S. Bhatia, K. Tran, T. Nguyen and D. Nicholson, Langmuir, 2004, 20, 9612–9620 CrossRef CAS PubMed.
- S. Samios, A. Stubos, N. Kanellopoulos, R. Cracknell, G. Papadopoulos and D. Nicholson, Langmuir, 1997, 13, 2795–2802 CrossRef CAS.
- A. Vishnyakov, P. I. Ravikovitch and A. V. Neimark, Langmuir, 1999, 15, 8736–8742 CrossRef CAS.
- L. Liu and S. K. Bhatia, J. Phys. Chem. C, 2013, 117, 13479–13491 CAS.
- M. Firouzi and J. Wilcox, J. Chem. Phys., 2013, 138, 064705 CrossRef PubMed.
- S. Wang, F. Javadpour and Q. Feng, Fuel, 2016, 181, 741–758 CrossRef CAS.
- X. Yang and C. Zhang, Chem. Phys. Lett., 2005, 407, 427–432 CrossRef CAS.
- Z. Jin and A. Firoozabadi, Fluid Phase Equilib., 2013, 360, 456–465 CrossRef CAS.
- T. Le, A. Striolo and D. R. Cole, J. Phys. Chem. C, 2015, 119, 15274–15284 CAS.
- C. Duan, F. Zhou, K. Jiang and T. Yu, Int. J. Heat Mass Transfer, 2015, 91, 1088–1100 CrossRef CAS.
- B. Liu, C. Wang, J. Zhang, S. Xiao, Z. Zhang, Y. Shen, B. Sun and J. He, Energy Fuels, 2017, 31, 738–746 CrossRef CAS.
- C. R. Clarkson, M. Nobakht, D. Kaviani and T. Ertekin, SPE J., 2012, 17, 230–242 CrossRef CAS.
- S. Sinha, E. Braun, M. Determan, Q. Passey, S. Leonardi, J. Boros, A. Wood Iii, T. Zirkle and R. Kudva, Steady-State Permeability Measurements on Intact Shale Samples at Reservoir Conditions – Effect of Stress, Temperature, Pressure, and Type of Gas, 2013, DOI:10.2118/164263-MS.
- K. Falk, B. Coasne, R. Pellenq, F.-J. Ulm and L. Bocquet, Nat. Commun., 2015, 6, 6949 CrossRef CAS PubMed.
- P. J. Monteiro, C. H. Rycroft and G. I. Barenblatt, Proc. Natl. Acad. Sci., 2012, 109, 20309–20313 CrossRef CAS PubMed.
- E. R. Cruz-Chu, A. Aksimentiev and K. Schulten, J. Phys. Chem. B, 2006, 110, 21497–21508 CrossRef CAS PubMed.
- M. Kazemi and A. Takbiri-Borujeni, Energy Fuels, 2016, 30, 8156–8163 CrossRef CAS.
- A. Botan, V. Marry, B. Rotenberg, P. Turq and B. Noetinger, J. Phys. Chem. C, 2013, 117, 978–985 CAS.
- B. Liu, R. Wu, J. A. Baimova, H. Wu, A. W.-K. Law, S. V. Dmitriev and K. Zhou, Phys. Chem. Chem. Phys., 2016, 18, 1886–1896 RSC.
- S. Wang, F. Javadpour and Q. Feng, Fuel, 2016, 171, 74–86 CrossRef CAS.
- S. Plimpton, J. Comput. Phys., 1995, 117, 1–19 CrossRef CAS.
- W. Humphrey, A. Dalke and K. Schulten, J. Mol. Graphics, 1996, 14, 33–38 CrossRef CAS PubMed.
- G. J. Martyna, D. J. Tobias and M. L. Klein, J. Chem. Phys., 1994, 101, 4177–4189 CrossRef CAS.
- N. Shuichi, Prog. Theor. Phys. Suppl., 1991, 103, 1–46 CrossRef.
- I. C. Bourg and C. I. Steefel, J. Phys. Chem. C, 2012, 116, 11556–11564 CAS.
- J. G. Harris and K. H. Yung, J. Phys. Chem., 1995, 99, 12021–12024 CrossRef CAS.
- R. Hockney, S. Goel and J. Eastwood, J. Comput. Phys., 1974, 14, 148–158 CrossRef.
- T. Wu and D. Zhang, Sci. Rep., 2016, 6, 23629 CrossRef CAS PubMed.
- D. Kasiteropoulou, T. E. Karakasidis and A. Liakopoulos, J. Mater. Sci. Eng. B, 2011, 176, 1574–1579 CrossRef CAS.
- D. Argyris, N. R. Tummala, A. Striolo and D. R. Cole, J. Phys. Chem. C, 2008, 112, 13587–13599 CAS.
- Y. Zhang, Y. Zhu, Z. Li, Y. Ruan, L. Li, L. Lu and X. Lu, Fluid Phase Equilib., 2016, 430, 169–177 CrossRef CAS.
- L. Guzzardi, D. Cazar, C. del Hierro, F. Torres and M. Méndez, Theor. Chem. Acc., 2016, 135, 1–6 CrossRef CAS.
- R. Roque-Malherbe, R. Polanco-Estrella and F. Marquez-Linares, J. Phys. Chem. C, 2010, 114, 17773–17787 CAS.
- Z. Jin and A. Firoozabadi, J. Chem. Phys., 2015, 143, 104315 CrossRef PubMed.
- L. Bocquet and J.-L. Barrat, Soft Matter, 2007, 3, 685–693 RSC.
- E. Bonaccurso, H.-J. Butt and V. S. Craig, Phys. Rev. Lett., 2003, 90, 144501 CrossRef PubMed.
- J. Hyväluoma and J. Harting, Phys. Rev. Lett., 2008, 100, 246001 CrossRef PubMed.
- G. McHale and M. Newton, J. Appl. Phys., 2004, 95, 373–380 CrossRef CAS.
- A. Author, Lab Chip, 2007, 7, 299–301 RSC.
- Y. Gratton and G. Slater, Eur. Phys. J. E: Soft Matter Biol. Phys., 2005, 17, 455–465 CrossRef CAS PubMed.
- H. Yu, J. Chen, Y. Zhu, F. Wang and H. Wu, Int. J. Heat Mass Transfer, 2017, 111, 1172–1180 CrossRef.
- M. Makaremi, K. D. Jordan, G. D. Guthrie and E. M. Myshakin, J. Phys. Chem. C, 2015, 119, 15112–15124 CAS.
- A. Berezhkovskii and G. Hummer, Phys. Rev. Lett., 2002, 89, 064503 CrossRef PubMed.
Footnote |
| † Electronic supplementary information (ESI) available. See DOI: 10.1039/c7ra11746a |
| This journal is © The Royal Society of Chemistry 2018 |

