A green pathway to adjust the mechanical properties and degradation rate of PCL by blending bio-sourced poly(glycerol-succinate) oligoesters†
Guang-Zhong
Yin‡
 *ab,
Xiao-Mei
Yang‡
c,
Zheng
Zhou
b and
Qi-Fang
Li
*b
aCollege of Chemistry and Molecular Engineering, Peking University, Beijing, 100871, P. R. China. E-mail: yingzh@pku.edu.cn
bState Key Laboratory of Chemical Resource Engineering, Beijing University of Chemical Technology, Beijing, 100029, China. E-mail: qflee@mail.buct.edu.cn
cNational Laboratory of Flame Retardant Materials, Beijing Institute of Technology, Beijing, 100081, P. R. China
First published on 9th January 2018
Abstract
Fully bio-sourced oligoesters based on poly(glycerol-succinate) (PGS) with controllable sizes and topologies were prepared by melt phase polycondensation. The oligoesters were further used to modify poly(ε-caprolactone) (PCL) by the blending method under mild processing conditions. As can be observed, the PGS modifier was well dispersed in the PCL matrix. The PGS could influence the crystallization and significantly accelerate the degradation of the PCL matrix. There was no significant decrease of mechanical properties after blending modification. Notably, the method used here is quite convenient and solvent-free, by which we can achieve PCL modification under very mild conditions. Therefore, the work proposed here is an effective, sustainable and environmentally friendly modifying method for PCL to accelerate the degradation rate.
Introduction
Nowadays, a series of environmental problems have resulted from the millions of tons of waste generated from end-of-life polymeric products; at the same time, the growing shortage of fossil fuel resources has limited the manufacture and utilization of petroleum-based polymeric materials. These issues have promoted the research, development, and utilization of environmentally friendly even bio-sourced polymeric materials. Fully biodegradable plastics, which are derived from renewable resources and degrade to benign byproducts at the end of their useful lifetime, have attracted significant attention as promising candidates for substituting conventional petroleum-based plastics. Poly(ε-caprolactone) (PCL) is a type of promising fully biodegradable aliphatic polyester, presenting high flexibility and excellent processability.1 Therefore, it is expected to reduce the negative impact on the environment caused by the production and utilization of petrochemical polymers. Furthermore, it has been used extensively in biomedical materials,2,3e.g. anti-adhesion membranes,4 drug delivery systems,5,6 bone tissue engineering,7,8 vascular grafts,9,10 shape memory materials,11,12 and so on. However, in view of the diversity and complexity of the applications, a wide range of materials are required to meet the demands of each application. Generally, PCL has a tremendously low degradation rate usually of several years,13 which also enhances the burden on the environment. To adjust the degradation rate or some other performance of PCL, several strategies have been proposed to improve the hydrophilicity of PCL, such as aminolysis,14 chemical modification by grafting PEG segments,15,16 and so on. On the other hand, the eco-design of plastic materials from renewable resources for high-consume applications such as packaging or agricultural mulches moves towards the design of sustainable polymers with controlled degradability and enhanced bio-reintegration.1,17 Blending commercial homopolymers, a physical pathway, represents a low cost and an easy scalable process to extend the use of the pristine homopolymers to an industrial level. Actually, the processing of blends by extrusion is the usual solution followed in the industry.18 There are also some other physical strategies to modify polymers, namely, modification by preparing porous materials,19–21 especially including electro spun membranes,22 and blending rigid particles,23 for example, CNT,24,25 TiO2,26 and clay.27 However, the particles are usually non-degradable, non-deformable and not good for processing; synthesis of block copolymers is not straightforward enough; although porous membranes have various applications, there is the sacrifice of mechanical properties and they are not promising for large-scale applications.By the way, PCL is the most popular aliphatic polyester, which is indeed commercially available and largely used at the industrial scale. In addition to its wide application as biomedical and smart materials as mentioned above, PCL can also be used as agricultural films28–30 and packaging materials.31–33 There is still a huge demand for biodegradable materials in the world. Increasing the industrial production of PCL, selecting environmentally friendly and efficient processes, and reducing the costs will all boost the PCL based material industry. Regulating its mechanical properties and degradation performance is expected to widen the scope of its application in many fields. It is helpful to take PCL products into people's daily life instead of some conventional plastic products. Therefore, it has practical significance for world environmental protection.
In another aspect, production of biobased succinic acid (SA) has become today a reality, and industrial scale production is being developed by chemical companies such as BASF, Bioamber or Myriant.34 As reported, the predicted market of bio-sourced succinic acid, which represents a safe and environmentally friendly alternative to petrochemicals, is estimated at € 2.5 billion.35 Glycerol is a natural molecule, also available synthetically or by microbial fermentation. Therefore, biobased platform molecules such as poly(glycerol-succinate) (PGS) are also convenient to be investigated and developed at the industrial scale. Indeed, PGS is an interesting and promising chemical for various applications. Grinstaff et al. have compared the convergent and the divergent methodologies for the synthesis of PGS dendritic polymers used in medical materials.36 Furthermore, the end groups are also available for subsequent reaction such that active molecules can be covalently attached or the polymer can be crosslinked into networks.
More recently, Seema Agarwal and coworkers37 have presented novel hyperbranched poly(amino-ester)s functionalized with quaternary ammonium salts (QAS-HPAEs). These materials can be used as antibacterial and biodegradable additives for mixing with non-active polymers. They showed a novel concept of using dendrons as a tool for making non-active materials antibacterial in a simple way.38 To the best of our knowledge, there are no reports on the other applications of PGS. Taking the wide applications as well as modification limitations of PCL and to extend the application of PGS, this study aims to modify PCL with synthesized PGS by the blending method. The crystalline properties, degradation performances and mechanical properties will be carefully recorded to evaluate the success of this convenient strategy. It is expected that the materials will have a significantly improved degradation performance without a remarkable decrease in their mechanical properties. Therefore, this work demonstrates the possibility to obtain functional blends by a low-cost and an easy industrial-scale process, for applying in several innovative fields where biodegradable polymers are required such as food packaging and agriculture films among others.
Experimental
Materials
Glycerinum (AR) and succinic acid (AR) were obtained from Beijing Chemical Works and used without any treatment. Commercial PCL (Mn ∼ 60![[thin space (1/6-em)]](https://www.rsc.org/images/entities/char_2009.gif) 000 g mol−1, PDI = 1.6) was also used as received.
000 g mol−1, PDI = 1.6) was also used as received.
Synthesis of PGS
Succinic acid (40 g, 0.34 mol) and glycerol (60 g, 0.65 mol) were introduced into a single-neck round-bottom flask equipped with a three-neck flask. The mixture was heated at 190 °C for complete melting in the absence of solvent under constant mechanical stirring and atmospheric pressure for 8 h, which is similar to that reported in a previous study.3513C NMR (DMSO, 400 MHz): succinate units (ppm), 171.96, 28.64; glyceryl units (ppm), 75.82, 72.44, 72.20, 69.19, 68.91, 66.03, 68.82, 65.07, 63.04, 62.54, 62.41, 61.92, 59.64, 59.34.Sample preparation
PCL/PGS composites were prepared by melt blending at 80 °C, on a twin roller mill (roller speed of 60 rpm, 10 min of mixing). The compositions of each sample are shown in Table 1. The blends were hot-pressed (BL-6170-C, Dongguan Bolon precision Testing machines) into sheets at 80 °C and 30 MPa for 3 min, and cut to the required dimensions for tests.| Samples | PGS contenta (%) | I 110/I200b | φ c (%) | β | L 110 (nm) | T g,onset (°C) | T m,onset (°C) | T m,peak (°C) | ΔHmc (J g−1) | φ c (%) |
|---|---|---|---|---|---|---|---|---|---|---|
| a Taking PCL as 100%. b Obtained from XRD. c Obtained from DSC. | ||||||||||
| A | 0 | 6.50 | 58.3 | 0.309 | 27.7 | −50.5 | 48.3 | 54.7 | −62.31 | 45.8 |
| B | 5 | 4.73 | 38.9 | 0.334 | 25.7 | −51.6 | 47.6 | 53.3 | −56.06 | 43.3 |
| C | 10 | 4.24 | 38.5 | 0.336 | 25.5 | −51.9 | 47.5 | 52.9 | −48.17 | 39.0 |
| D | 20 | 4.23 | 32.8 | 0.344 | 24.9 | −53.4 | 47.3 | 52.5 | −38.61 | 34.1 |
| E | 30 | 4.17 | 31.5 | 0.379 | 22.6 | −53.6 | 46.8 | 52.7 | −32.21 | 30.8 |
Structural characterization
The 13C quantitative NMR spectrum was recorded on a Bruker Advance 400 spectrometer, equipped with a QNP probe using DMSO as solvent.Cross-section morphology
The samples were quenched and fractured in liquid nitrogen, in preparation for examination of the fracture surface morphology by using a scanning electron microscope (SEM, Hitachi S-4700). The size and distribution were obtained by using Nano Measure software.Crystalline properties
The X-Ray Diffraction (XRD) data of the polymers were recorded using a BRUKER D8 ADVANCE diffractometer using Cu Kα radiation from 5° to 40° at room temperature. The degree of crystallinity (φc%) was calculated using the following equation:39 | (1) |
 | (2) |
Mechanical properties
Uniaxial tensile tests were carried out at 25 °C with a crosshead speed of 50 mm min−1. Samples (measuring 20 mm × 4 mm × 1 mm) were cut from the films obtained above using a fresh razor blade. The modulus of each sample was determined by linearly fitting the elastic portion of the stress–strain curve before the yielding point. Five dog bone-shaped samples were analyzed.Accelerated degradation
Accelerated degradation of all samples was carried out as reported elsewhere.41 Typically, preweighed samples with a similar thickness of 0.5 mm were placed individually in test tubes containing NaOH (0.1 M). The films were removed from the buffer solution and cleaned by three cycles of 15 min each with deionized water under sonication. Thereafter, the cleaned films were freeze dried for 24 h. The mass remaining (MR%) is calculated according to the following equation:42 | (3) |
Results and discussion
The synthesis of PGS
PGS is synthesized according to the literature procedure.35 We obtained a colorless viscous oil, as shown in Fig. 1(a) inset. The ester carbonyl resonances are cleanly resolved (Fig. 1a), being located at ∼170 ppm (peak a) and ∼30 ppm (peak b), respectively. The chemical shift assignments of the glycerol carbons and the five ester species (Fig. 1(b)) are shown in Fig. 1(c). The observed chemical shift values listed in Experimental are consistent with those previously reported.43 Topology is investigated by quantitative 13C NMR considering the linear (L), terminal (T) and dendritic (D) units. These units and their relative proportions define the chemical structure as depicted in Fig. 1(b). As reported, the degree of branching can be calculated from the following equation:44 | (4) |
 | (5) |
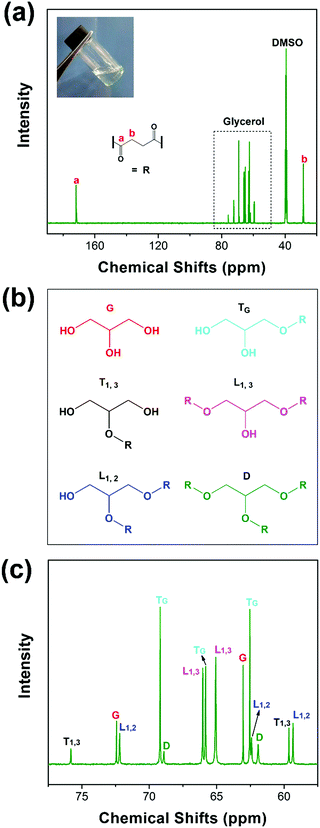 | ||
| Fig. 1 13C NMR: full spectrum (a), chemical structures of glycerol and the 5 ester species (b), and the assignment of the NMR spectrum for glycerol carbons and the 5 ester species (c). | ||
Blending of PGS and PCL
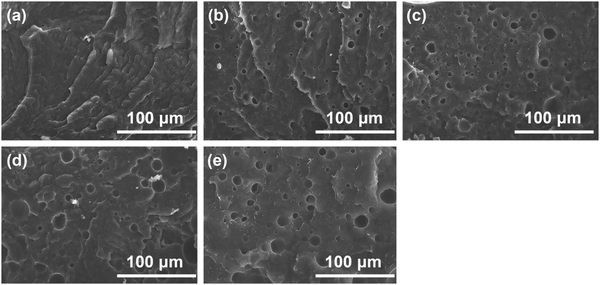
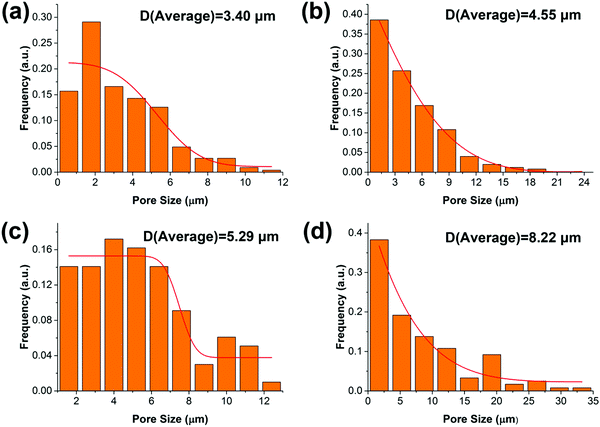
The synthesized oil-like PGS is blended into the PCL matrix, which has a low melting temperature. The distribution of PGS is characterized by SEM, as shown in Fig. 2. The neat PCL displays very rough surface morphology with high ductility but without any significant defects in the cross section. For the other blends, as can be seen, PGS is dispersed in the PCL matrix with different size scale. The pores are generated by the removal of PGS “particles” during sample preparation for SEM. We can obtain the size distribution by using Nano Measure software. The particle size is increasing with the increase of PGS content. Concretely, the average pore size of PGS is 3.4 μm, 4.55 μm, 5.29 μm and 8.22 μm, respectively, as shown in Fig. 3. We can see that at a low concentration (e.g. sample B), PGS can be dispersed well in the PCL matrix.Influence of PGS on the crystalline properties
XRD is recorded to estimate the crystalline properties of each sample. As can be seen in the XRD patterns (Fig. 4(a)), all samples showed crystalline reflections at 2θ = 21.4°, 22.5° and 23.6°, corresponding to the (110), (111) and (200) lattice planes of PCL. We can clearly see that the intensity ratios and the full-width at half-maximum (FWHM) are significantly increased. As known, the thickness in the perpendicular direction of the related crystal plane can be calculated by the Sheller equation: | (6) |
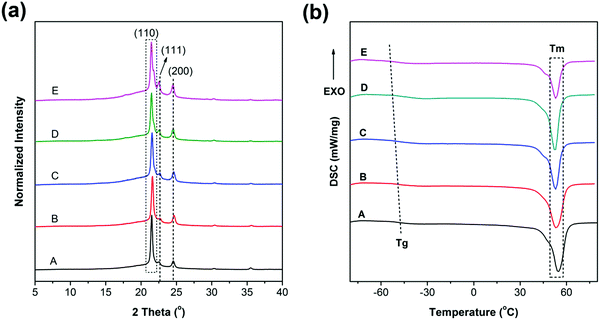 | ||
| Fig. 4 (a) XRD and (b) DSC curves (second heating) of the samples (enlarged Tg regions of DSC curves are shown in Fig. S4, ESI†). | ||
The DSC results are shown in Fig. 4(b). As can be seen, the melting points of all samples are near 55 °C and with a declining trend. The crystallinity results based on eqn (2) are also listed in Table 1. The crystallinity is decreased with the increase of PGS content (Fig. S2, ESI†), which is in good agreement with the results obtained from XRD. It is mainly attributed to the fact that PGS may act as an impurity, largely inhibiting the crystallization of PCL.
On the basis of the DSC curves in Fig. 4(b), the samples present different transition temperatures. The blended PGS can partly act as a plasticizer, increasing the free volume, giving rise to a gradual decrease of Tg,onset with the increase of PGS. Therefore, the Tg,onset of samples A, B, C, D and E are −50.5 °C, −51.6 °C, −51.9 °C, −53.4 °C and −53.8 °C, respectively. The DSC result of PGS is supported by Fig. S3 (ESI†). The Tg,onset of PGS is confirmed to be −46.6 °C. As can be observed in Table 1, both crystallinity and Tm,onset of the samples decrease with the increase of PGS content. Such decrease can be explained by the fact that a higher PGS content means more impurity, which may restrain crystalline growth to a more extent.
Influence of PGS on the mechanical properties
Fig. 5 shows the tensile stress–strain curves and the mechanical property trends of PCL and the blends. The corresponding data are listed in Table 2. Based on the stress–strain curves, we conclude that all the materials are soft and tough with low yield stress (<15 MPa) and modulus (<200 MPa) but high elongation at break (>500%). Obviously, all of the curves contain four regions, namely, elastic, yielding, cold drawing and strain hardening regions. It is observed that both yield strength and Young's moduli are decreased with the increase of PGS content, as can be seen in Fig. 5(b); typically, the yield strength is decreased from 13.5 MPa (sample A) to 7.1 MPa (sample E).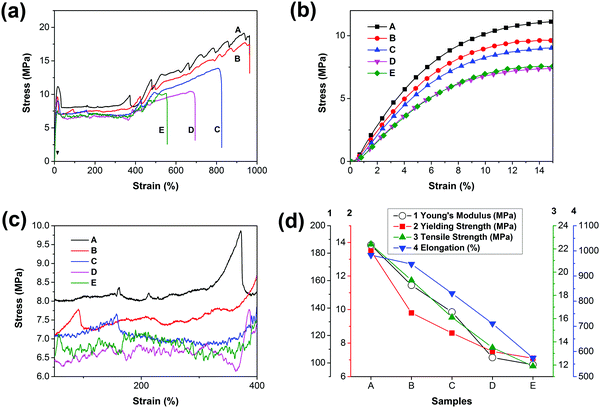 | ||
| Fig. 5 (a) Stress–strain curves of PCL and PCL/PGS blends, (b) details with an enlarged scale of the elastic region, (c) details with an enlarged scale of the cold-drawing region and (d) the trends of Young's modulus, yield strength, tensile strength and elongation with the increase of PGS content. For clarity, the error bars that are listed in Table 2 are omitted in (d). | ||
| Samples | Young's modulus (MPa) | Yield strength (MPa) | Tensile strength (MPa) | Elongation (%) |
|---|---|---|---|---|
| A | 185.9 ± 12.3 | 13.5 ± 1.9 | 22.4 ± 3.5 | 983.2 ± 69.3 |
| B | 156.6 ± 9.7 | 9.8 ± 0.6 | 19.3 ± 2.9 | 947.4 ± 53.6 |
| C | 137.1 ± 10.5 | 8.6 ± 0.8 | 16.1 ± 3.2 | 831.1 ± 24.2 |
| D | 103.9 ± 4.3 | 7.5 ± 1.1 | 13.5 ± 1.8 | 710.9 ± 78.9 |
| E | 98.7 ± 14.1 | 7.1 ± 2.2 | 11.9 ± 4.4 | 574.4 ± 47.3 |
Fig. 5(d) presents that the elongation, Young's modulus, and yield strength are decreased gradually. As presented in both DSC and XRD results, the crystallinity is decreased with the increase of PGS content. As a result, the yield strength decreases. In addition, PGS can act as a plasticizer, leading to the decrease of Young's modulus. However, the introduction of PGS may induce defects inside the PCL matrix, directly giving rise to the decline of elongation at break. Furthermore, we find that the roughness of curves increases with the increase of PGS content in the cold drawing region (Fig. 5(c)), which is probably attributed to the deformation of the liquid-like particles of PGS.
As we know, PGS may act as an inter-pore bridge to form a contact region, which increases the interaction among pores, resulting in a more heterogeneous stress distribution. Accordingly, the Young's moduli, elongation and yield strength of the PCL membranes can maintain at >50% for all blends. As reported,20 for the porous PCL (with a porosity of ∼30%), the elongation decreased by 75.3%, the tensile strength decreased by 82.3%, and the Young's modulus decreased by 61.9%. Notably, in this study, when the PGS content is 5%, the blends can maintain the Young's modulus at 84.2% and the yield strength, tensile strength and elongation at 72.6%, 86.2% and 96.3%, respectively, as shown in Fig. 5(d) and Table 2. Even when the content reaches 30%, the blends can maintain all the mechanical parameters at values >50%.
Influence of PGS on the degradation properties
The accelerated hydrolysis of PCL and the blend films is induced by NaOH solution. Fig. 6 shows the variation of the weight loss of PCL and its blends with time during a hydrolysis test. The values of weight loss increase with prolonged degradation time for both the neat PCL and its blends.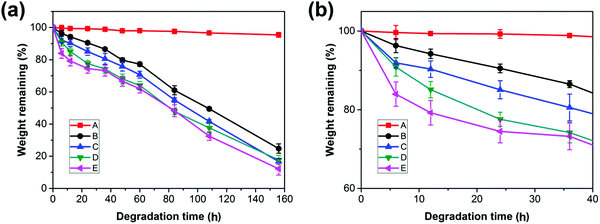 | ||
| Fig. 6 (a) Weight remaining vs. time curves of PCL and PCL/PGS blends, (b) details with an enlarged scale of the initial stage in (a). | ||
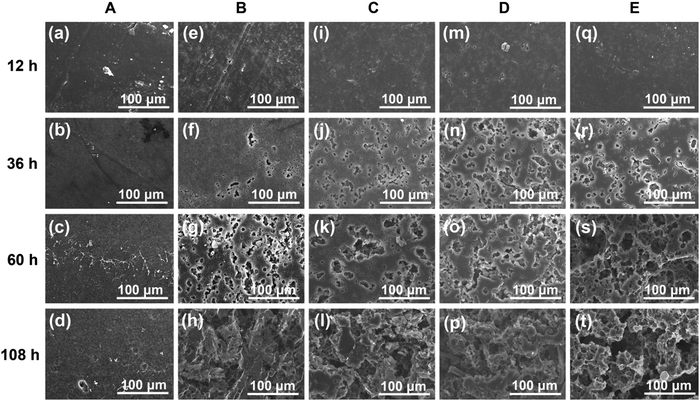
Due to the highly hydrophobic property and high crystallinity, PCL has a slow degradation rate with a value of 0.04 wt% h−1. For the PCL bulk membrane, there is no significant change in weight over degradation time. The almost unchanged weight of PCL suggests that the hydrolysis of the neat PCL and the blends may proceed via the surface erosion mechanism;45 thus, only the surface of the samples is eroded while the interior remains almost unchanged during the hydrolysis process, which can be confirmed by the morphologies in Fig. 7 (sample A). However, the hydrolysis rates are increased to 0.63 wt% h−1, 1.27 wt% h−1, 1.56 wt% h−1, and 2.59 wt% h−1 for the blends with an increase in the PGS loading from 5 wt% to 30 wt%. It is obvious that the blends hydrolyze faster than the neat PCL, indicating that the loading of PGS accelerated the hydrolysis of PCL in the blends.
When comparing samples B, C, D and E, it can be found that the degradation rate increases with the increase of PGS content, which is mainly attributed to the high PGS content being conducive to moisture penetration. In addition, we know that the degradation rate of crystalline regions is significantly slower than amorphous regions.16 Both XRD and DSC results show that the samples with higher PGS content have lower crystallinity, which is also conducive to accelerate the degradation rate of the blends. Moreover, as shown in Fig. 6, the mass loss started from the beginning of each hydrolysis experiment and shows almost linear variation of weight loss with degradation time after 40 h, all with a similar rate of ∼0.5 wt% h−1, which probably indicates that all PGS additives are removed completely after 40 h. After that, the mass changes are attributed to the degradation of PCL itself.
We can use SEM to further detect the degradation change of the sample morphology conveniently. As discussed above, the initial stage of degradation of the blends is due to the hydrolysis and dissolution of PGS. The hydrolysis and dissolution of PGS indeed introduced a lot of pores inside (Fig. 7), which increases the surface that can be degraded simultaneously, and accelerates the degradation rate accordingly. Furthermore, we find that the PGS can decrease the crystallinity, which also influenced the degradation properties as well as the mechanical properties to some extent.
The bulk degradation caused pores (as shown in the SEM of blends) in the materials, and the crack diffusion eventually resulted in the damage of the material. Under a similar degradation situation, the PCL, the continuous phase, restricted crack transfer and connected the different micro-structured units, ensuring the integrity of all samples after degradation. Notably, all the membranes are continuous (Fig. S5, ESI†), which makes sure that the membrane can support necessary mechanical demands after partial degradation.
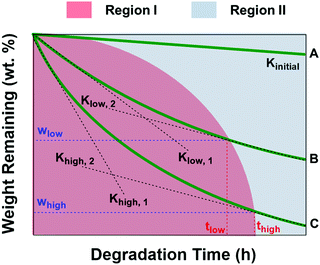
Fig. 8 shows the schematic diagram of weight remaining vs. time curves of PCL and PCL/PGS blends with different PGS contents. As depicted, the red region (region I) means the degradation process contains contribution of both PGS and PCL. On the other hand, only PCL itself degraded in region II. It presents Kinitial < Klow,1 < Khigh,1, which is attributed to the fact that with the increase of PGS content there is an increase of the degradation rate at the first stage due to the relatively high degradation rate of PGS. When the degradation of PGS is complete, the degradation rate tends to be relatively constant, namely, Klow,2 and Khigh,2 are quite similar, but both are significantly higher than Kinitial. According to the above results, Klow,2 and Khigh,2 are both with a value of about −0.53 wt% h−1, which is also much higher than that of Kinitial with a value of −0.04 wt% h−1. The wlow and whigh in Fig. 8 are proportional to the amount of PGS fillers. For the complete dissolution of PGS, the more the PGS content, the easier it is to move out, but it will take more time to move out all. Therefore, it presents a nonlinear change for the boundary of the red and blue region. In the situation of this study, the content of PGS increases, giving rise to more time to move out all, namely thigh > tlow. According to the data shown in Fig. 6, we can further estimate some key parameters, namely, ΔwB ∼ 5 wt%, ΔwC ∼ 9 wt%, ΔwD ∼ 20 wt% and ΔwE ∼ 25 wt%, which is in good agreement with the PGS additive content during the processing. It is difficult to obtain thigh and tlow values. However, we can know that all PGS in the four blends can be removed completely after 40 h (region II) in this study.
Further discussion
In this research, during blending flowable PGS in the PCL, the dispersion of PGS can be enhanced by a mechanical process, e.g. thermo-stress, which makes the method used here possess significant machinability and maneuverability. It is not like porous materials with completely hollow defects (Fig. 9(a)), which will lead to a significant decrease of mechanical properties. The PGS may act as an inter-pore bridge to form a contact region, which increases the interaction among “pores”, resulting in a more heterogeneous stress distribution,20 which ensures high mechanical properties under a high filling content. It is also different from the rigid particles with non-deformability (Fig. 9(c)). As we know, it is difficult to implement a large number of filler modifications with good dispersion. And it increases the processing difficulty of PCL itself due to the poor compatibility between rigid particles and PCL. The particles are usually non-degradable, non-deformable (thus, the breaking elongation is usually low after modification) and not good for processing (e.g. with high process temperature46). Considering PE as a typical example, the PE powder in combination with a pro-oxidant and surfactant acted as a degradation accelerating additive for PCL leading to faster molecular weight decrease.47 Although the blends have high elongation, the PE is not a sustainable polymer, which will enhance the environmental burden. Fortunately, in this study PGS can consume a part of the energy in the strain deformation, which is beneficial to the toughness of the material.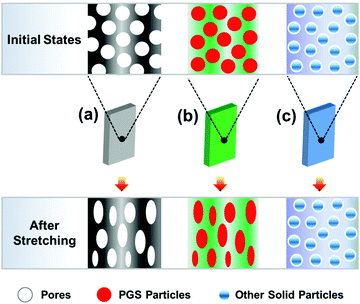 | ||
| Fig. 9 Illustration of modifying the polymer by three different pathways: (a) porous materials, (b) blending deformable PGS and (c) blending rigid particles. | ||
Finally, it is noteworthy to point out that the mentioned method has the following advantages: (1) it is “solvent-free”; (2) it is convenient to fabricate and industrialize under mild process conditions; (3) it can effectively accelerate the biodegradation of PCL without decreasing the mechanical properties significantly; and (4) the modifier comes from a sustainable resource. Therefore, it is expected that the method can be promoted in the PCL industrialization application. By the way, the study here extends the applications of PGS. As expected, PGS can be a common modifier for other polyesters, which will be our next step of work.
Conclusion
Modified PCL sheets with an accelerated degradation rate were obtained by blending fully bio-sourced poly(glycerol-succinate) (PGS) with controllable sizes and topologies. The PGS was well dispersed in the PCL matrix and could influence the crystallization and significantly accelerate the degradation rate. Notably, there was no significant decrease of mechanical properties after blending modification. Furthermore, the whole process is performed without the use of organic solvents, and the modifier PGS is fully bio-sourced. Thus, the work here is recommended to be a convenient but effective, sustainable and environmentally friendly modifying method. Notably, the method described here broadens the foundation of industrialization of PCL and the method may be flexibly extended to fabricate a broad variety of polyesters under suitable blending strategies.Conflicts of interest
The authors declare no competing financial interest.Acknowledgements
This work was financially supported by the National Natural Science Foundation of China (No. 51403013, 51273017). The authors also thank the anonymous referees for their valuable suggestions which improved the presentation of this paper.References
- J. Chen, L. Lu, D. Wu, L. Yuan, M. Zhang, J. Hua and J. Xu, ACS Sustainable Chem. Eng., 2014, 2(9), 2102 CrossRef CAS.
- X. Yang, J. Yang, L. Wang, B. Ran, Y. Jia, L. Zhang, G. Yang, H. Shao and X. Jiang, ACS Nano, 2017, 11(6), 5737 CrossRef CAS PubMed.
- J. Xue, M. He, Y. Liang, A. Crawford, P. Coates, D. Chen, R. Shi and L. Zhang, J. Mater. Chem. B, 2014, 2(39), 6867 RSC.
- R. Shi, J. Xue, H. Wang, R. Wang, M. Gong, D. Chen, L. Zhang and W. Tian, J. Mater. Chem. B, 2015, 3(19), 4063 RSC.
- A. Bains, Y. Cao, S. Kly, J. E. Wulff and M. G. Moffitt, Mol. Pharmaceutics, 2017, 14(8), 2595 CrossRef CAS PubMed.
- B. Surnar and M. Jayakannan, ACS Biomater. Sci. Eng., 2016, 2(11), 1926 CrossRef CAS.
- K. Qiu, B. Chen, W. Nie, X. Zhou, W. Feng, W. Wang, L. Chen, X. Mo, Y. Wei and C. He, ACS Appl. Mater. Interfaces, 2016, 8(6), 4137 CAS.
- X. Jing, H.-Y. Mi, X.-C. Wang, X.-F. Peng and L.-S. Turng, ACS Appl. Mater. Interfaces, 2015, 7(12), 6955 CAS.
- Z. Wang, Y. Wu, J. Wang, C. Zhang, H. Yan, M. Zhu, K. Wang, C. Li, Q. Xu and D. Kong, ACS Appl. Mater. Interfaces, 2017, 9(23), 19541 CAS.
- K. Wang, Q. Zhang, L. Zhao, Y. Pan, T. Wang, D. Zhi, S. Ma, P. Zhang, T. Zhao, S. Zhang, W. Li, M. Zhu, Y. Zhu, J. Zhang, M. Qiao and D. Kong, ACS Appl. Mater. Interfaces, 2017, 9(13), 11415 CAS.
- Y. Zheng, Y. Li, X. Hu, J. Shen and S. Guo, ACS Appl. Mater. Interfaces, 2017, 9(16), 13988 CAS.
- C.-S. Yang, H.-C. Wu, J.-S. Sun, H.-M. Hsiao and T.-W. Wang, ACS Appl. Mater. Interfaces, 2013, 5(21), 10985 CAS.
- L. Yang, J. Li, Y. Jin, M. Li and Z. Gu, Polym. Degrad. Stab., 2015, 112, 10 CrossRef CAS.
- P. Bhattacharjee, D. Naskar, H.-W. Kim, T. K. Maiti, D. Bhattacharya and S. C. Kundu, Eur. Polym. J., 2015, 71, 490 CrossRef CAS.
- H. Wang, D. Tong, L. Wang, L. Chen, N. Yu and Z. Li, Polym. Degrad. Stab., 2017, 140, 64 CrossRef CAS.
- G. Yin, D. Zhao, X. Wang, Y. Ren, L. Zhang, X. Wu, S. Nie and Q. Li, RSC Adv., 2015, 5(96), 79070 RSC.
- J. D. Badia, E. Strömberg, T. Kittikorn, M. Ek, S. Karlsson and A. Ribes-Greus, Polym. Degrad. Stab., 2017, 143, 9 CrossRef CAS.
- I. Navarro-Baena, V. Sessini, F. Dominici, L. Torre, J. M. Kenny and L. Peponi, Polym. Degrad. Stab., 2016, 132, 97 CrossRef CAS.
- T. Yang, Y. Hu, C. Wang and B. P. Binks, ACS Appl. Mater. Interfaces, 2017, 9(27), 22950, DOI:10.1021/acsami.7b05012.
- G. Yin, L. Zhang, Z. Zhou and Q. Li, J. Polym. Res., 2016, 23(11), 229 CrossRef.
- S. Kumar and K. Chatterjee, Nanoscale, 2015, 7(5), 2023 RSC.
- R. Augustine, S. K. Nethi, N. Kalarikkal, S. Thomas and C. R. Patra, J. Mater. Chem. B, 2017, 5, 4660 RSC.
- Y. B. Kim and G. H. Kim, ACS Comb. Sci., 2015, 17(2), 87 CrossRef CAS PubMed.
- D. G. Goodwin, Z. Xia, T. B. Gordon, C. Gao, E. J. Bouwer and D. H. Fairbrother, Environ. Sci.: Nano, 2016, 3(3), 545 RSC.
- R. S. Lankone, J. Wang, J. F. Ranville and D. H. Fairbrother, Environ. Sci.: Nano, 2017, 4(4), 967 RSC.
- K. K. Gupta, A. Kundan, P. K. Mishra, P. Srivastava, S. Mohanty, N. K. Singh, A. Mishra and P. Maiti, Phys. Chem. Chem. Phys., 2012, 14(37), 12844 RSC.
- J. Yao, S. Chen, C. Ma and G. Zhang, J. Mater. Chem. B, 2014, 2(31), 5100 RSC.
- A. Demicheli, S. Russo and A. Mariani, Polymer, 2000, 41(4), 1481 CrossRef CAS.
- R. Adhikari, K. L. Bristow, P. S. Casey, G. Freischmidt, J. W. Hornbuckle and B. Adhikari, Agric. Water Manage., 2016, 169, 1 CrossRef.
- V. L. Finkenstadt and B. Tisserat, Ind. Crops Prod., 2010, 31(2), 316 CrossRef CAS.
- S. Alix, A. Mahieu, C. Terrie, J. Soulestin, E. Gerault, M. G. J. Feuilloley, R. Gattin, V. Edon, T. Ait-Younes and N. Leblanc, Eur. Polym. J., 2013, 49(6), 1234 CrossRef CAS.
- W. Y. Choi, C. M. Lee and H. J. Park, LWT–Food Sci. Technol., 2006, 39(6), 591 CrossRef CAS.
- R. Ortega-Toro, J. Contreras, P. Talens and A. Chiralt, Food Packag. Shelf Life, 2015, 5, 10 CrossRef.
- B. Cok, I. Tsiropoulos, A. L. Roes and M. K. Patel, Biofuels, Bioprod. Biorefin., 2014, 8(1), 16 CrossRef CAS.
- M. Agach, S. Delbaere, S. Marinkovic, B. Estrine and V. Nardello-Rataj, Colloids Surf., A, 2013, 419, 263 CrossRef CAS.
- N. R. Luman, T. Kim and M. W. Grinstaff, Pure Appl. Chem., 2004, 76(7), 1375 CAS.
- H. Bakhshi and S. Agarwal, J. Mater. Chem. B, 2017, 5(33), 6827 RSC.
- H. Bakhshi and S. Agarwal, Polym. Chem., 2016, 7(33), 5322 RSC.
- N. Toncheva-Moncheva, R. Jerome and R. Mateva, Polym. Degrad. Stab., 2016, 123, 170 CrossRef CAS.
- D.-D. Xing, Y.-W. Jia, D.-F. Li, X.-L. Wang and Y.-Z. Wang, ACS Sustainable Chem. Eng., 2017, 75(1), 45 Search PubMed.
- X. Yuan, A. F. T. Mak and K. Yao, Polym. Degrad. Stab., 2002, 75(1), 45 CrossRef CAS.
- M. A. Gámiz-González, A. Vidaurre and J. L. Gómez Ribelles, Polym. Degrad. Stab., 2017, 138, 47 CrossRef.
- T. Zhang, B. A. Howell, A. Dumitrascu, S. J. Martin and P. B. Smith, Polymer, 2014, 55(20), 5065 CrossRef CAS.
- M. Agach, S. Delbaere, S. Marinkovic, B. Estrine and V. Nardello-Rataj, Polym. Degrad. Stab., 2012, 97(10), 1956 CrossRef CAS.
- H. Zhao, Y. Bian, Y. Li, Q. Dong, C. Han and L. Dong, J. Mater. Chem. A, 2014, 2(23), 8881 CAS.
- M. Nerantzaki, G. Z. Papageorgiou and D. N. Bikiaris, Polym. Degrad. Stab., 2014, 108, 257 CrossRef CAS.
- M. Michalak, M. Hakkarainen and A.-C. Albertsson, ACS Sustainable Chem. Eng., 2016, 4(1), 129 CrossRef CAS.
Footnotes |
| † Electronic supplementary information (ESI) available. See DOI: 10.1039/c7qm00600d |
| ‡ The authors contributed equally to the work. |
| This journal is © the Partner Organisations 2018 |

