Imidazolium decyl sulfate: a very promising selfmade ionic hydrogel†
Oscar
Cabeza
 *a,
Esther
Rilo
 a,
Luisa
Segade
 a,
Montserrat
Domínguez-Pérez
 a,
Sandra
García-Garabal
 a,
David
Ausín
 a,
Elena
López-Lago
b,
Luis Miguel
Varela
 c,
Miguel
Vilas
d,
Pedro
Verdía
 d and
Emilia
Tojo
 d
d
aDpt. de Física e C.C. da Terra, Universidade da Coruña, 15071 A Coruña, Spain. E-mail: oscabe@udc.es
bDpt. de Física Aplicada, Universidad de Santiago de Compostela, 15782 Santiago de Compostela, Spain
cDpt. de Física de Partículas, Universidad de Santiago de Compostela, 15782 Santiago de Compostela, Spain
dDpt. de Química Orgánica, Universidade de Vigo, 36310 Vigo, Spain
First published on 26th December 2017
Abstract
In this paper, we show, for the first time, the synthesis, structural characterization, phase diagram and physical properties of the ionic liquid, 1-ethyl-3-methyl imidazolium decyl sulfate [EMIm][DSO4]. At 25 °C it is either a crystalline solid or a liquid depending on the thermal history as its melting point is about 33 °C and its point of solidification is about 22 °C. The interest of this new IL lies in its ability to become a rigid hydrogel when mixed with water. As observed in many ILs, the as-prepared IL is hygroscopic and it adsorbs about 14 wt% of water at usual laboratory conditions and up to 27 wt% in a 100% saturated atmosphere. Due to the H-bonds between water and the amphiphilic [DSO4] anions, a lyotropic HI liquid crystalline phase is formed in the hydrated state, which can be observed in micrographs recorded using white polarized light. The moisture adsorption is a completely reversible process; thus, the rigid-gel sample loses all adsorbed water when it is left in a dry atmosphere for a few hours, transitioning to the liquid state. Phase diagrams of the temperature-water concentration is presented and compared with that of the parent compound [EMIm] octyl sulfate, [OSO4]. X-ray diffraction revels that below 15 °C the hydrated compound crystallizes into a P2/m monoclinic structure. The structure of the new compound was confirmed by NMR, FTIR and mass spectroscopy (MS). In addition, the temperature behavior of ionic conductivity was experimentally measured and analyzed for the pure compound and for two samples hydrated with 10 wt% and 39 wt% of water. Viscosity and density were also measured vs. temperature for the pure sample. The as-prepared IL shows great potential for numerous practical applications.
Introduction
In recent papers we published that the ionic liquid (IL), 1-ethyl-3-methylimidazolium octyl sulfate [EMIm][OSO4], forms an ionic hydrogel at ambient conditions when it is mixed with water (named a rigid-gel state).1,2 It is known that hydrogels are crosslinked hydrophilic polymer assemblies classically made from high molecular weight biopolymers. In this study, an alkyl sulfate anion, e.g., decyl sulfate, was enlarged by two carbons to obtain the [EMIm][DSO4]; its properties have shown to be remarkable and also, it presents very interesting properties that can be used for many applications.3 Sulfate salts with long alkyl chains, such as sodium dodecyl sulfate, are anionic surfactants and are known to form micellar aggregates in aqueous solution. In addition, ILs with long alkyl chains, such as 1-dodecyl-3-methyl imidazolium bromide, present similar characteristics.4 Such lyotropic mesophases are usually formed by adding amphiphiles to a solvent. These solutions form aggregates above the critical micelle concentration, which can have various shapes and sizes and constitute the building blocks of liquid crystals. Usually, the normal topology (or Type 1) phase structures are formed upon increasing the amphiphilic concentration range from micellar cubic to hexagonal and bicontinuous cubic and ultimately to lamellar.5 A further increase in amphiphilic concentration leads to the formation of inverse topology lyotropic (or Type 2) phases, in which the polar domain is discontinuous. Thus, addition of water from 5 to 40 wt% to long alkyl chain ILs results in a strong, anisotropic 2D pattern featuring two diffraction rings, which indicates the presence of a lamellar lyotropic liquid crystalline phase.6 A characteristic optical texture of the birefringent sample in polarized light microscopy supports this finding. Inoue et al. have studied the binary mixture of 1-dodecyl-3-methyl imidazolium bromide and water by differential scanning calorimetry and polarized optical microscopy and detected both the hexagonal and the lamellar liquid crystalline phases.4 A similar behaviour observed by SAXS has been reported for 1-hexadecyl-3-methyl imidazolium chloride.7 Russina et al. have studied the water-free IL [EMIm][OSO4] by SAXS.8,9 The low Q peak in the SAXS pattern of this IL together with a range of similar ILs provide evidence for an intermediate range order existing in [EMIm][OSO4] and other ILs6,10 with large differences in the nature and the spatial extent of the head and tail interactions.In addition to the lyotropic character of the decyl sulfate anion in the as-prepared IL, we added the chromonic [EMIm] cation, which enabled the formation of tubular micelles due to their π–π interactions.11
One of the most promising applications of ILs is to develop a new generation of electrolytes that can substitute those currently used in electrochemical devices.12–14 For this purpose, the alkyl sulfate ILs family is very suitable and has the advantage of being halide free.15 For many electrochemical applications, it is desirable to have a quasi-solid conductor instead of a liquid conductor and hence, numerous attempts have been performed to obtain them using ILs.16–25 The usual methods to prepare quasi-solid conductors are to polymerize monomers mixed with an IL,16–18 to include a gelator in an aqueous mixture of a given IL,19–23 or to polymerize the IL itself.24,25 In majority of the cases, the ionic conductivity drops abruptly in the quasi solid state relative to its conductivity in the liquid state;25 however, ionic hydrogels usually do not undergo this loss in conductivity and the magnitude remains unaltered during phase transition.1,2,24 In this paper the synthesis, structure and the temperature behavior of some physical properties of [EMIm][DSO4] are presented. To our knowledge, this material is a new IL, which has been neither synthesized nor reported earlier. When it adsorbs a minute quantity of water from the atmosphere, it becomes an ionic hydrogel, in which the biopolymer role is played by the alkyl sulfate anion and the chromonic character of the cation helps to form long tubular micelles.11 This liquid-crystalline mesomorphic state appears well above room temperature and as mentioned before, forms without the addition of any polymer or gelator. The IL maintains this state up to 85 °C with the appropriate amount of water. To our knowledge this is the first IL based ionic hydrogel that is in a stable quasi-solid state above 50 °C.1,14,20,24 This IL adsorbs the necessary amount of water directly from the atmosphere, regulating its composition up to 27 wt% in a 100% relative humidity atmosphere. This new compound has been recently patented.26 The proposed applications for this new material are broad, including electrolytes,12,13 gas sensors,21 membranes14 or catalysts.23,27
Experimental
Chemicals
1-Methylimidazolium (Sigma-Aldrich, 99%), diethyl sulfate (Fluka, ≥99%), toluene (Merck, 99%), 1-decanol (Sigma-Aldrich, 99%), methane sulfonic acid (Aldrich, anhydrous) and tert-butyl methyl ether (Panreac, 99.5%) were used without any pre-treatment.Synthesis
The 1H and 13C NMR spectra of the obtained ionic liquids were recorded on a Bruker ARX at 400.1621 and 100.6314 MHz, respectively, with chemical shifts provided in parts per million and coupling constants (J) in Hertz. The purity of the synthesized IL was determined by 1H-NMR using the parameters and methodology for qNMR measurements described by Mahajan et al.28 The internal standard employed was hydroquinone. ESI mass spectra were recorded on a micrOTOF Focus spectrometer and on an apex-Qe spectrometer. All spectral data were supplied by the Centre of Research Support (CACTI) of the University of Vigo.The final water content of the measured pure compound was about 1480 ± 60 ppm, obtained from a Mettler Toledo C20 Coulometric Karl–Fischer titrator. Finally, it should be noted that the molar mass, M, of [EMIm][DSO4] is equal to 348.45 g mol−1.
Physical properties
The ionic conductivity, the density and the viscosity of the pure sample and the first magnitude in two hydrated samples with 10 wt% (xIL = 0.317) and 39 wt% of water (xIL = 0.075), were experimentally measured. Mixtures were prepared by mass using a Gram ST510 balance, which has an accuracy of ±0.01 g. Ionic conductivity was measured using a CRISON GLP 31 conductivity meter (which uses a constant ac current of 500 Hz) in an isothermal basis. Thus, the sample was left undisturbed for at least 15 min at each temperature before measurement and up to 3 h in the liquid to crystal solid transition during the different phase transitions. The samples were thermostated using a Julabo 25 thermal bath with an uncertainty of 0.1 °C. The experimental relative uncertainties of the ionic conductivity were less than 0.5% of the measured value with repeatability better than 3%. Density and viscosity were simultaneously measured using a Stabinger Anton Paar SVM3000 viscodensimeter with a Peltier cell that allows choosing temperatures with an uncertainty of 0.02 °C; however, a reproducibility of 0.1 °C was assumed. The main advantage of this apparatus is that we can measure the entire viscosity range (from 0.2 up to 20![[thin space (1/6-em)]](https://www.rsc.org/images/entities/char_2009.gif) 000 mPa s) simultaneously without changing any part of it. The precision for the viscosity measurement is better than 0.1% and the repeatability is lower than 2%. Moreover, density value was automatically corrected from the influence of viscosity, which is very important for highly viscous samples such as those measured herein. The precision in density values is 0.5 kg m−3 and its repeatability is about 1 kg m−3. These measurements were also performed under the isothermal basis described above. Clearly, in the rigid-gel state, a rheometer is needed to investigate its viscoelastic properties. As observed previously for [EMIm][OSO4]2, between the liquid and the rigid-gel state, the hydrated sample is in a stable intermediate liquid-crystalline (called quasi-gel) state over an interval of some degrees Celsius. The different states were determined by naked eye, confirming the sample fluidity after each conductivity measurement.
000 mPa s) simultaneously without changing any part of it. The precision for the viscosity measurement is better than 0.1% and the repeatability is lower than 2%. Moreover, density value was automatically corrected from the influence of viscosity, which is very important for highly viscous samples such as those measured herein. The precision in density values is 0.5 kg m−3 and its repeatability is about 1 kg m−3. These measurements were also performed under the isothermal basis described above. Clearly, in the rigid-gel state, a rheometer is needed to investigate its viscoelastic properties. As observed previously for [EMIm][OSO4]2, between the liquid and the rigid-gel state, the hydrated sample is in a stable intermediate liquid-crystalline (called quasi-gel) state over an interval of some degrees Celsius. The different states were determined by naked eye, confirming the sample fluidity after each conductivity measurement.
In addition, other instruments were recorded to characterize the samples as follows: Humidity grade of the atmosphere was measured using a Kestrel 3500 Pocket Weather Meter with an accuracy of ±3% and resolution of 0.1%. Thermo-gravimetric analysis (TGA) was performed using a NETZSCH STA 449F3 TGA with a heating rate of 5 °C min−1 in air atmosphere. Mid-infrared spectra were recorded in the range 400 to 4000 cm−1 using a Bruker Vector 22 mid-infrared FT-IR spectrometer, equipped with a Specac Golden Gate single-reflection diamond ATR accessory with KRS-5 optics. These data were obtained at a sample temperature of 22 °C. X-ray spectra was recorded using a Bruker Kappa-APEX-II, equipped with a Mo tube (λ(Kα1) = 0.71073 Å) source at 50 kV and 30 mA, and a 2D detector (APEX-II). Finally, A BIOLAR PI Microscope was used to observe the microstructure of a drop of the sample exposed to the atmosphere. This microscope operated in a cross polarizing configuration. It was directly coupled to a CCD camera. Using a 10× objective, such that the total field of view of the camera covered an area of 400 × 290 μm2 (756 × 576 pixels) in the object plane.
Results and discussion
Synthesis
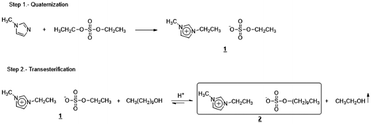
[EMIm][DSO4] was prepared from the ionic liquid 1-ethyl-3-methyl imidazolium ethyl sulfate, [EMIm][ESO4], by treatment with 1-decanol in an acidic medium. [EMIm][ESO4] was previously obtained by a direct alkylation of 1-methyl imidazolium with diethyl sulfate. The two steps of the entire procedure are indicated in Fig. 1.Water adsorption
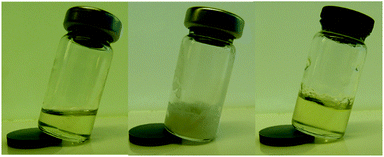
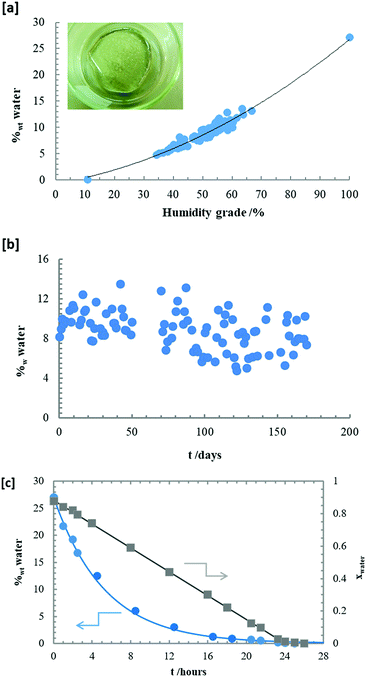
The [EMIm][DSO4] is either a viscous liquid or a crystalline solid at room temperature depending on its thermal history as observed in Fig. 2. In this figure, two photographs of the same sample at 30 °C are shown: the left sample is obtained from hot conditions (liquid) and in the middle sample is obtained from cold conditions (white crystal). The pure sample has a water content of 1480 ± 60 ppm as determined from Karl-Fisher titration. The exclusive property of this IL is that it self-hydrates naturally on exposure to ambient moisture and after a few minutes in ambient conditions, the liquid transforms into a mesomorphic liquid crystalline rigid-gel as observed in Fig. 2 (right sample), which is a hydrated sample with 10 wt% of water at 30 °C. To study the hygroscopic character of this IL, a sample of pure [EMIm][DSO4] was placed in a sealed box on a Petri plate (shown in the sketch of Fig. 3(a)) and the humidity grade was regulated in the box. After a few hours at a given humidity value, the sample was weighted and the mass excess was assumed to be the water adsorbed. As expected, the compound is very hygroscopic due to its alkyl-sulfate anion.30 Results are shown in Fig. 3(a), where the weight percentage of water is presented as a function of the box humidity grade. In the vapor saturated atmosphere the sample increased its weight to about 33% (which represents 27 wt% of water). Part of this water is deposited on the surface of the sample, forming a water-film. We estimated that the maximum amount of water that the compound adsorbs into its bulk is about 17 wt% (which means xIL = 0.2; i.e., four molecules of water for each sulfate ion). As can be observed in Fig. 3(a), the relationship between the water composition in wt% and the humidity grade is roughly parabolic. The obtained deviations could be due to the elevated response time of the IL to adsorb or lose water compared to that of the hygrometer. Once the sample is in the liquid crystalline rigid-gel state, its weight remained nearly constant when exposed to the atmosphere for 5 months, as observed in Fig. 3(b), where the same sample was left open in the laboratory and weighted daily. It is important to note that the hydration process is completely reversible as observed in Fig. 3(c). In this figure, we can observe the time evolution of the water percentage (at left) and the water molar fraction (at right) for a completely hydrated sample (which had adsorbed water up to 27 wt% of the sample) after leaving it in a dry box (with plenty of silica gel and a humidity grade below 10%). In less than 24 h, the IL loses all adsorbed water and its weight equals to that it had five months prior (and clearly it transitions back to liquid state). A complete phase diagram of the temperature-composition is shown in Fig. 4, in which circles correspond to [EMIm][DSO4] and triangles correspond to [EMIm][OSO4], which has already been published and included for comparison.1 The transition temperature, TG, denoted with the open symbols, is up to 60 °C higher for the decyl than for the octyl sulfate at xIL ≈ 0.2 (which is the composition where TRG is higher for both ILs). At 25 °C, the water content of [EMIm][DSO4] mixture must be roughly between 4 wt% and 40 wt% to obtain the sample in the rigid-gel state, which represents a water molar fraction between 0.6 and 0.9. In contrast, [EMIm][OSO4] is not in the rigid-gel state at any water composition at 25 °C. Fig. 4 also shows melting points, Tm (clear filled symbols), and solidification points, TS (dark filled symbols), for compositions, where those temperatures were above −25 °C (the minimum temperature reached by the thermostatic bath used). As observed, values for Tm and TS are roughly the same for both ILs in the highly diluted regime (xIL ≤ 0.05).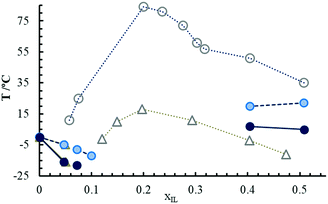 | ||
| Fig. 4 Phase diagram of [EMIm][OSO4]1 (triangle symbols) and [EMIm][DSO4] (circles). Open symbols represent the liquid to quasi-gel transition temperature, TG, light filled ones the melting point, Tm, and dark filled symbols the solidification temperature, TS. | ||
Thermal gravimetrical analysis, TGA, at 5 °C min−1 heating rate on a 63.5 mg sample that included 12 wt% of water was performed. The resultant curve shows that sample lost weight on heating and became anhydrous at about 200 °C. The onset of decomposition (or evaporation) appears at about 300 °C. The corresponding curve appears in the ESI.†
Microstructure
The Fourier Transformed Infrared (FTIR) spectra for the pure [EMIm][DSO4] and for the sample hydrated with 10 wt% of water at room temperature (about 22 °C) is shown in Fig. 5. The obtained peaks indicate the presence of the [EMIm] cation (ring stretching at the wave number k = 1570 cm−1 and bending in k = 1450 cm−1),31 and the sulfate anion (stretching at k = 1140 and 990 cm−1, and bending at k = 600 cm−1).31 In addition, the peaks corresponding to water (1650 cm−1 for bending and 3500 cm−1 for stretching)32 are observed in the hydrated sample. Except for these last peaks, all other peak positions for both samples are identical (the peak heights, as usual, is arbitrary).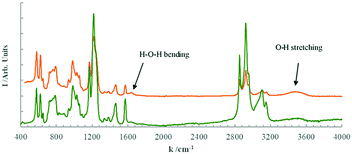 | ||
| Fig. 5 FTIR spectra of the pure [EMIm][DSO4] (bottom green line) and that hydrated with 10 wt% of water (top orange line) at 22 °C. | ||
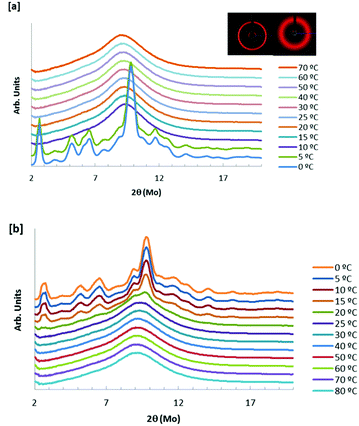
Fig. 6 shows the 1D X-ray diffractograms of a 7 wt% hydrated sample of [EMIm][DSO4] (xIL ∼ 0.4) at different temperatures from 0 °C to 80 °C following the isothermal method explained above. On cooling (Fig. 6(a)), the crystalline character appears abruptly between 5 °C and 7 °C. When the sample is heated (Fig. 6(b)), the crystal phase begins to disappear at 5 °C, but this phase change from crystal to the mesomorphic phase is progressive, such that at 20 °C, a crystal signal is still present. The unit cell for the crystal phase, calculated from the data at 0 °C, corresponds to a P2/m monoclinic class with cell parameters a = 19.7 Å, b = 10.2 Å and c = 15.2 Å and angles α = γ = 90° and β = 115°. As shown in Fig. 6, two of the Debye circles obtained from X-ray diffraction are also included: one on the left for the solid crystal (T = 0 °C) and the other on the right for the rigid-gel state (T = 40 °C). Only the coldest sample shows a crystal diffraction pattern. The thermal hysteresis that this IL undergoes is clearly observed in Fig. 6. This effect is typical for the majority of pure ILs and it is also observed with ionic conductivity measurements.33 From Fig. 6, we can also conclude that 1D X-ray analysis does not reveal the microstructure of the rigid-gel state as the diffractograms of this phase are similar to that of the liquid (above 50 °C for the sample used).
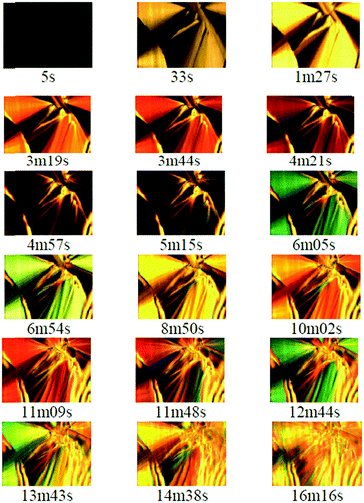
Fig. 7 shows the temporal evolution of the microstructure through micrographs obtained using white polarized light microscopy of the pure sample on adsorbing moisture at room temperature. The observed microstructure (with clear striped cone forms) resembles that of a liquid crystal and both patterns are characteristic of a smectic (also called exatic) B phase34 although more techniques must be performed to verify the given mesostructure in the rigid-gel state. As we pointed out recently, this phase is probably formed due to two effects: first, the tendency to form micelles of the long alkyl sulfate anions, with their head forming H-bonds with water molecules;35 second, the chromonic character of the imidazolium ring, which tends to stack, forming columns due to the interaction of the adjacent π-clouds of these aromatic cations.11 As published earlier,2 when thermal agitation is low enough, T < TG, the long tubular micelles begins to bond, forming hexagonal HI mesostructures. This formation process is completed when T < TRG, all micelles are packed, and the sample does not flow under gravity; despite these changes, the ionic conductivity is preserved.
The change in colour observed over time is due to the variation in the local birefringence of the sample.36 The observed colour sequence, if compared to the Michel-Levy colour chart for ordered birefringent media,37 suggests that there is an increase in birefringence associated with the slow incorporation of water into the structure. The change in birefringence may be due to modification of extreme, ordinary (no) and extraordinary (ne), refractive index values of the domain and also due to changes in the direction of the optical axis, which involves changes in the velocity of the extraordinary wave, even though the refractive index did not change. The direction of the optical axis is determined by the orientation of the amphiphilic IL anions, which undergo important changes during the process of water absorption. However, the effect of the modification to the thickness of the open sample during water-incorporation must also be considered along with the possible modification of the surface optical properties associated with the adsorption of water molecules at the air–liquid interface.
In relation to this, we can observe that after 6 min, the previous well-defined structure is deformed and less-sharp domains appear. We believe that a thin film of adsorbed water may be the cause of this distortion since it induces new boundary conditions that force the ordering of the IL anion chains into a slab close to the free interface. In addition to the effect of water adsorption on the birefringence, we must also consider the variation of the response of the dielectric constant in the liquid regions of the gel that is associated with local fluctuations of the ionic concentration with water addition.38 This effect leads to an increase in the dielectric constant with an increase in water concentration. Similar domains are also observed when the aqueous mixture is sandwiched between two microscope slices.
Physical properties
As mentioned above, the temperature behaviour of some physical properties (ionic conductivity, density and viscosity) of the pure [EMIm][DSO4] sample were measured along with the ionic conductivity of the two hydrated samples with xIL = 0.317 (10 wt% of water) and with xIL = 0.075 (39 wt% of water). The results for the ionic conductivity between 0 °C and 100 °C for the three samples are plotted in Fig. 8, while Table S1 shows the corresponding numerical data (see ESI†). As expected from previous results,39 ionic conductivity increases greatly when the IL is mixed with water (about one order of magnitude higher for sample with 10 wt% water content, and two orders of magnitude for that with 39 wt% water, both relative to the pure sample). As usual, in the liquid and rigid-gel states the temperature behaviour of the ionic conductivity follows a Vogel Tamman Fulcher (VTF) type curve for the three samples measured,1,2,40 which reads| κ = κ∞e−Bκ/(T−TV) | (1) |
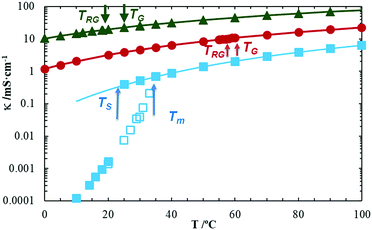 | ||
| Fig. 8 Three series showing temperature behaviour of the ionic conductivity of the pure [EMIm][DSO4] (blue square, when cooling with open symbols and while heating with filled ones); hydrated with 10 wt% of water (red circles); and 39 wt% of water (green triangles). Vertical arrows mark, for the pure sample, its melting (Tm) and solidification (TS) temperatures. For hydrated samples arrows show liquid to quasi-gel (TG) and to rigid-gel (TRG) transition temperatures. Solid lines are the best fit of a VTF eqn (1) of the corresponding experimental data above the melting temperature. | ||
The resulting best fit curves are plotted in Fig. 8, using the obtained fitting parameters listed in Table 1 with the corresponding standard deviation of each fit, s. The pure sample shows the typical hysteresis loop due to different values of its melting and solidification temperatures as observed with X-ray diffraction. This loop marks the melting point (at Tm = 33 °C obtained from increasing temperature) and the crystallization point (at TS = 22 °C when temperature is decreased); both temperatures are marked with a blue arrow in Fig. 8. As discussed before, this fact is due to the ability of ILs to exist in an undercooled stable liquid state (or rigid-gel for our aqueous mixtures).1,33 To determine whether the undercooled liquid is a transitory state, we left the pure sample at 30 °C (from liquid state) for more than 24 h, and examined it later at the same temperature but from the solid crystal state.
| Sample | η ∞/mPa s | B η /K−1 | T η /K | s/mPa s | κ ∞/S m−1 | B κ /K−1 | T κ /K | s/S m−1 |
|---|---|---|---|---|---|---|---|---|
| Pure | 0.0924 | 1248.3 | 160.6 | 0.036 | 31.3 | 691 | 195.4 | 0.002 |
| 10 wt% | — | — | — | — | 45.3 | 593 | 172.3 | 0.010 |
| 39 wt% | — | — | — | — | 72.1 | 475 | 161.3 | 0.013 |
Each sample was in the same state as their initial state the following day as shown in Fig. 2 (left and middle photographs). For the hydrated samples, we observed that the ionic conductivity does not change its temperature behaviour during the transition between the isotropic (liquid) to the mesomorphic (quasi-gel) states (at TG = 60 °C for 10 wt% hydrated sample and TG = 25 °C for that with 39 wt% water, both for increasing and decreasing temperatures). In addition, no change in ionic conductivity and VTF behaviour is observed for the quasi-gel to rigid-gel transitions (at TRG = 57 °C for 10 wt% hydrated sample and TRG = 19 °C for that with 39 wt% of water, also both for increasing and decreasing temperatures). This behaviour, also observed for aqueous mixtures of [EMIm][OSO4], is in contrast with the drop in ionic conductivity observed for other soft matter systems based in ILs, where a sharp drop of this magnitude is observed when a quasi-solid phase appears.25,42 The absence of conductivity change in the isotropic–mesomorphic transition does not adapt to the usual theory of ionic charge transport as provided in the literature regarding electrochemistry, which implies that there is an ionic displacement between both electrodes following the Nerst–Einstein equation. A 1D cationic mechanism of charge transport43 appears to be more plausible for the hydrated sample both in the rigid-gel and in the liquid states. This charge transport mechanism has been proposed by our group for the parent compound [EMIm][OSO4]2 although more experiments are needed to completely elucidate its true nature.
As shown in Fig. 9, the temperature dependence of the viscosity (solid symbols in the left axis) and density (open symbols in the right axis) of the pure [EMIm][DSO4] in liquid state are shown. The corresponding measured experimental values are provided in Table S2 of ESI.† As observed, the density follows a linear behaviour with temperature and thus
| ρ/kg m−3 = 1117.1 − 0.663T/°C. | (2) |
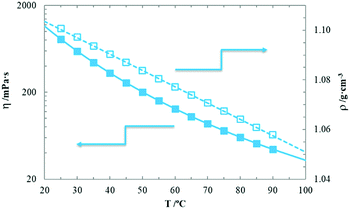 | ||
| Fig. 9 Viscosity (solid symbols) and density (open symbols) vs. temperature of the pure sample. Lines are the best fits of a straight line for density and the VTF eqn (3) for viscosity. | ||
Viscosity follows a VTF-like curve as do the majority of ILs.2,41
| η = η∞eBη/(T−T0), | (3) |
The corresponding curves are plotted in Fig. 9, while the corresponding fitting parameters are included in Table 1, with its standard deviation. The results agree with those recently published for other members of the [EMIm] alkyl sulfate family.41 We have not measured viscosity for the hydrated samples because in the mesomorphic states, our apparatus is not appropriate. Comparing fluidity (null at laboratory conditions) and ionic conductivity curves in the rigid-gel state of the hydrated samples, it can be deduced that charge mobility is completely independent of fluidity, which contradicts Walden's rule that relates these two magnitudes and is generally followed by the majority of electrolytes (including ILs).2,41,44 Similar decoupling of ionic conductivity from structural dynamics was recently observed for polymerized ionic liquids.17,25,43,45 In these papers, the authors suggested that the anion moves freely in the rigid network formed by the cation (which is the moiety with long alkyl chain in the IL compounds they study). In a similar manner, the long alkyl chained [DSO4] anions do not have sufficient mobility to transport charge due to their size; thus, the charge is carried primarily by the much smaller [EMIm] cations even in the pure compound as it was suggested previously for alkyl sulfate based ILs with chains longer than seven carbon atoms.41 When water was added, the anions become fixed and formed micelles due to their lyotropic character (which forms a maximum of four H-bonds between each of the four oxygen atoms of the sulfate with a water molecule);35 these micelles take a tubular form due to the chromonic character of imidazolium cations.11 Thus, while anions are fixed, cations can still move on the surface of such tubular micelles due to their poor coordination with anions through the water molecules. When the mesomorphic state is formed, these micelles aggregate to form a liquid-crystalline HI mesostructure2,34 randomly oriented within micro-domains. Unexpectedly, charge transport of cations is unaltered and hence, the ionic conductivity does not change its behaviour during the phase transition. In the pure sample, when crystallization is achieved below TS, [EMIm] cations become anchored in an ionic network to form a solid crystal. As a consequence, the ionic conductivity value sharply decreases (more than an order of magnitude). The crystallization process is quite slow and thus, to obtain accurate values of the measured ionic conductivity, we must wait for a long time to stabilize the sample (up to three hours, just below TS). Diffusion measurements of both anions and cations in the isotropic and mesomorphic states would surely clarify the 1D charge transport model that has been suggested.
Conclusions
Synthesis and physical properties of a new ionic liquid, 1-ethyl-3-methylimidazolium decyl sulfate, are described. This compound has the ability of transitioning to a rigid-gel state at room temperature when it naturally adsorbs moisture from the atmosphere. The amount of adsorbed water depends on the humidity grade (h.g.), but it is about 10 wt% in the hydrated sample at laboratory conditions (h.g. about 60%). The synthesis process and the microstructure characterization using NMR, MS, FTIR, X-ray diffraction, TGA and polarized micrographs are presented. In addition, we included the temperature-composition phase diagram of this compound. Finally, experimental measurements of its temperature-dependent ionic conductivity, density and viscosity are also included for the pure sample. The ionic conductivity of two different aqueous mixtures is also included. A mesostructure model is presented to explain the obtained data. This compound reopens the important question about the relationship between charge and mass transport in quasi-solid conductors. In a rigid-gel state fluidity is null, while conductivity is relatively high, contrarily to that observed for the majority of ILs (and their aqueous mixtures) in the liquid state, where fluidity and conductivity are related through the Walden rule.Conflicts of interest
There are no conflicts to declare.Acknowledgements
The authors are grateful to the UDC technician Manuel Cabanas for some of the great quality measurements he performed. Also, we acknowledge Susana Yáñez for resolving the X-ray data. O. C. acknowledges Ana Gras for her continuous support. This work was financed by MINECO from the Spanish Government (Grants No. MAT2014-57943-C3-1-P, MAT2014-57943-C3-2-P, MAT2014-57943-C3-3-P and DPI2012-38841-C02-02), by the European Union (COST Action CM 1206) and by the Galician Network on Ionic Liquids, REGALIs (CN 2014/015). Research projects have been co-financed by the European Regional Development Fund (FEDER).References
- O. Cabeza, J. Vila, E. Rilo, M. Domínguez-Pérez, L. Otero-Cernadas, E. López-Lago, T. Méndez-Morales and L. M. Varela, J. Chem. Thermodyn., 2014, 75, 52 CrossRef CAS.
- O. Cabeza, L. Segade, M. Domínguez-Pérez, E. Rilo, S. García-Garabal, D. Ausín, A. Martinelli, E. López-Lago and L. M. Varela, J. Chem. Thermodyn., 2017, 112, 267 CrossRef CAS.
- Ionic Liquids, Industrial Applications to Green Chemistry, ed. R. K. Rogers and K. R. Seddon, ACS Symp. Series 818, Am. Chem. Soc., Washington, 2002 Search PubMed.
- T. Inoue, H. Ebina, B. Dong and L. Zheng, J. Colloid Interface Sci., 2007, 314, 236 CrossRef CAS PubMed.
- S. T. Hyde, Handbook of Applied Surface and Colloid Chemistry, 2002, vol. 2, p. 299 Search PubMed.
- M. A. Firestone, J. A. Dzielawa, P. Zapol, L. A. Curtiss, S. Seifert and M. L. Dietz, Langmuir, 2002, 18, 7258 CrossRef CAS.
- H. Kaper and B. Smarsly, Z. Phys. Chem., 2009, 220, 1455 CrossRef.
- O. Russina, L. Gontrani, B. Fazio, D. Lombardo, A. Triolo and R. Caminiti, Chem. Phys. Lett., 2010, 493, 259 CrossRef CAS.
- O. Russina and A. Triolo, Faraday Discuss., 2012, 154, 97 RSC.
- O. Russina, F. Lo Celso, N. V. Plechkova and A. Triolo, J. Phys. Chem. Lett., 2017, 8, 1197 CrossRef CAS PubMed.
- A. F. Kostko, B. H. Cipriano, O. A. Pinchuk, L. Ziserman, M. A. Anisimov, D. Danino and S. R. Raghavan, J. Phys. Chem. B, 2005, 109, 19126 CrossRef CAS PubMed.
- M. Armand, F. Endres, D. R. MacFarlane, H. Ohno and B. Scrosati, Nat. Mater., 2009, 8, 621 CrossRef CAS PubMed.
- Electrochemical aspects of Ionic Liquids, ed. H. Ohno, Wiley and Sons, New Jersey, 2011 Search PubMed.
- M. Díaz, A. Ortiz and I. Ortiz, J. Membr. Sci., 2014, 469, 379 CrossRef.
- T.-Y. Wu, S.-G. Su, S.-T. Gung, M.-G. Lin, Y.-C. Lin and C.-A. Lai, Electrochim. Acta, 2010, 55, 4475 CrossRef CAS.
- A. Noda and M. Watanabe, Electrochim. Acta, 2000, 45, 1265 CrossRef CAS.
- P. Vidinha, N. M. T. Lourenço, C. Pinheiro, A. R. Brás, T. Carvalho, T. Santos-Silva, A. Mukhopadhyay, M. J. Romaô, J. Parola, M. Dionisio, J. M. S. Cabral, C. A. M. Afonso and S. Barreiros, Chem. Commun., 2008, 5842 RSC.
- S. Doherty, J. G. Knight, J. R. Ellison, P. Goodrich, L. Hall, C. Hardacre, M. J. Muldoon, S. Park, A. Ribeiro, C. A. Nieto de Castro, M. J. Lourenço and P. Davey, Green Chem., 2014, 16, 1470 RSC.
- A. Sharma, K. Rawat, P. R. Solanki and H. B. Bohidar, Int. J. Biol. Macromol., 2017, 95, 603 CrossRef CAS PubMed.
- K. Rawat, J. Pathak and H. B. Bohidar, Soft Matter, 2014, 10, 862 RSC.
- A. Hussain, A. T. S. Semeano, S. I. C. J. Palma, A. S. Pina, J. Almeida, B. F. Medrado, A. C. C. S. Pádua, A. L. Carvalho, M. Dionísio, R. W. C. Li, H. Gamboa, R. V. Ulijn, J. Gruber and A. C. A. Roque, Adv. Funct. Mater., 2017, 27, 1700803 CrossRef PubMed.
- N. Yoshimoto, T. Shirai and M. Morita, Electrochim. Acta, 2005, 50, 3866 CrossRef CAS.
- M. Cai, Y. Liang, F. Zhou and W. Liu, J. Mater. Chem., 2011, 21, 13399 RSC.
- M. Bielejewski, M. Ghorbani, M. A. Zolfigol, J. Tritt-Goc, S. Noura, M. Narimani and M. Oftadeh, RSC Adv., 2016, 6, 108896 RSC.
- A. S. Shaplov, R. Marcilla and D. Mecerreyes, Electrochim. Acta, 2015, 175, 18 CrossRef CAS.
- O. Cabeza Gras, E. Tojo Suarez, M. Vilas Aguete and L. Varela Cabo, ES2553903, 2016.
- M. Ghorbani, S. Noura, M. Oftadeh, E. Gholami and M. A. Zolfigol, RSC Adv., 2015, 5, 55303 RSC.
- S. Mahajan and I. P. Singh, Magn. Reson. Chem., 2013, 51, 76 CAS.
- E. Gómez, B. González, N. Calvar, E. Tojo and A. Domínguez, J. Chem. Eng. Data, 2006, 51, 2096 CrossRef.
- S. Cuadrado-Prado, M. Domínguez-Pérez, E. Rilo, S. García-Garabal, L. Segade, C. Franjo and O. Cabeza, Fluid Phase Equilib., 2009, 278, 36 CrossRef CAS.
- O. Hofft, S. Bahr and V. Kempter, Langmuir, 2008, 24, 11562 CrossRef CAS PubMed.
- S. C. B. Myneni, S. J. Traina, G. A. Waychunas and T. J. Logan, Geochim. Cosmochim. Acta, 1998, 62, 3499 CrossRef CAS.
- J. Vila, B. Fernández-Castro, E. Rilo, J. Carrete, M. Domínguez-Pérez, J. R. Rodríguez, M. García, L. M. Varela and O. Cabeza, Fluid Phase Equilib., 2012, 320, 1 CrossRef CAS.
- P. J. Collings and M. Hird, Introduction to Liquid Crystals: Chemistry and Physics, CRC Press, London, 1997 Search PubMed.
- T. Singh, M. Drechsler, A. H. E. Müeller and I. Mukhopadhayay, Phys. Chem. Chem. Phys., 2010, 12, 11728 RSC.
- M. Born and E. Wolf, Principles of Optics, Pergamon Press, 4th edn, 1970 Search PubMed.
- M. Lévy, Eur. J. Mineral., 2013, 25, 5 CrossRef.
- A. Levy, D. Andelman and H. Orland, Phys. Rev. Lett., 2012, 108, 227801 CrossRef PubMed.
- J. Vila, P. Ginés, E. Rilo, O. Cabeza and L. M. Varela, Fluid Phase Equilib., 2006, 247, 32 CrossRef CAS.
- J. Vila, P. Ginés, J. M. Pico, C. Franjo, E. Jiménez, L. M. Varela and O. Cabeza, Fluid Phase Equilib., 2006, 242, 141 CrossRef CAS.
- S. García-Garabal, J. Vila, E. Rilo, M. Domínguez-Perez, L. Segade, E. Tojo, P. Verdía, L. M. Varela and O. Cabeza, Electrochim. Acta, 2017, 231, 94 CrossRef.
- M. Figueira-González, V. Francisco, L. García-Río, E. F. Marques, M. Parajó and P. Rodríguez-Dafonte, J. Phys. Chem. B, 2013, 117, 2926 CrossRef PubMed.
- H. Shimura, M. Yoshio, K. Hoshino, T. Mukai, H. Ohno and T. Kato, J. Am. Chem. Soc., 2008, 130, 1759 CrossRef CAS PubMed.
- C. A. Angell, Y. Ansari and Z. Zhao, Faraday Discuss., 2012, 154, 9 RSC.
- J. R. Sangoro, C. Iacob, A. L. Agapov, Y. Wang, S. Berdzinski, H. Rexhausen, V. Strehmel, C. Friedrich, A. P. Sokolov and F. Kremer, Soft Matter, 2014, 10, 3536 RSC.
Footnote |
| † Electronic supplementary information (ESI) available. See DOI: 10.1039/c7qm00510e |
| This journal is © the Partner Organisations 2018 |

