Crystalline–amorphous Co@CoO core–shell heterostructures for efficient electro-oxidation of hydrazine†
Xiaodong
Yan‡
 a,
Yuan
Liu‡
b,
Jinle
Lan
 c,
Yunhua
Yu
c,
James
Murowchick
d,
Xiaoping
Yang
*c and
Zhonghua
Peng
c,
Yunhua
Yu
c,
James
Murowchick
d,
Xiaoping
Yang
*c and
Zhonghua
Peng
 *a
*a
aDepartment of Chemistry, University of Missouri – Kansas City, Kansas City, Missouri 64110, USA. E-mail: PengZ@umkc.edu
bState Key Lab of New Ceramics and Fine Processing, School of Materials Science and Engineering, Tsinghua University, Beijing 100084, China
cState Key Laboratory of Organic–Inorganic Composites, Beijing University of Chemical Technology, Beijing 100029, China. E-mail: yangxp@mail.buct.edu.cn
dDepartment of Geosciences, University of Missouri – Kansas City, Kansas City, Missouri 64110, USA
First published on 31st October 2017
Abstract
Metal–metal oxide core–shell heterostructures have exhibited outstanding performances in many realms, especially in catalysis, due to enriched phase interfaces and strong metal/metal oxide interactions. Herein, Co@CoO core–shell heterostructures with a crystalline Co core and an amorphous CoO shell have been prepared using a simple solution reduction process and shown to be effective catalysts for the electro-oxidation of hydrazine in alkaline media. The synergistic effect between the crystalline metallic Co core and the amorphous CoO shell leads to a small onset potential of −1.10 V vs. Ag/AgCl. In addition, the Co@CoO electrode has been shown to exhibit good long-term catalytic stability.
1. Introduction
Surface properties of a solid are contingent on the local structures near the surface regions that play a critical role in surface reactions,1–3 such as electro-catalysis, photo-catalysis and surface energy storage. Tuning the structure of the existing materials can thus potentially enhance their inherent properties, and may even add new functional properties to them.3–21 For example, it has been shown that deliberately introducing an amorphous surface layer on TiO2 nanocrystals extends its optical absorption from ultraviolet to visible spectrum with enhanced photocatalytic activity6 and can also lead to strong microwave absorption.7,8 Partially amorphized MnMoO4 by hydrogenation treatment shows markedly higher catalytic activity towards the hydrogen evolution reaction and a 17-fold increase in specific capacitance as compared to MnMoO4 crystals.9 Incorporation of a small number of heteroatoms (e.g. Fe, Co, and Ni) into the framework of metal sulfides can promote the catalytic activity for the hydrogen evolution reaction by reducing the kinetic energy barrier of H atom adsorption.12,13 Electrochemical tuning enables olivine-type lithium transition-metal phosphates to have high catalytic activity towards water electrolysis due to the increase in active site density, valency of the transition metal centers, and covalent hybridization between the M-3d and O-2p states.14 Multi-shelled hollow structures have recently been attracting much attention owing to their unique architectures and highly tunable properties.15–19 For instance, the capacitance of multi-shelled manganese oxide (Mn2O3) hollow microspheres is tunable by manipulating the shell number.18Another strategy to promote surface reactions is to control the phase composition in the bulk or introduce phase interfaces near the surface regions where surface reactions occur.22–38 For instance, compared to single-phase catalysts, both metallic and non-metallic alloys are believed to have higher intrinsic activity towards hydrogen evolution22–24 and electro-oxidation of hydrazine.25–27 Improved photocatalytic activity is also observed in biphasic TiO2 nanocrystals owing to the enhanced charge separation driven by the difference in band gaps of different TiO2 phases.28,29 Recently, introducing phase interfaces near the surface regions of solid materials has been of great interest due to the unique physicochemical properties of the phase interface.31–39 Among them, core–shell heterostructures have attracted more and more attention.20,33–38,40 For example, Ru@Pt core–shell nanoparticles show an unprecedentedly low light-off temperature (35°) for preferential oxidation of carbon monoxide in hydrogen.33 Ni@NiO and Co@Co3O4 core–shell heterostructures present outstanding catalytic activity towards hydrogen evolution,34–36 as the metal/oxide interface can promote water dissociation and hydrogen adsorption.30 Similarly, Au@Co3O4 and NiFe@NiFeOx core–shell nanocrystals demonstrate enhanced catalytic activity towards the oxygen evolution reaction owing to the synergistic effect provided by the core–shell structure.37,38
We are interested in developing efficient catalysts for direct hydrazine fuel cells. Although metal–metal oxide core–shell structures have shown enhanced catalytic activity for water reduction (hydrogen evolution) and oxidation (oxygen evolution), to the best of our knowledge, such core–shell structures have not been explored as catalysts for the electro-oxidation of hydrazine. There has been a previous report showing that a Pd/WO3 composite film, as compared to a Pd film, facilitates electro-oxidation of hydrazine,39 pointing to the beneficial effect of metal/metal oxide interfaces on hydrazine electro-oxidation. We thus speculate that a metal–metal oxide core–shell nanostructure could further enhance the electro-oxidation of hydrazine owing to larger interface areas and stronger metal/oxide interactions. Among the relatively inexpensive first-row transition metals, metallic Co stands out because of its lower overpotential towards electro-oxidation of hydrazine than metallic Ni and Cu.25,27,41–43 Therefore, a cobalt–cobalt oxide core–shell structure is anticipated to offer high catalytic activity. Herein, we report the preparation of Co@CoO core–shell nanostructures with a crystalline Co core and an amorphous CoO shell, and show that the resulting Co@CoO core–shell structures are highly active catalysts towards electro-oxidation of hydrazine.
2. Experimental section
2.1. Material synthesis
2.2. Property characterization
Morphologies of the samples were examined using scanning and transmission electron microscopy (SEM and TEM). The SEM images were collected using a field emission scanning electron microscope (Supra55, Carl Zeiss). The TEM analyses were conducted on a high-resolution transmission electron microscope (HRTEM, Tecnai G2 F30 S-TWIN) equipped with a scanning transmission electron microscope. The electron accelerating voltage for the transmission electron microscope was 200 kV. Structural analysis was performed with the collected Co(OH)x(CO3)0.5(2−x) powder on a wide-angle X-ray diffractometer (WAXD, D8 Advance, Bruker) using Cu Kα radiation (wavelength = 1.5418 Å). The elemental composition and chemical status of the electrodes were analyzed using X-ray photoelectron spectroscopy (XPS, EscaLab 250, Thermo Fisher Scientific) with monochromatic Al X-ray (hν = 1486.6 eV) as the excitation source.2.3. Electrochemical characterization
Electrochemical measurements were carried out in a three-electrode system at room temperature. A Pt wire and an Ag/AgCl electrode were used as the counter and the reference electrode, respectively. Typically, 0.5 M N2H4 aqueous solution with 1.0 M KOH was used as the electrolyte. Linear sweep voltammetry was conducted at a scan rate of 5 mV s−1 to evaluate the catalytic performance of the working electrode. A long-term stability test was carried out by cyclic voltammetry in the voltage range from −1.1 to −0.9 V vs. Ag/AgCl with repeated scans at a scan rate of 20 mV s−1.3. Results and discussion
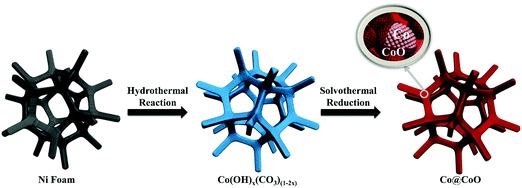
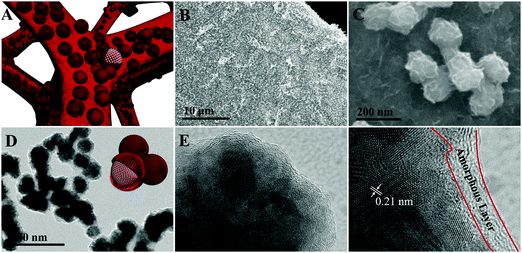
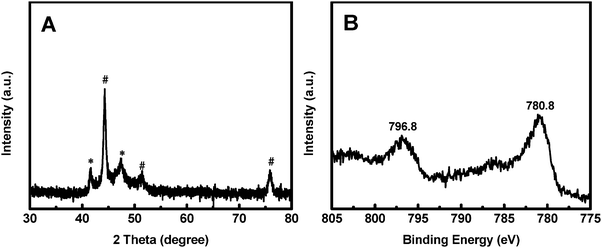
The synthesis process of the Co@CoO electrode is schematically shown in Fig. 1. First, the Co(OH)x(CO3)0.5(2−x) nanosheets were grown on Ni foam (Fig. S1, ESI†) through a hydrothermal reaction. Then the Co@CoO core–shell heterostructure was achieved by simply reducing the Co(OH)x(CO3)0.5(2−x) nanosheets in the presence of KOH and NaBH4 in ethylene glycol at 180 °C. Fig. 2A schematically shows the three-dimensional structure of the Co@CoO core–shell heterostructure on Ni foam with one particle showing the Co@CoO core–shell structure as a representative. Note that we simplified the structure in the schematic illustration. Fig. 2B and C display the SEM images of the Co@CoO heterostructures. Obviously, the nanosheet morphology of Co(OH)x(CO3)0.5(2−x) evolved into sphere-like morphology of Co@CoO after the solvothermal reduction process. Magnified SEM (Fig. 2C) and TEM (Fig. 2D) images show that the sphere-like Co@CoO is relatively uniform in size. HRTEM images (Fig. 2E and F) reveal the crystalline core and amorphous shell structures. The core shows clear lattice fringes, while the shell presents amorphous feature (Fig. 2F). Additionally, the crystalline core is composed of crystals of different orientations, indicating the polycrystalline nature of the core. The d-spacing of 0.21 nm corresponds to the (100) plane of metallic cobalt (JCPDS 05-0727), indicating crystalline Co as the core. The amorphous layer has an average thickness of ∼4 nm.XRD and XPS characterization were conducted to analyze the phase composition and surface chemical states, respectively, of Co@CoO. Fig. 3A shows the XRD pattern of Co@CoO. Only signals from metallic Co were observed. This agrees well with the HRTEM characterization. It is worth noting that the crystalline metallic Co core is composed of two different phases: a cubic phase (JCPDS 15-0806) and a hexagonal phase (JCPDS 05-0727). The average grain size was calculated to be ∼9 nm using Scherrer's equation: d = (kλ)/(β![[thin space (1/6-em)]](https://www.rsc.org/images/entities/char_2009.gif) cos
cos![[thin space (1/6-em)]](https://www.rsc.org/images/entities/char_2009.gif) θ), where k is the shape factor with a typical value of 0.9, λ is the X-ray wavelength, β is the full width at half maximum, θ is the Bragg angle and d is the grain size. The XPS survey spectrum suggested the presence of Co and O (Fig. S2a, ESI†). Ni was not detected (Fig. S2a and b, ESI†), indicating the absence of Ni in Co@CoO. Fig. 3B displays the Co 2p core-level XPS spectrum, which was calibrated with the C 1s peak (284.6 eV). Two typical primary peaks at 796.8 eV (Co 2p1/2) and 780.8 eV (Co p3/2) were observed, corresponding to the signals from the Co2+ ions in CoO.44–46 This confirms CoO as the amorphous surface layer on the crystalline Co core.
θ), where k is the shape factor with a typical value of 0.9, λ is the X-ray wavelength, β is the full width at half maximum, θ is the Bragg angle and d is the grain size. The XPS survey spectrum suggested the presence of Co and O (Fig. S2a, ESI†). Ni was not detected (Fig. S2a and b, ESI†), indicating the absence of Ni in Co@CoO. Fig. 3B displays the Co 2p core-level XPS spectrum, which was calibrated with the C 1s peak (284.6 eV). Two typical primary peaks at 796.8 eV (Co 2p1/2) and 780.8 eV (Co p3/2) were observed, corresponding to the signals from the Co2+ ions in CoO.44–46 This confirms CoO as the amorphous surface layer on the crystalline Co core.
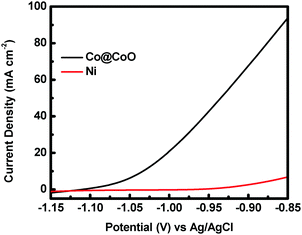
The catalytic activity of the crystalline–amorphous Co@CoO core–shell heterostructure towards electro-oxidation of hydrazine was evaluated in a typical three-electrode system with 1.0 M KOH + 0.5 M N2H4 as the electrolyte. Fig. 4 shows the polarization curves of the Co@CoO electrode. For comparison, the polarization curve of bare Ni foam is included. The bare Ni foam showed a small oxidation current density of 2.6 mA cm−2 at −0.90 V vs. Ag/AgCl, while the Co@CoO electrode delivered a remarkably high current density of 67.6 mA cm−2 at −0.90 V vs. Ag/AgCl. In addition, the Co@CoO electrode presented a very low onset potential of −1.10 V vs. Ag/AgCl, which is among the lowest reported in the literature for electro-oxidation of hydrazine (Table 1). These results confirm the high catalytic activity of the Co@CoO core–shell structure towards hydrazine oxidation. It has been reported that copper hydroxide/oxide layers in situ formed on the Cu nanocubes play an important role in enhancing the catalytic activity of the catalyst towards electro-oxidation of hydrazine.47 The high catalytic activity of the Co@CoO catalyst is thus attributed to the synergistic effect between the crystalline Co core and the amorphous CoO shell. That is, the interface regions offer the highest activity. The metallic Co core likely acts as the electron reservoir for fast transfer of electrons from hydrazine to the catalyst electrode while the Co2+ sites on the amorphous CoO shell promote the adsorption of OH− due to the strong electrostatic affinity to the positively charged Co2+ species and more unfilled d orbitals in Co2+ species than metallic Co.34,48 It has been proposed that the adsorption of OH− is the first step in the electro-oxidation of hydrazine49 and that the initial one-electron transfer between N2H4 and OH− (N2H4ads + OH− → N2H3 + H2O + e−) is the rate-determining step.47,50 Therefore, the fast charge transfer and the enhanced adsorption of OH− collectively accelerate the hydrazine oxidation reaction on the surface of the Co@CoO catalyst.
| Sample | Electrolyte | v (mV s−1) | Con. of N2H4 (M) | Onset potentiala (V) | Ref. |
|---|---|---|---|---|---|
| a All the potentials are relative to Ag/AgCl. | |||||
| Ni60Co40 alloy | 1.0 M KOH | 20 | 0.1 | −1.17 | 25 |
| Co | 1.0 M KOH | 20 | 0.1 | −1.06 | 27 |
| Ni nanoflowers on Ni foam | 3.0 M KOH | 1 | 0.5 | −1.05 | 41 |
| Cu Nanowires on Cu foil | 3.0 M NaOH | 25 | 1.0 | −0.82 | 42 |
| Cu film on Cu foil | 3.0 M NaOH | 5 | 1.0 | −0.76 | 43 |
| Nano-on-microsized Cu | 1.0 M KOH | 10 | 0.5 | −1.10 | This work |
| 2.0 M KOH | 10 | 0.5 | −1.13 | This work | |
The effect of KOH concentration on the catalytic performance was studied at a fixed N2H4 concentration of 0.5 M. Fig. 5A displays the polarization curves of the Co@CoO electrode at different KOH concentrations. The catalytic performance improved significantly with increasing KOH concentration. For example, the onset potential for hydrazine oxidation on the Co@CoO electrode was −1.07 V vs. Ag/AgCl in 0.5 M KOH; a negative shift of the onset potential was observed when the KOH concentration increased to 1.0 M; the onset potential shifted to a more negative value of −1.13 V vs. Ag/AgCl as the KOH concentration further increased to 2.0 M. These findings suggest that the hydrazine electro-oxidation reaction is highly dependent on the concentration of OH−, which agrees well with the previous assertion that OH− plays a critical role in breaking hydrazine into nitrogen and water during the electro-oxidation of hydrazine in alkaline media.47,49,50 The effect of N2H4 concentration on the catalytic performance was also evaluated at a fixed KOH concentration of 2.0 M. Fig. 5B shows the polarization curves of the Co@CoO electrode at varying N2H4 concentrations. Up to N2H4 concentration of 0.5 M, the current density at 0.95 V vs. Ag/AgCl increased considerably. At N2H4 concentrations in the range of 0.5–0.75 M, the increase in current density at 0.95 V vs. Ag/AgCl became less sensitive to increasing N2H4 concentration. There was negligible increase in current density at 0.95 V vs. Ag/AgCl when the N2H4 concentration increased from 0.75 to 1.0 M.
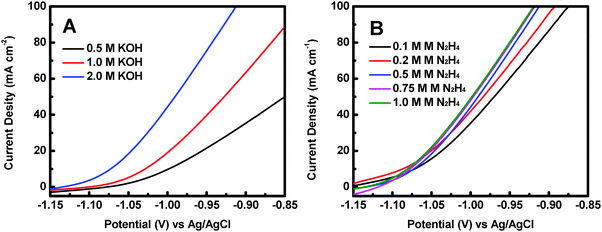 | ||
| Fig. 5 (A) Polarization curves of the Co@CoO electrode in 0.5 M N2H4 with different KOH concentrations. (B) Polarization curves of the Co@CoO electrode in 2.0 M KOH with varying N2H4 concentrations. | ||
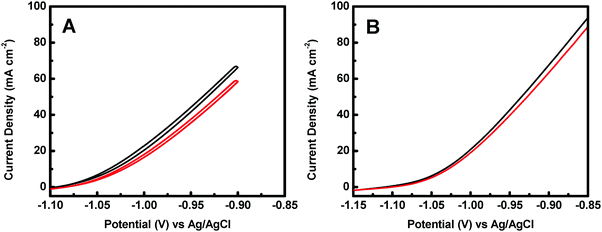
The stability of a catalyst is a key parameter for its practical applications. The catalyst stability of the Co@CoO catalyst towards hydrazine electro-oxidation was studied by cyclic voltammetry to measure the current density at −0.9 V vs. Ag/AgCl as a function of the number of cycles. Fig. 6A shows the 1st and the 100th cyclic voltammograms of the Co@CoO electrode. The current density at −0.9 V vs. Ag/AgCl showed a loss of 11% after 100 cycles. This relatively large drop in current density is partly due to the limited mass transport of the electrolyte, as evidenced by comparing the polarization curves before and after 100 cycles (Fig. 6B), where a smaller decrease of 6.2% in current density at −0.9 V vs. Ag/AgCl was observed. These results confirm that the Co@CoO catalyst has good stability. To reveal the origin of the catalyst decay, SEM, HRTEM and XPS studies were conducted on the cycled Co@CoO electrode. SEM detected no obvious morphological change of the cycled Co@CoO (Fig. S3, ESI†) relative to the pristine one (Fig. 2C). The HRTEM image (Fig. S4, ESI†) showed that the average thickness of the amorphous CoO layer on the Co core decreased sharply to around 1 nm after 100 cycles, while the d-spacing of 0.21 nm which corresponds to the (100) plane of metallic cobalt (JCPDS 05-0727) confirmed the well-maintained crystalline Co core. XPS analysis showed that the surface chemical states of cobalt were maintained (Fig. S5, ESI†), confirming the presence of the surface CoO layers on the cycled Co@CoO. It is thus clear that the catalyst decay is caused by the deterioration of surface amorphous CoO layers. On the other hand, this confirms the important role of surface amorphous CoO layers in enhancing the catalytic activity of nanostructured metallic Co catalysts towards electro-oxidation of hydrazine.
Conclusions
In summary, well-defined crystalline–amorphous Co@CoO core–shell heterostructures have been readily synthesized by solvothermal reduction of cobalt hydroxide carbonate. The synergistic effect between the crystalline metallic Co core and the amorphous CoO shell endows Co@CoO with high catalytic performance towards electro-oxidation of hydrazine in alkaline media, showing a small onset potential of −1.10 V vs. Ag/AgCl and good long-term stability. This study offers insight into the rational design of advanced catalysts for direct hydrazine fuel cells.Conflicts of interest
There are no conflicts to declare.Acknowledgements
Z. P. acknowledges the support from the National Science Foundation (DMR1308577). X. Y. thanks the University of Missouri-Kansas City, School of Graduate Studies, for supporting this research.References
- A. Khodakov, B. Olthof, A. T. Bell and E. Iglesia, J. Catal., 1999, 181, 205–216 CrossRef CAS.
- U. Diebold, Surf. Sci. Rep., 2003, 48, 53–229 CrossRef CAS.
- V. R. Stamenkovic, B. Simon Mun, K. J. J. Mayrhofer, P. N. Ross and N. M. Markovic, J. Am. Chem. Soc., 2006, 128, 8813–8819 CrossRef CAS PubMed.
- D. Merki, S. Fierro, H. Vrubel and X. Hu, Chem. Sci., 2011, 2, 1262–1267 RSC.
- C. G. Morales-Guio and X. Hu, Acc. Chem. Res., 2014, 47, 2671–2681 CrossRef CAS PubMed.
- X. Chen, L. Liu, P. Y. Yu and S. S. Mao, Science, 2011, 331, 746–750 CrossRef CAS PubMed.
- K. Li, J. Xu, X. Yan, L. Liu, X. Chen, Y. Luo, J. He and D. Z. Shen, Appl. Phys. Lett., 2016, 108, 183102 CrossRef.
- T. Xia, C. Zhang, N. A. Oyler and X. Chen, Adv. Mater., 2013, 25, 6905–6910 CrossRef CAS PubMed.
- X. Yan, L. Tian, J. Murowchick and X. Chen, J. Mater. Chem. A, 2016, 4, 3683–3688 CAS.
- Z. Wu, B. Li, Y. Xue, J. Li, Y. Zhang and F. Gao, J. Mater. Chem. A, 2015, 3, 19445–19454 CAS.
- F. Song and X. Hu, J. Am. Chem. Soc., 2014, 136, 16481–16484 CrossRef CAS PubMed.
- D. Merki, H. Vrubel, L. Rovelli, S. Fierro and X. Hu, Chem. Sci., 2012, 3, 2515–2525 RSC.
- J. Yan, H. Wu, P. Li, H. Chen, R. Jiang and S. Liu, J. Mater. Chem. A, 2017, 5, 10173–10181 CAS.
- Y. Liu, H. Wang, D. Lin, C. Liu, P.-C. Hsu, W. Liu, W. Chen and Y. Cui, Energy Environ. Sci., 2015, 8, 1719–1724 CAS.
- J. Wang, H. Tang, L. Zhang, H. Ren, R. Yu, Q. Jin, J. Qi, D. Mao, M. Yang, Y. Wang, P. Liu, Y. Zhang, Y. Wen, L. Gu, G. Ma, Z. Su, Z. Tang, H. Zhao and D. Wang, Nat. Energy, 2016, 1, 16050 CrossRef CAS.
- J. Zhang, H. Ren, J. Wang, J. Qi, R. Yu, D. Wang and Y. Liu, J. Mater. Chem. A, 2016, 4, 17673–17677 CAS.
- H. Ren, R. Yu, J. Wang, Q. Jin, M. Yang, D. Mao, D. Kisailus, H. Zhao and D. Wang, Nano Lett., 2014, 14, 6679–6684 CrossRef CAS PubMed.
- J. Wang, H. Tang, H. Ren, R. Yu, J. Qi, D. Mao, H. Zhao and D. Wang, Adv. Sci., 2014, 1, 1400011 CrossRef PubMed.
- J. Qi, X. Lai, J. Wang, H. Tang, H. Ren, Y. Yang, Q. Jin, L. Zhang, R. Yu, G. Ma, Z. Su, H. Zhao and D. Wang, Chem. Soc. Rev., 2015, 44, 6749–6773 RSC.
- J. Qi, J. Chen, G. Li, S. Li, Y. Gao and Z. Tang, Energy Environ. Sci., 2012, 5, 8937–8941 CAS.
- Y. Yang, Q. Jin, D. Mao, J. Qi, Y. Wei, R. Yu, A. Li, S. Li, H. Zhao, Y. Ma, L. Wang, W. Hu and D. Wang, Adv. Mater., 2017, 29, 1604795 CrossRef PubMed.
- J. R. McKone, B. F. Sadtler, C. A. Werlang, N. S. Lewis and H. B. Gray, ACS Catal., 2013, 3, 166–169 CrossRef CAS.
- Q. Gong, L. Cheng, C. Liu, M. Zhang, Q. Feng, H. Ye, M. Zeng, L. Xie, Z. Liu and Y. Li, ACS Catal., 2015, 5, 2213–2219 CrossRef CAS.
- M. H. Tang, C. Hahn, A. J. Klobuchar, J. W. Desmond Ng, J. Wellendorff, T. Bligaard and T. F. Jaramillo, Phys. Chem. Chem. Phys., 2014, 16, 19250–19257 RSC.
- J. Sanabria-Chinchilla, K. Asazawa, T. Sakamoto, K. Yamada, H. Tanaka and P. Strasser, J. Am. Chem. Soc., 2011, 133, 5425–5431 CrossRef CAS PubMed.
- L. Zhang, D. Lu, Y. Chen, Y. Tang and T. Lu, J. Mater. Chem. A, 2014, 2, 1252–1256 CAS.
- H. Wang, Y. Ma, R. Wang, J. Key, V. Linkov and S. Ji, Chem. Commun., 2015, 51, 3570–3573 RSC.
- R. Boppella, P. Basak and S. V. Manorama, ACS Appl. Mater. Interfaces, 2012, 4, 1239–1246 CAS.
- L. Cao, D. Chen, W. Li and R. A. Caruso, ACS Appl. Mater. Interfaces, 2014, 6, 13129–13137 CAS.
- Z. Wen, W. Liu, L.-C. Yin, R. Fang, M. Li, E. I. Altman, Q. Fan, F. Li, H.-M. Cheng and H. Wang, Nano Lett., 2015, 15, 7704–7710 CrossRef PubMed.
- X. Yan, L. Tian, K. Li, S. Atkins, H. Zhao, J. Murowchick, L. Liu and X. Chen, Adv. Mater. Interfaces, 2016, 3, 1600368 CrossRef.
- X. Yan, L. Tian, S. Atkins, Y. Liu, J. Murowchick and X. Chen, ACS Sustainable Chem. Eng., 2016, 4, 3743–3749 CrossRef CAS.
- S. Alayoglu, A. U. Nilekar, M. Mavrikakis and B. Eichhorn, Nat. Mater., 2008, 7, 333–338 CrossRef CAS PubMed.
- M. Gong, W. Zhou, M.-C. Tsai, J. Zhou, M. Guan, M.-C. Lin, B. Zhang, Y. Hu, D.-Y. Wang, J. Yang, S. J. Pennycook, B.-J. Hwang and H. Dai, Nat. Commun., 2014, 5, 4695 CrossRef CAS PubMed.
- X. Yan, L. Tian and X. Chen, J. Power Sources, 2015, 300, 336–343 CrossRef CAS.
- X. Yan, L. Tian, M. He and X. Chen, Nano Lett., 2015, 15, 6015–6021 CrossRef CAS PubMed.
- Z. Zhuang, W. Sheng and Y. Yan, Adv. Mater., 2014, 26, 3950–3955 CrossRef CAS PubMed.
- K. Zhu, M. Li, X. Li, X. Zhu, J. Wang and W. Yang, Chem. Commun., 2016, 52, 11803–11806 RSC.
- W. Ye, B. Yang, G. Cao, L. Duan and C. Wang, Thin Solid Films, 2008, 516, 2957–2961 CrossRef CAS.
- R. G. Chaudhuri and S. Paria, Chem. Rev., 2012, 112, 2373–2433 CrossRef PubMed.
- G. Feng, Y. Kuang, Y. Li and X. Sun, Nano Res., 2015, 8, 3365–3371 CrossRef CAS.
- J. Huang, S. Zhao, W. Chen, Y. Zhou, X. Yang, Y. Zhu and C. Li, Nanoscale, 2016, 8, 5810–5814 RSC.
- Z. Lu, M. Sun, T. Xu, Y. Li, W. Xu, Z. Chang, Y. Ding, X. Sun and L. Jiang, Adv. Mater., 2015, 27, 2361–2366 CrossRef CAS PubMed.
- J. P. Bonnelle, J. Grimblot and A. D'huysser, J. Electron Spectrosc. Relat. Phenom., 1975, 7, 151–162 CrossRef CAS.
- M. Oku and K. Hirokawa, J. Electron Spectrosc. Relat. Phenom., 1976, 8, 475–481 CrossRef CAS.
- T. J. Chuang, C. R. Brundle and D. W. Rice, Surf. Sci., 1976, 59, 413–429 CrossRef CAS.
- H. Gao, Y. Wang, F. Xiao, C. B. Ching and H. Duan, J. Phys. Chem. C, 2012, 116, 7719–7725 CAS.
- H. Jin, J. Wang, D. Su, Z. Wei, Z. Pang and Y. Wang, J. Am. Chem. Soc., 2015, 137, 2688–2694 CrossRef CAS PubMed.
- T. Sakamoto, H. Kishi, S. Yamaguchi, D. Matsumura, K. Tamura, A. Hori, Y. Horiuchi, A. Serov, K. Artyushkova, P. Atanassov and H. Tanaka, J. Electrochem. Soc., 2016, 163, H951–H957 CrossRef CAS.
- M. Petek and S. Bruckenstein, Electroanal. Chem. Interfacial Electrochem., 1973, 47, 329–333 CrossRef CAS.
Footnotes |
| † Electronic supplementary information (ESI) available. See DOI: 10.1039/c7qm00401j |
| ‡ These authors contributed equally. |
| This journal is © the Partner Organisations 2018 |

