Novel Ag2S quantum dot modified 3D flower-like SnS2 composites for photocatalytic and photoelectrochemical applications†
Liquan
Jing
a,
Yuanguo
Xu
 *a,
Meng
Zhang
a,
Meng
Xie
a,
Hui
Xu
b,
Minqiang
He
a,
Jie
Liu
a,
Shuquan
Huang
a and
Huaming
Li
 *ab
*ab
aSchool of Chemistry and Chemical Engineering, School of Pharmacy, Jiangsu University, Zhenjiang 212013, PR China. E-mail: xuyg@ujs.edu.cn; lhm@ujs.edu.cn
bInstitute for Energy Research, Jiangsu University, Zhenjiang 212013, PR China
First published on 24th October 2017
Abstract
Novel 3D flower-like Ag2S/SnS2 composites were fabricated by a hydrothermal and ion exchange method. Uniform Ag2S quantum dots were homogeneously interspersed on 3D flower-like SnS2. The samples were characterized through X-ray diffraction (XRD), Raman spectroscopy, scanning electron microscopy (SEM), energy-dispersive X-ray spectroscopy (EDS), transmission electron microscopy (TEM), UV-Vis diffuse reflectance spectroscopy (DRS), X-ray photoelectron spectroscopy (XPS) and photoluminescence (PL) analysis. As expected, the as-prepared Ag2S quantum dot modified 3D flower-like SnS2 composites exhibited enhanced photoelectrochemical (PEC) performance and photocatalytic activities. The photocurrent density of 3% 3D flower-like Ag2S/SnS2 at 2.0 V (vs. Ag/AgCl) (0.65 mA cm−2) was about 3.25 times higher than that (0.2 mA cm−2) of 3D flower-like SnS2. The photocatalytic activity of 3D flower-like Ag2S/SnS2 composites was assessed through the degradation of methyl orange and the photocatalytic H2 evolution performance under visible light irradiation. The coupling of SnS2 and Ag2S quantum dots could notably promote the photocatalytic activity. The experimental results indicated that 3% 3D flower-like Ag2S/SnS2 composites showed the best photocatalytic performance for the degradation of methyl orange. These composites also exhibited a high H2 evolution rate of 574.7 μmol h−1 g−1 under visible light irradiation, approximately 5.57 times higher than that of pure 3D flower-like SnS2. Based on the calculation, radical trapping tests and ESR, a plausible mechanism for increased photoactivity was proposed. This work provides experimental insight into the design of low-cost photocatalysts for highly efficient photodegradation and photocatalytic H2-production.
1. Introduction
The growing serious environment and energy problems have been attracting much attention. Semiconductor photocatalysis have been applied for contaminant treatment and H2 evolution from water splitting using ultraviolet (UV) or visible light irradiation.1,2 However, semiconductor photocatalysis involves the recombination of photo-induced carriers.3,4 Therefore, the coupling of two semiconductor photocatalysts to form a heterogeneous semiconductor photocatalyst is regarded as an effective strategy to overcome the above limitation and further extend the photoabsorption range.5,6As one of the most important semiconductor chalcogenide nanostructures, SnS2 with a band gap of ca. 2.2 eV displays a wide photoelectrochemical response in the region of visible light.1,7 To our knowledge, SnS2 nanomaterials have a lot of advantages, including low cost, non-toxicity, good stability and oxidative and thermal stability in air, and so on.8–11 So as to upgrade the photocatalytic activity of pure SnS2, several materials including TiO2,12 SnO2,13,14 WO3,15 La2Ti2O7,16 g-C3N4,17,18 Bi2S3![[thin space (1/6-em)]](https://www.rsc.org/images/entities/char_2009.gif) 19 and BiOBr
19 and BiOBr![[thin space (1/6-em)]](https://www.rsc.org/images/entities/char_2009.gif) 20 were coupled with SnS2. Compared to a single semiconductor, the coupling between two different semiconductors has proved to be successful in developing better performance photocatalysts, which is due to assembling heterostructures to enhance their photochemical conversion property. As an important chalcogenide semiconductor, Ag2S has a narrow band gap (about 1.0 eV), which can harvest solar light and apply to the photocatalytic field.21,22 There are a large number of reports on the synthesis of Ag2S-based photocatalysts. For example, Ag/Ag2S/CuS,23 ZnS/CdS/Ag2S,24 Ag2S/ZnS,25 Ag2S/Bi2WO6,26 Ag2S/TiO2
20 were coupled with SnS2. Compared to a single semiconductor, the coupling between two different semiconductors has proved to be successful in developing better performance photocatalysts, which is due to assembling heterostructures to enhance their photochemical conversion property. As an important chalcogenide semiconductor, Ag2S has a narrow band gap (about 1.0 eV), which can harvest solar light and apply to the photocatalytic field.21,22 There are a large number of reports on the synthesis of Ag2S-based photocatalysts. For example, Ag/Ag2S/CuS,23 ZnS/CdS/Ag2S,24 Ag2S/ZnS,25 Ag2S/Bi2WO6,26 Ag2S/TiO2![[thin space (1/6-em)]](https://www.rsc.org/images/entities/char_2009.gif) 27 and so on have been used for the photocatalytic degradation of organic pollutants. In addition, Ag2S as a cocatalyst for assisting hole transfer is beneficial for enhancing the photocatalytic H2 evolution.28–30 In view of the above, coupling of SnS2 with other narrow band gap photocatalysts, such as Ag2S quantum dots, to form a heterostructure is expected to prevent the recombination of photo-generated electron–hole pairs and broaden the absorption wavelength.
27 and so on have been used for the photocatalytic degradation of organic pollutants. In addition, Ag2S as a cocatalyst for assisting hole transfer is beneficial for enhancing the photocatalytic H2 evolution.28–30 In view of the above, coupling of SnS2 with other narrow band gap photocatalysts, such as Ag2S quantum dots, to form a heterostructure is expected to prevent the recombination of photo-generated electron–hole pairs and broaden the absorption wavelength.
Here, we synthesized 3D flower-like Ag2S/SnS2 composite photocatalysts by a simple facile ion-exchange method for the first time. Under visible light irradiation, photodegradation was determined by the removal of methyl orange (MO), and the photocatalytic hydrogen evolution over the 3D flower-like Ag2S/SnS2 composites was investigated in Na2S and Na2SO3 aqueous solution. The results show that the 3D flower-like Ag2S/SnS2 composites exhibit significantly improved photocatalytic performance compared with that of pristine SnS2, and a plausible mechanism for the increased photoactivity was proposed.
2. Experimental section
2.1 Preparation
2.2 Characterization
The crystal constitution of the resultant samples was characterized using a Shimadzu X-ray diffraction (XRD, Cu-Kα radiation, λ = 1.5406 Å) instrument in the range of 10 to 80° at 7° min−1. Raman spectra was recorded at room temperature using a Renishaw InVia micro-Raman spectrometer with excitation at 785 nm. The morphologies were observed by scanning electron microscopy (SEM) equipped with an energy dispersive X-ray detector (EDX, Thermo NORAN system 7) and transmission electron microscopy (TEM) performed on a JEOL-JEM-2010 (JEOL, Japan) operating at 200 kV. An ES-CALab PHI500 X-ray photo-electron spectrometer was used to record the X-ray photoelectron spectra (XPS) of the samples with Mg-kα radiation. UV-vis diffuse reflectance spectra (DRS) was recorded on a UV-2450 Shimadzu UV-vis spectrophotometer (Japan), with BaSO4 used as the substrate. The photoluminescence (PL) spectra of the photocatalyst were obtained using a Varian Cary Eclipse spectrometer with an excitation wavelength of 325 nm. The electron spin resonance (ESR) signals of spin-trapped radicals by the spin-trap reagent DMPO (Sigma Chemical Co.) were recorded on a Bruker model ESR JEOL FA-200 spectrometer in water for hydroxyl radicals and in methanol for superoxide radicals, respectively.2.3 Photocatalytic degradation and hydrogen production
The photocatalytic degradation activity of the as-prepared samples was assessed through the degradation of MO. The sample (70 mg) was dispersed into MO solution (70 mL, 10 mg L−1) in a cylindrical quartz vessel and magnetically stirred in the dark for 1 h to attain the adsorption–desorption equilibrium. A 300 W Xe lamp was then used as the light source that was equipped with a cutoff filter (λ > 420 nm) during the photocatalytic process. At an interval of 30 min, the absorbance of MO was measured by using a UV-2450 spectrometer at 463 nm after centrifugation. The photocatalytic hydrogen output experiments were carried out in a 100 mL Pyrex flask at atmospheric pressure and ambient temperature, and the flask's openings were sealed with silicone rubber septums. A 300 W Xe arc lamp with a UV cutoff filter (>400 nm) positioned 20 cm away from the reactor was used as the light source to trigger the photocatalytic reaction. In a characteristic photocatalytic experiment, 50 mg of samples were added into a 100 mL mixed aqueous solution consisting of 0.35 M Na2S and 0.25 M Na2SO3. Before irradiation, the catalyst suspension was scattered through an ultrasonic bath for 10 min, followed by bubbling with nitrogen by the reactor for 40 min to get rid of the dissolved oxygen wholly and guarantee that the reactor was in an anaerobic circumstance. A magnetic stirrer was used to keep the photocatalyst particles in the suspension state. The amount of produced H2 gas was determined by gas chromatography (GC-14C, Shimadzu, Japan, TCD) with nitrogen as a carrier gas and a column with 5 Å molecular sieves.3. Results and discussion
3.1 Structure and property characterization
The XRD patterns of 3D flower-like Ag2S/SnS2 composites and the pure 3D flower-like SnS2 sample are presented in Fig. 1A. As displayed in Fig. 1(A), the diffraction peaks at 2θ = 15.00°, 28.28°, 32.16°, 41.90°, 50.04°, 52.56°, 54.98°, 58.54°, 62.72° and 67.17° matched well with the (0 0 1), (1 0 0), (1 0 1), (1 0 2), (1 1 0), (1 1 1), (1 0 3), (2 0 0), (004) and (2 0 2) crystal faces, respectively. The results were consistent with SnS2 (JCPDS card no. 23-0677).31,32 The XRD patterns of pure Ag2S are presented in Fig. S1;† the diffraction peaks are consistent with Ag2S (JCPDS card no. 65-2356).33 As shown in Fig. 1A(b–e), compared with the diffraction patterns of bare SnS2, the diffraction peaks of SnS2 in the composites were only gradually weakened and no XRD peaks of Ag2S were detected for 3D flower-like Ag2S/SnS2 composites because of the low content of Ag2S (0.5–5%) and high dispersion of Ag2S quantum dots on the surface of 3D flower-like SnS2.34 The presence of Ag2S will be demonstrated by other means of representation. Fig. 1B presents the Raman spectrum of 3D flower-like SnS2 and 3% 3D flower-like Ag2S/SnS2 composites. For SnS2, the strong peak at 312 cm−1 can be indexed to the A1g mode of SnS2.35–38 The Raman spectrum of 3D flower-like Ag2S/SnS2 composites displays a slightly weaker peak of SnS2 at 312 cm−1 (A1g), which is in agreement with the results of XRD.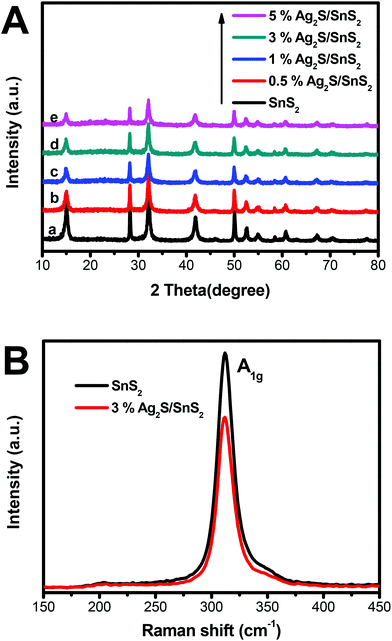 | ||
| Fig. 1 (A) XRD patterns for 3D flower-like SnS2 and 3D flower-like Ag2S/SnS2 composites; (B) Raman spectra of 3D flower-like SnS2 and 3% 3D flower-like Ag2S/SnS2 composites. | ||
Fig. 2A and B demonstrate the SEM images of the as-prepared 3% 3D flower-like Ag2S/SnS2 composites. It can be seen that the composites are consistent flower-like spheres with an average diameter of 2.0–2.5 μm and Ag2S quantum dots cannot be seen on the surface of 3D flower-like SnS2. In order to further confirm the presence of Ag elements, the element distribution was examined by EDS and EDX-mapping; Sn, Ag and S elements can be seen in the 3% 3D flower-like Ag2S/SnS2 composite (Fig. 2C and D). Fig. 2C shows clearly that the 3D flower-like Ag2S/SnS2 composite is comprised of Sn, Ag and S elements, indicating the formation of the Ag2S/SnS2 composite. The EDX elemental mapping of the 3% 3D flower-like Ag2S/SnS2 composite (Fig. 2D) showed that Ag was highly dispersed in the 3% 3D flower-like Ag2S/SnS2 composite. As shown in Fig. S2,† it can be seen that Ag2S appears in the agglomerated state and is reunited into larger particles. The microstructure of the 3% 3D flower-like Ag2S/SnS2 composite was further characterized by means of TEM (Fig. 2E and F). Fig. 2E and F show that the 3D flower-like SnS2 is comprised of several self-assembled irregular plates and Ag2S quantum dots were grown on the surface of 3D flower-like SnS2. As shown in Fig. S3,† we have carried out the high resolution TEM (HR-TEM) investigation of the 3% Ag2S/SnS2 composite, which shows Ag2S QDs on the 3D flower-like SnS2 and reveals the resolved lattice fringes of the SnS2 (100) planes with a spacing of 0.315 nm and the Ag2S (101) planes with a spacing of 0.341 nm.18,33 It can be seen that the size of Ag2S quantum dots is less than 10 nm. Therefore, it is noteworthy that we synthesized Ag2S quantum dot modified 3D flower-like SnS2 composites in this work.
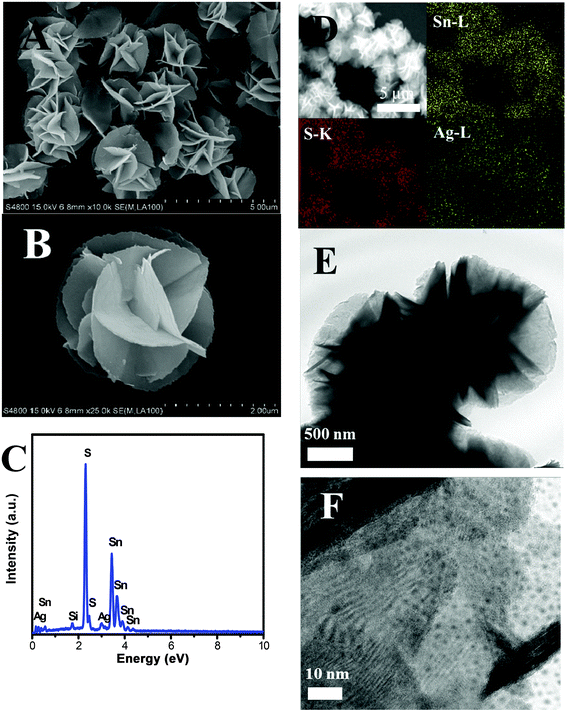 | ||
| Fig. 2 (A) and (B) SEM images; (C) EDS spectrum and (D) mapping distribution of Sn, S, and Ag; (E) and (F) TEM image of 3% 3D flower-like Ag2S/SnS2 composites. | ||
Fig. 3 shows the XPS survey spectra and the corresponding Sn 3d, S 2p, Ag 3d high-resolution spectra for 3D flower-like SnS2 and the 3% 3D flower-like Ag2S/SnS2 composite. The survey spectrum in Fig. 3A shows clearly that pure 3D flower-like SnS2 is composed of Sn and S elements while the 3% 3D flower-like Ag2S/SnS2 composite is composed of Sn, S and Ag elements. Two obvious peaks at 487.1 and 495.6 eV could be attributed to the Sn 3d5/2 and Sn 3d3/2 orbitals of Sn4+ in SnS2, respectively (Fig. 3B).39,40 In relation to SnS2, the Sn 3d XPS peak in the 3% 3D flower-like Ag2S/SnS2 composite shows a slight offset and the intensity of the peak has a certain degree of weakening. As shown in Fig. 3C, it is clear that the binding energies of S 3d3/2 (162.1 eV) and S 3d1/2 (163.3 eV) in 3D flower-like SnS2 are higher than those of 3D flower-like Ag2S/SnS2 composites (161.9 eV and 163.2 eV), which are characteristic of S2−.20,41,42 At the same time, the intensity of the S 2p peak has a certain degree of weakening. In general, the Sn 3d and S 2p peaks are offset, mainly due to the introduction of Ag2S quantum dots affecting the chemical environment of Sn4+ and S2−. Two peaks (Fig. 3D) at 368.5 and 374.5 eV are attributed to Ag 3d5/2 and Ag 3d3/2, respectively, which are characteristic of Ag+, indicating that Ag mainly exists in the form of Ag2S.43–45 In conclusion, according to the XRD, Raman and XPS results, it can be confirmed that Ag2S/SnS2 composites have been successfully synthesized.
Fig. 4 displays the UV-vis diffuse reflectance spectra (DRS) of 3D flower-like SnS2 and 3D flower-like Ag2S/SnS2 composites. For SnS2, the absorption edge is about 550 nm, which broadens the visible-light absorption region (Fig. 4A). Fig. S4† displays the UV-vis diffuse reflectance spectra (DRS) of pure Ag2S which exhibit a strong light absorption from ultraviolet to visible light. In contrast, Ag2S/SnS2 composites exhibit an obvious enhanced visible light absorption at the wavelength ranging from 550 to 800 nm, which indicates that the incorporation of Ag2S quantum dots can effectively extend the visible light absorption edge of SnS2. According to the theory of optical absorption for indirect semiconductors, the band gap energy (Eg) of 3D flower-like SnS2 is calculated according to the following equation:20,46
| ahv = A(hv − Eg)2 |
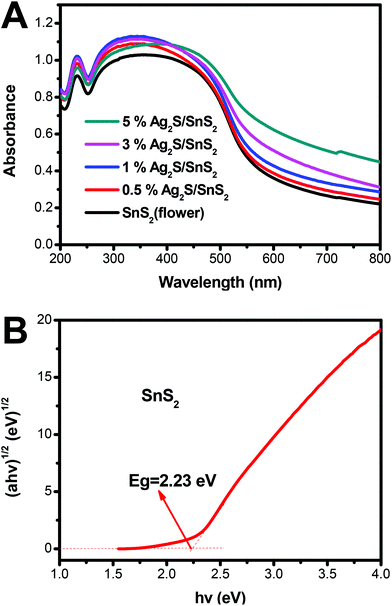 | ||
| Fig. 4 (A) UV-vis spectra of 3D flower-like SnS2 and 3D flower-like Ag2S/SnS2 composites; (B) band gap energies of the 3D flower-like SnS2. | ||
3.2 Photocatalytic degradation and H2-production activity
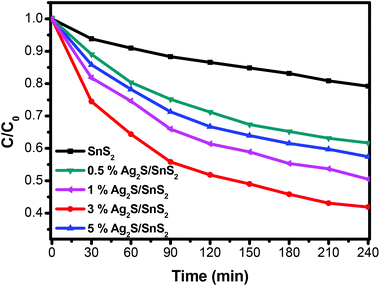
The photocatalytic activity of the 3D flower-like Ag2S/SnS2 composites was assessed for the degradation of MO (10 mg L−1) under visible light irradiation. As shown in Fig. 5, the 3D flower-like SnS2 exhibited a photocatalytic efficiency of 21.8% in 240 min. When Ag2S and SnS2 are coupled to construct the composites, even if the Ag2S content is extremely low, the photocatalytic activity is dramatically enhanced. The photocatalytic activity of all 3D flower-like Ag2S/SnS2 composites with a Ag2S weight percentage of 0.5%, 1%, 3% and 5% is higher than that of 3D flower-like SnS2. The optimal photocatalytic performance was obtained when the Ag2S content was 3%; that is, almost 59.1% of MO was degraded in 240 min. It is suggested that the Ag2S content has a significant influence on the photocatalytic activity of 3D flower-like SnS2. At the same time, Fig. 6 shows the catalytic stability test of 3% 3D flower-like Ag2S/SnS2 composites. It was shown that 3% 3D flower-like Ag2S/SnS2 composites maintained their catalytic photoactivity in 240 min without appreciable deactivation after four recycling processes.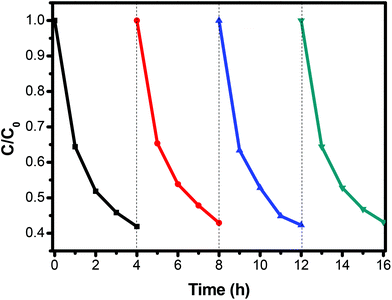 | ||
| Fig. 6 The cycling runs of 3% 3D flower-like Ag2S/SnS2 composites for the photodegradation of MO under visible light. | ||
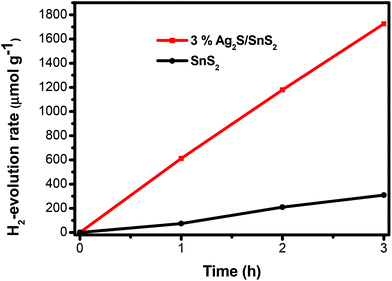
The photocatalytic hydrogen evolution of 3D flower-like Ag2S/SnS2 composites was assessed to further illustrate the enhanced photocatalytic activity (Fig. 7). The 3D flower-like SnS2 showed a poor hydrogen evolution rate (103.2 μmol h−1 g−1). However, the 3% 3D flower-like Ag2S/SnS2 composite displayed a higher hydrogen production activity of about 574.7 μmol h−1 g−1, which is approximately 5.6 times higher than that of pure SnS2. The obvious photocatalytic and hydrogen production activities are attributed to the efficient visible light harvesting of Ag2S quantum dots and the efficient charge separation.
3.3. Possible mechanism for the increased photocatalytic activity of 3D flower-like Ag2S/SnS2 composites
The transient photocurrent response of pure SnS2 and 3% 3D flower-like Ag2S/SnS2 under visible light irradiation was studied by photoelectrochemical experiments (Fig. 8). It can be seen that the 3D flower-like Ag2S/SnS2 composite shows higher photocurrent intensity than pure SnS2. The results revealed that Ag2S can speed up the separation of the photo-generated carriers. This observation suggests that the formed 3D flower-like Ag2S/SnS2 composite allows for the more efficient separation of photo-generated carriers compared to SnS2 alone. Fig. 9 shows the linear sweep voltammetry measurements of the 3D flower-like SnS2 and 3% 3D flower-like Ag2S/SnS2 composites at a scan rate of 10 mV s−1. The complete sweep procedure was applied under visible light or dark conditions. Obviously, the photocurrent of 3% 3D flower-like Ag2S/SnS2 under visible light is distinctly higher than that of 3D flower-like SnS2, because the heterostructure considerably enables the separation of photo-induced carriers and restrains the recombination of electron–hole pairs.48,49 It can be seen that the photocurrent density of 3% 3D flower-like Ag2S/SnS2 at 2.0 V (vs. Ag/AgCl) (0.65 mA cm−2) is about 3.25 times higher than that of 3D flower-like SnS2 (0.2 mA cm−2). To further verify the charge transport behavior in this composite, electrochemical impedance spectroscopy (EIS) has been carried out. Fig. 10 shows the EIS spectra of the 3% 3D flower-like Ag2S/SnS2 composite which shows that it has a smaller radius, suggesting that the lower transfer barrier of electrons and faster interfacial charge transfer occurred at the composite interface. In consequence, it can be concluded that Ag2S speeds up the efficient charge transfer between Ag2S and SnS2 facilitating the carrier separation, which is responsible for the increased photocatalytic activity.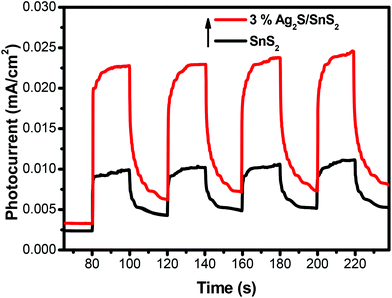 | ||
| Fig. 8 The transient photocurrent responses of 3D flower-like SnS2 and 3% 3D flower-like Ag2S/SnS2 composites under visible-light irradiation. | ||
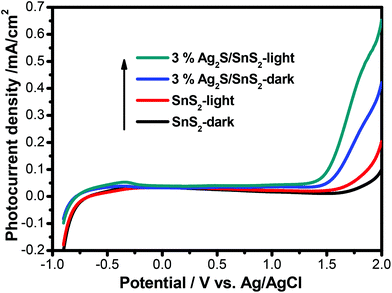 | ||
| Fig. 9 Linear sweep voltammogram curves for 3D flower-like SnS2 and 3% 3D flower-like Ag2S/SnS2 composites. | ||
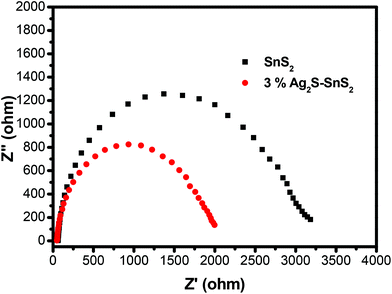 | ||
| Fig. 10 Electrochemical impedance spectroscopy (EIS) of 3D flower-like SnS2 and 3% 3D flower-like Ag2S/SnS2 composites under visible-light irradiation. | ||
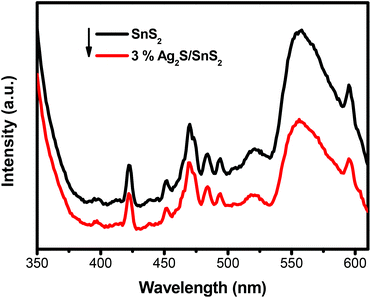
The photoinduced carrier separation efficiency of a photocatalyst can be investigated using photoluminescence (PL) analysis. Fig. 11 shows the PL spectra of 3D flower-like SnS2 and 3% 3D flower-like Ag2S/SnS2 composites monitored at an excitation wavelength of 325 nm. The PL spectra for all of the samples show some principal emission peaks centered at approximately 422, 470, and 555 nm. Comparatively, the 3% 3D flower-like Ag2S/SnS2 composite shows lower intensity than pure SnS2. This phenomenon indicates that the 3% 3D flower-like Ag2S/SnS2 composite shows slower recombination of the charge carriers, which may lead to enhanced photocatalytic activity.
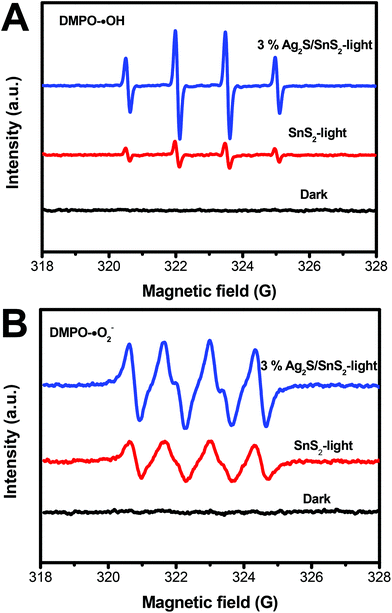
The ESR spin-trap with DMPO technique was also performed on illuminated 3D flower-like SnS2 and the 3% 3D flower-like Ag2S/SnS2 composite. As illustrated in Fig. 12A, there was no signal in the dark; while the light was on, it could be observed that the signal of DMPO-˙OH for the 3% 3D flower-like Ag2S/SnS2 composite is much stronger than that for 3D flower-like SnS2, which suggests that ˙OH is the main reaction during the photocatalytic process. Additionally, the signal of DMPO-˙O2− could be detected when exposed to light (Fig. 12B). And the peak intensity of the 3D flower-like Ag2S/SnS2 composite was stronger than that of pure SnS2 after the irradiation, suggesting that ˙O2− also played a vital role in the enhanced photocatalytic performance. ESR demonstrates that ˙OH and ˙O2− are the principle active species of the 3D flower-like Ag2S/SnS2 composite in the photooxidation procedure under visible light illumination. To further elucidate the reaction mechanism in depth in the photocatalytic system, free radical (˙OH, ˙O2− and h+) trapping experiments over the 3% 3D flower-like Ag2S/SnS2 composite were conducted, as shown in Fig. 13. In these radical species trapping experiments, isopropyl alcohol (IPA), argon (Ar) and triethanolamine (TEOA) were used as the scavengers of ˙OH, ˙O2− and h+ in the photocatalytic reaction, respectively. It can be seen that IPA, Ar and TEOA had significant effects on the photocatalytic activity of the composites, which suggests that ˙OH, ˙O2− and h+ are the main active species in the photocatalytic reaction. The results of ESR and trapping experiments are also consistent with the above results, which fully proves that ˙OH, ˙O2− and h+ are the main active species.
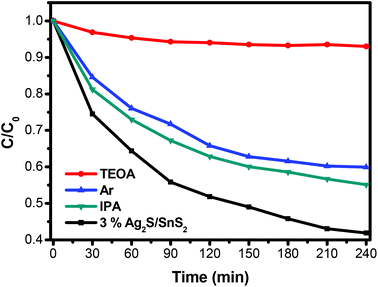 | ||
| Fig. 13 Effects of various scavengers on the photocatalytic efficiency of 3D flower-like Ag2S/SnS2 composites. | ||
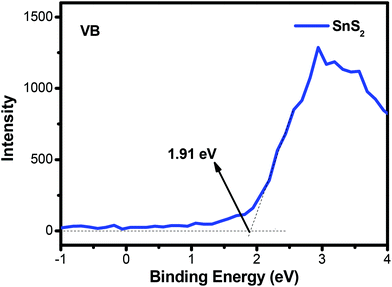
According to the above results and discussion, a probable mechanism for MO photodegradation and the photocatalytic H2 production of the present 3D flower-like Ag2S/SnS2 composite is proposed, as shown in Fig. 15. The valence band (VB) of SnS2 was measured by using the VB-XPS spectra, as shown in Fig. 13. Based on the DRS analysis in Fig. 4B and the equation ECB = EVB − Eg, the valence band (VB) and conduction band (CB) potentials of bare SnS2 are about 1.91 eV and −0.34 eV, respectively. As shown in Fig. 15(a), the valence band potential (1.91 eV) is more negative compared with the redox potential for ˙OH/OH− (+1.99 eV),50 and thus OH− cannot be oxidized to ˙OH by the photogenerated holes of the 3D flower-like Ag2S/SnS2 composite. Meanwhile, O2/˙O2− (−0.33 eV) or O2/H2O2 (+0.695 eV)29 is more positive than the CB potential (−0.34 eV) of SnS2, and thus O2 can obtain these electrons and be reduced to yield ˙O2− or H2O2, and then ˙OH can be formed by the reaction between ˙O2− or electrons and H2O2.51,52 As a consequence, the highly active photogenerated h+ of the 3D flower-like Ag2S/SnS2 composite can also directly oxidize MO and the above reactive species can effectively decompose the adsorbed MO molecule. For the photocatalytic H2 production (Fig. 14b), when the photocatalyst is irradiated, electrons and holes would be generated. Because the CB and valence band (VB) energy levels of Ag2S are bracketed by those of SnS2, both electrons and holes will be transferred to Ag2S. On the one hand, electrons transferred to Ag2S cannot generate H2 because the CB of Ag2S is lower than that of the reduction potential of H+/H2. So, Ag2S can neither generate H2 nor pass electrons from its VB to H+.53 On the other hand, the electrons from SnS2 will react with the protons from water and generate H2. On the other side of the catalyst, holes will be transferred to Ag2S, which will promote the carrier separation, and Ag2S acts as an oxidation site. Thus, it is reasonable to consider that the better performance of the 3D flower-like Ag2S/SnS2 composite is due to the enhanced hole transfer via its shallower VB edge of Ag2S. So, the loading of the cocatalyst Ag2S in the composite can further accelerate the hole transfer to promote the separation of electron–hole pairs; the electrons can be scavenged by H+ to generate H2. In all, this composite enhanced the photogenerated charge separation, which then caused enhanced photoactivity for either pollutant degradation or H2 production.
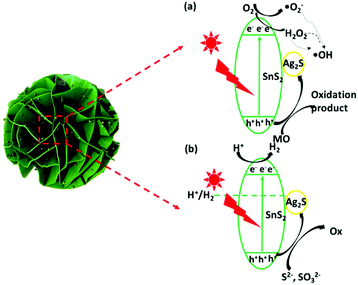 | ||
| Fig. 15 Proposed mechanism for (a) the photodegradation of MO and (b) photocatalytic H2 production over 3D flower-like Ag2S/SnS2 composites. | ||
4. Conclusions
In conclusion, a novel 3D flower-like Ag2S/SnS2 composite photocatalyst was fabricated through a solvent thermal method and in situ method. The 3% 3D flower-like Ag2S/SnS2 composite exhibits the optimal photocatalytic activity and high stability for the photodegradation of MO and photocatalytic H2 production. The vital role of Ag2S in the enhanced photocatalytic performance can improve the charge separation efficiency. According to ESR and the trapping experiments, ˙OH, ˙O2− and h+ are the main active species in the photocatalytic reaction. In addition, a photocatalysis mechanism was proposed for photodegradation and H2 production. Moreover, Ag2S-semiconductors are expected to be applied in the development of photocatalysts.Conflicts of interest
There are no conflicts to declare.Acknowledgements
This work is financially supported by the National Natural Science Foundation of China (No. 21777063, 21407065), the Natural Science Foundation of Jiangsu Province for Youths (BK20140533), the China Postdoctoral Science Foundation (2015 T80514), the Jiangsu University Scientific Research Funding (No. 14JDG052), and a project funded by the Priority Academic Program Development of Jiangsu Higher Education Institutions.Notes and references
- X. Q. An, J. C. Yu and J. W. Tang, J. Mater. Chem. A, 2014, 2, 1000–1005 CAS.
- O. Mehraj, B. M. Pirzada, N. A. Mir, S. M. Sultana and S. Sabir, RSC Adv., 2015, 5, 42910 RSC.
- Z. Zhang, W. Wang, L. Wang and S. Sun, ACS Appl. Mater. Interfaces, 2012, 4, 593–597 CAS.
- S. Sultana, Rafiuddin, M. Z. Khan and M. Shahadat, J. Environ. Chem. Eng., 2015, 3, 886–891 CrossRef CAS.
- J. Cao, B. Xu, H. Lin, B. Luo and S. Chen, Chem. Eng. J., 2012, 185–186, 91–99 CrossRef CAS.
- Y. F. Hou, S. J. Liu, J. H. Zhang, X. Cheng and Y. Wang, Dalton Trans., 2014, 43, 1025–1031 RSC.
- L. Y. Mao, J. J. Li, Y. L. Xie, Y. J. Zhong and Y. Hu, RSC Adv., 2014, 4, 29698 RSC.
- J. Luo, X. S. Zhou, J. Q. Zhang and Z. H. Du, RSC Adv., 2015, 5, 86705 RSC.
- Z. Y. Zhang, C. L. Shao, X. H. Li, Y. Y. Sun, M. Y. Zhang, J. B. Mu, P. Zhang, Z. C. Guo and Y. C. Liu, Nanoscale, 2013, 5, 606 RSC.
- Y. Q. Lei, S. Y. Song, W. Q. Fan, Y. Xing and H. J. Zhang, J. Phys. Chem. C, 2009, 113(4), 1280–1285 CAS.
- J. Yu, C. Y. Xu, F. X. Ma, S. P. Hu, Y. W. Zhang and L. Zhen, ACS Appl. Mater. Interfaces, 2014, 6(24), 22370–22377 CAS.
- L. Truong-Phuoc, K. C. Christoforidis, F. Vigneron, V. Papaefthimiou, G. Decher, N. Keller and V. Keller, ACS Appl. Mater. Interfaces, 2016, 8, 34438–34445 CAS.
- Y. C. Zhang, L. Yao, G. S. Zhang, D. D. Dionysiou, J. Li and X. H. Du, Appl. Catal., B, 2014, 144, 730–738 CrossRef CAS.
- X. Zhang, P. Zhang, L. J. Wang, H. Q. Gao, J. T. Zhao, C. H. Liang, J. H. Hu and G. S. Shao, Appl. Catal., B, 2016, 192, 17–25 CrossRef CAS.
- J. Li, X. H. Du, L. Yao and Y. C. Zhang, Mater. Lett., 2014, 121, 44–46 CrossRef CAS.
- J. Chen, S. Z. Liu, L. Zhang and N. Chen, Mater. Lett., 2015, 150, 44–47 CrossRef CAS.
- Z. Y. Zhang, J. D. Huang, M. Y. Zhang, Q. Yuan and B. Dong, Appl. Catal., B, 2015, 163, 298–305 CrossRef CAS.
- L. L. Chen, M. Chen, D. L. Jiang and J. M. Xi, J. Mol. Catal. A: Chem., 2016, 425, 174–182 CrossRef CAS.
- X. M. Gao, G. B. Huang, H. H. Gao, C. Pan, H. Wang, J. Yan, Y. Liu, H. X. Qiu, N. Ma and J. P. Gao, J. Alloys Compd., 2016, 674, 98–108 CrossRef CAS.
- F. Z. Qiu, W. J. Li, F. Z. Wang, H. D. Li, X. T. Liu and J. Y. Sun, J. Colloid Interface Sci., 2017, 493, 1–9 CrossRef CAS PubMed.
- X. P. Qiu, J. S. Yu, H. M. Xu, W. X. Chen, W. Hu, H. Y. Bai and G. L. Chen, Appl. Surf. Sci., 2016, 362, 498–505 CrossRef CAS.
- W. Jiang, Z. M. Wu, X. N. Yue, S. J. Yuan, H. F. Lu and B. Liang, RSC Adv., 2015, 5, 24064–24071 RSC.
- Y. H. Shi, Y. J. Chen, G. H. Tian, L. Y. Wang, Y. T. Xiao and H. G. Fu, ChemCatChem, 2015, 7, 1684–1690 CrossRef CAS.
- K. Kalpana and V. Selvaraj, RSC Adv., 2016, 6, 4227 RSC.
- X. D. Zhang, X. J. Liu, L. Zhang, D. L. Li and S. H. Liu, J. Alloys Compd., 2016, 655, 38–43 CrossRef CAS.
- O. Mehraj, B. M. Pirzada, N. A. Mir, S. Sultanaa and S. Sabir, RSC Adv., 2015, 5, 42910 RSC.
- S. K. Yadav and P. Jeevanandam, J. Alloys Compd., 2015, 649, 483–490 CrossRef CAS.
- X. Yang, H. T. Xue, J. Xu, X. Huang, J. Zhang, Y. B. Tang, T. W. Ng, H. L. Kwong, X. M. Meng and C. S. Lee, ACS Appl. Mater. Interfaces, 2014, 6, 9078–9084 CAS.
- S. Yue, B. W. Wei, X. D. Guo, S. X. Yang, L. Y. Wang and J. He, Catal. Commun., 2016, 76, 37–41 CrossRef CAS.
- M. H. Hsu, C. J. Chang and H. T. Weng, ACS Sustainable Chem. Eng., 2016, 4, 1381–1391 CrossRef CAS.
- M. He, L. X. Yuan and Y. H. Huang, RSC Adv., 2013, 3, 3374–3383 RSC.
- L. Deng, Z. F. Zhu, L. Liu and H. Liu, Solid State Sci., 2017, 63, 76–83 CrossRef CAS.
- T. Y. Liu, B. Liu, L. F. Yang, X. L. Ma, H. Li, S. Yin, T. Sato, T. Sekino and Y. H. Wang, Appl. Catal., B, 2017, 204, 593–601 CrossRef CAS.
- O. Mehraj, B. M. Pirzada, N. A. Mir, S. Sultana and S. Sabir, RSC Adv., 2015, 5, 42910–42921 RSC.
- Y. C. Zhang, F. Zhang, Z. J. Yang, H. G. Xue and D. D. Dionysiou, J. Catal., 2016, 344, 692–700 CrossRef CAS.
- Y. B. Yang, J. K. Dash, A. J. Littlejohn, Y. Xiang, Y. Wang, J. Shi, L. H. Zhang, K. Kisslinger, T. M. Lu and G. C. Wang, Cryst. Growth Des., 2016, 16, 961–973 CAS.
- B. Yang, X. Q. Zuo, P. Chen, L. Zhou, X. Yang, H. J. Zhang, G. Li, M. Z. Wu, Y. Q. Ma, S. W. Jin and X. S. Chen, ACS Appl. Mater. Interfaces, 2015, 7, 137–143 CAS.
- J. C. Park, K. R. Lee, H. Heo, S. H. Kwon, J. D. Kwon, M. J. Lee, W. Jeon, S. J. Jeong and J. H. Ahn, Cryst. Growth Des., 2016, 16, 3884–3889 CAS.
- L. Deng, Z. F. Zhu, L. Liu and H. Liu, Solid State Sci., 2017, 63, 76–83 CrossRef CAS.
- T. T. Wang, H. Meng, X. Yu, Y. Z. Liu, H. B. Chen, Y. Zhu, J. P. Tang, Y. X. Tong and Y. M. Zhang, RSC Adv., 2015, 5, 15469 RSC.
- F. Yang, G. Han, D. Fu, Y. Chang and H. Wang, Mater. Chem. Phys., 2013, 140, 398–404 CrossRef CAS.
- J. Wang, X. Li, X. Li, J. Zhu and H. Li, Nanoscale, 2013, 5, 1876–1881 RSC.
- R. F. Tang, H. F. Su, Y. W. Sun, X. X. Zhang, L. Li, C. H. Liu, B. Q. Wang, S. Y. Zeng and D. Z. Sun, Nanoscale Res. Lett., 2016, 11, 126 CrossRef PubMed.
- Y. H. Shi, Y. J. Chen, G. H. Tian, L. Y. Wang, Y. T. Xiao and H. G. Fu, ChemCatChem, 2015, 7, 1684–1690 CrossRef CAS.
- S. Yue, B. W. Wei, X. D. Guo, S. X. Yang, L. Y. Wang and J. He, Catal. Commun., 2016, 76, 37–41 CrossRef CAS.
- Y. Y. Shang, X. Chen, W. W. Liu, P. F. Tan, H. Y. Chen, L. D. Wu, C. Ma, X. Xiong and J. Pan, Appl. Catal., B, 2017, 204, 78–88 CrossRef CAS.
- Y. P. Liu, P. Chen, Y. Chen, H. D. Lu, J. X. Wang, Z. S. Yang, Z. H. Lu, M. Li and L. Fang, RSC Adv., 2016, 6, 10802–10809 RSC.
- W. Z. Wang, W. W. Zhang, C. C. Hao, F. Wu, Y. J. Liang, H. L. Shi, J. Wang, T. Zhang and Y. Q. Hua, Sol. Energy Mater. Sol. Cells, 2016, 152, 1–9 CrossRef CAS.
- H. Y. Li, Y. J. Sun, B. Cai, S. Y. Gan, D. X. Han, L. Niu and T. S. Wu, Appl. Catal., B, 2015, 170–171, 206–214 CrossRef CAS.
- B. Wang, W. H. Feng, L. L. Zhang, Y. Zhang, X. Y. Huang, Z. B. Fang and P. Liu, Appl. Catal., B, 2017, 206, 510–519 CrossRef CAS.
- T. Hirakawa and Y. Nosaka, ACS J. Surf. Colloids, 2002, 18, 3247–3254 CrossRef CAS.
- X. W. Cheng, Q. F. Cheng, X. Y. Deng, P. Wang and H. L. Liu, Electrochim. Acta, 2015, 184, 264–275 CrossRef CAS.
- M. H. Hsu, C. J. Chang and H. T. Weng, ACS Sustainable Chem. Eng., 2016, 4, 1381–1391 CrossRef CAS.
Footnote |
| † Electronic supplementary information (ESI) available. See DOI: 10.1039/c7qi00513j |
| This journal is © the Partner Organisations 2018 |


