Photo-enhanced antibacterial activity of ZnO/graphene quantum dot nanocomposites†
Junli
Liu
ab,
Mauricio D.
Rojas-Andrade
b,
Gustavo
Chata
b,
Yi
Peng
 b,
Graham
Roseman
b,
Jia-En
Lu
b,
Glenn L.
Millhauser
b,
Chad
Saltikov
*c and
Shaowei
Chen
b,
Graham
Roseman
b,
Jia-En
Lu
b,
Glenn L.
Millhauser
b,
Chad
Saltikov
*c and
Shaowei
Chen
 *b
*b
aSchool of Materials Science and Engineering, Shaanxi University of Science and Technology, Xi'an, 710021, China
bDepartment of Chemistry and Biochemistry, University of California, 1156 High Street, Santa Cruz, California 96064, USA. E-mail: shaowei@ucsc.edu
cDepartment of Microbiology and Environmental Toxicology, University of California, 1156 High Street, Santa Cruz, California 95064, USA. E-mail: saltikov@ucsc.edu
First published on 10th November 2017
Abstract
Synthesis of new, highly active antibacterial agents has become increasingly important in light of emerging antibiotic resistance. In the present study, ZnO/graphene quantum dot (GQD) nanocomposites were produced by a facile hydrothermal method and characterized by an array of microscopic and spectroscopic measurements, including transmission electron microscopy, X-ray photoelectron spectroscopy, UV-vis and photoluminescence spectroscopy. Antibacterial activity of the ZnO/GQD nanocomposites was evaluated with Escherichia coli within the context of minimum inhibitory concentration and the reduction of the number of bacterial colonies in a standard plate count method, in comparison to those with ZnO and GQD separately. It was found that the activity was markedly enhanced under UV photoirradiation as compared to that in ambient light. This was ascribed to the enhanced generation of reactive oxygen species under UV photoirradiation, with minor contributions from membrane damage, as manifested in electron paramagnetic resonance and fluorescence microscopic measurements. The results highlight the significance of functional nanocomposites based on semiconductor nanoparticles and graphene derivatives in the development of effective bactericidal agents.
1. Introduction
The rapid spread of antibiotic resistant bacteria represents a major healthcare challenge that demands the development of alternative antimicrobial strategies.1,2 In general, antimicrobial agents are classified into two types, organic and inorganic. Organic antimicrobial agents are often less stable, particularly at high temperatures or pressures, whereas inorganic antimicrobial agents are robust and durable, and therefore have the key advantages of improved safety and stability as compared to the organic counterparts.3 Recent advances in nanotechnology have made inorganic antimicrobial agents increasingly attractive. Reports have demonstrated that functional nanomaterials, such as silver, copper, zinc and metal oxide nanoparticles, can reduce the attachment and viability of microbes, therefore have unique antibacterial activities.4–7Of these, ZnO nanoparticles have been attracting much attention, largely because of the natural abundance, chemical stability, and unique photochemical activity.8,9 Besides, ZnO is a well-studied semiconductor, with a high exciton binding energy (60 meV) and wide band gap energy (3.37 eV),10,11 and has been found to exhibit apparent (photodynamic) antimicrobial activity.12,13 For instance, Raghupathi and coworkers14 have found that ZnO nanoparticles exhibit a wide range of antibacterial effects on various microorganisms under normal lighting conditions, and activation by UV photoirradiation leads to enhanced antibacterial activity towards S. aureus cells, likely due to the production of reactive oxygen species (ROS) and deposition on the surface or accumulation in the cytoplasm of the cells. In another study,15 Applerot et al. have shown that smaller ZnO nanoparticles (from the microscale down to the nanoscale) exhibit higher antibacterial activity. That is because smaller nanoparticles may generate a larger number of hydroxyl radicals in their aqueous suspensions, due to the higher surface-to-volume ratio that facilitates the surface reaction with water. However, the relatively low dispersibility (biocompatibility) and high recombination rate of electron–hole pairs have greatly hampered the antimicrobial applications of ZnO nanoparticles.
Graphene derivatives have also emerged as new functional materials for antimicrobial applications,16 thanks to the unique properties such as high electrical conductivity,17 excellent solubility and biocompatibility,18 and relatively low cytotoxicity towards mammalian cells.2 For instance, Lim et al.19 prepared a covalently cross-linked graphene oxide (GO) membrane by a facile vacuum filtration method, and the obtained GO membrane showed excellent bactericidal activity due to oxidative stress caused by interactions of bacterial cells with the GO basal planes. In addition, nanocomposites based on metal oxide nanoparticles and graphene derivatives have also been prepared and used for antimicrobial applications. In a recent study,20 Wang et al. reported that the synergistic effects of GO and ZnO nanoparticles led to a superior antibacterial activity of the composites, as compared to the separate components. This is because GO helped disperse the ZnO nanoparticles, slowed the dissolution of ZnO, acted as the storage site for the dissolved zinc ions, and enabled intimate contact of E. coli with ZnO and zinc ions. The close contact enhanced the local zinc concentration pitting on the bacterial membrane and the permeability of the bacterial membrane and thus induced bacterial death. In another study,21 Chung et al. observed that polysulfone-ZnO–GO membranes yielded the best antibacterial properties, as compared to the individual components, due to the synergistic interactions between ZnO and GO that enhanced electron transfer and hence ROS formation for eliminating bacterial cells. In fact, recent studies22,23 have demonstrated that the combination of ZnO and GO nanoparticles is an effective strategy in maximizing the antibacterial ability, where GO serves as a structural platform to facilitate ZnO dispersion. Despite substantial progress, it should be noted that the graphene/metal oxide nanocomposites in previous studies are generally very large, of the order of 100–1000 nm, which greatly limits their dispersibility, biocompatibility and antimicrobials activity. In addition, thus far few studies have examined the effects of photoirradiation on the antibacterial performance. This is the primary motivation of the present study.
Herein, nanometer-sized composites based on ZnO nanoparticles and GQD were prepared via a facile hydrothermal method. TEM measurements showed that the nanocomposites were mostly between 30 and 40 nm in diameter. The antibacterial activity of the obtained ZnO/GQD nanocomposites was assessed and compared in ambient light and under UV photoirradiation. Marked enhancement was observed as compared to those of ZnO nanoparticles and GQD alone, and ascribed to the stabilization of the ZnO nanoparticles by GQD and the formation of ROS that was facilitated by the enhanced charge separation of photogenerated electron–hole pairs, as manifested in fluorescence microscopic and electron paramagnetic resonance (EPR) measurements.
2. Materials and methods
2.1 Chemicals
Citric acid (98%), zinc stearate (12.5–14%), sodium hydroxide (98.9%), diethylene glycol (reagent grade), hydrogen peroxide (30%), propidium iodide (PI), and Cellrox® green were all purchased from Fisher Scientific. 5,5-Dimethyl-1-pyrroline-N-oxide (DMPO, 99%) were supplied by Sigma Aldrich. All chemicals were used as received without any further purification. Water was deionized with a Barnstead Nanopure Water System (18.3 MΩ cm).2.2 Materials preparation
GQD were synthesized by adopting a literature procedure.24 Briefly, 4 g of citric acid was added into a 50 mL beaker and liquified by heating to 200 °C using a heating mantle. The color of the liquid was found to change from colorless to pale yellow, and then orange in 30 min, suggesting the formation of GQD. The obtained orange liquid was added in a dropwise fashion into 100 mL of a 10 mg mL−1 NaOH solution under vigorous stirring. After being neutralized to pH 7.0 with HCl (2 mol L−1), the solution was dialyzed in Nanopure water for one day, affording purified GQD nanosheets of ca. 15 nm in size, as determined by transition electron microscopic measurements (Fig. S1†).24ZnO/GQD nanocomposites were prepared by using a literature protocol with some modifications.25 In a typical experiment, 0.1 g of the GQD obtained above was dispersed in 120 mL of diethylene glycol under sonication, into which was then added 0.768 g of zinc stearate. The mixture was heated at 200 °C for 2 h, before being cooled down to room temperature, washed with toluene 3 times, and dialyzed in Nanopure water for one day, affording ZnO/GQD nanocomposites (dark brown) that could be readily dispersed in water.
Water-soluble ZnO nanoparticles were prepared in the same manner but without the addition of GQD.
2.3 Characterizations
Transmission electron microscopic (TEM) studies were carried out with a Philips CM300 microscope operated at 300 kV. UV-vis absorption spectra were acquired with a PerkinElmer Lambda 35 UV-vis spectrometer, and photoluminescence (PL) measurements were conducted with a PTI fluorospectrometer. X-ray photoelectron spectroscopic (XPS) measurements were performed with a PHI 5400/XPS instrument equipped with Al Kα radiation operated at 350 W and 10−9 Torr.2.4 Bacterial suspension and treatment
2.5 Cell death analysis
E. coli suspensions used for imaging were prepared by washing 1 mL of overnight liquid cultures with Nanopure water as described above, but excluding the final dilution to 0.100 optical density. The washed E. coli suspension was then incubated with 10 μM of Cellrox® green or PI for 15 min in the dark. Upon completion of this incubation period, the cells were centrifuged and resuspended in 1 mL of various nanoparticle solutions, before a 10 μL drop of this new suspension was placed onto a 1.5 microscope cover slip (0.17 mm thickness) and used for fluorescence imaging. Images were acquired on a Solamere Spinning disk confocal microscope equipped with a Nikon TE2000 inverted stand, a CSU-X1 spinning disk, and a Hamamatsu ImageEMX2 camera. A 488 nm and 580 nm laser was utilized as the excitation source, and a 100× (1.4 NA) Nikon Plan Apo was utilized as the objective lens.2.6 ROS measurement
To quantify ROS concentrations, 63 μL of the as-prepared particles was mixed with 7 μL of 1 mol L−1 DMPO, with the mixture of Nanopure water and DMPO as the control. Then 50 μL of the solution was added to a capillary tube which was then inserted into a quartz EPR tube (Wilmad, 4 mm outer diameter). The tube was centered in the cavity resonator for data collection. Spectra were recorded at room temperature with a Bruker EMX EPR spectrometer operating at the X-band frequency (∼9.4 GHz) using an ER 4122SHQE resonator (Bruker). The samples were subsequently irradiated for 1 min with 365 nm UV light, and another set of spectra was collected.3. Results and discussion
3.1 Structural characterizations
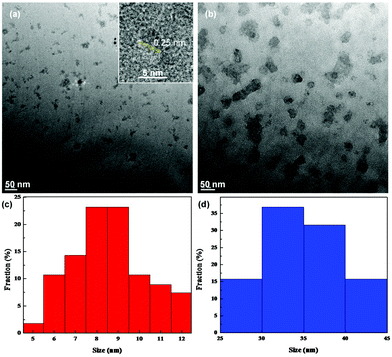
The structures of the samples were first examined by TEM measurements. Fig. 1 depicts the representative TEM images of (a) ZnO and (b) ZnO/GQD nanocomposites. From panel (a), it can be seen that the as-produced ZnO nanoparticles, of about 10 nm in diameter, were dispersed rather well without apparent aggregation, most likely because the ZnO nanoparticles synthesized via the polyol hydrolysis route were capped with an ester compound.26 In addition, high-resolution TEM studies showed well-defined lattice fringes with an interplanar distance of ca. 0.25 nm (inset to Fig. 1a), consistent with the d-spacing between the (101) crystalline planes of hexagonal ZnO.27 Statistical analysis based on more than 100 nanoparticles showed that the nanoparticles were in the range of 5 to 12 nm in diameter, with an average of 8.37 ± 2.72 nm, as manifested in the core size histogram in panel (c). This is larger than the Bohr radius of ZnO (2.34 nm),28 and thus no quantum confinement effect is anticipated. Good dispersion can also be seen with the ZnO/GQD nanocomposites (note that ZnO/GQD can be readily dispersed in water, forming a transparent solution, as shown in the inset to Fig. 2), which were markedly larger at about 50 nm (Fig. 1b). From the core size histogram in Fig. 1d, one can see that the majority of the ZnO/GQD nanocomposites were within the range of 30 to 40 nm, with an average of 32.50 ± 4.00 nm. Note that the GQDs cannot be resolved in the TEM image because of low electron density. However, the formation of ZnO/GQD nanocomposites is clearly manifested in XPS measurements (Fig. S2 and Table S1†), where the C/Zn atomic ratio increased from 108.8![[thin space (1/6-em)]](https://www.rsc.org/images/entities/char_2009.gif) :
:![[thin space (1/6-em)]](https://www.rsc.org/images/entities/char_2009.gif) 1 for ZnO to 141.7
1 for ZnO to 141.7![[thin space (1/6-em)]](https://www.rsc.org/images/entities/char_2009.gif) :
:![[thin space (1/6-em)]](https://www.rsc.org/images/entities/char_2009.gif) 1 for ZnO/GQD because of the additional carbon from GQD.
1 for ZnO/GQD because of the additional carbon from GQD.
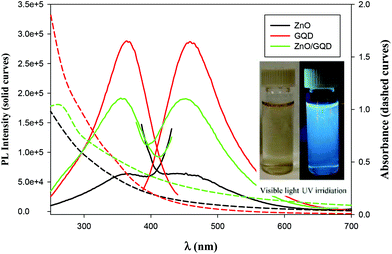
The optical properties of the samples were then examined by UV-vis and PL measurements. From Fig. 2, one can see that whereas the ZnO nanoparticles, GQD and ZnO/GQD nanocomposites all exhibited a largely featureless, exponential decay profile in UV-vis absorption (dashed curves), apparent PL emissions can be clearly seen (solid curves). For ZnO nanoparticles (black curves), the excitation and emission peaks can be identified at ca. 362 and 450 nm, respectively, consistent with the direct band gap of 3.37 eV for ZnO.28 Interestingly, the excitation and emission maxima for GQD (red curves) happened to appear at about the same wavelength positions (365 and 460 nm), similar to results reported in previous studies;29–31 yet the PL intensity was about one order of magnitude higher, suggesting a markedly higher PL quantum yield. In the ZnO/GQD nanocomposites (green curves), the excitation and emission maxima remained virtually unchanged (no apparent emission was observed when excited by visible light, as depicted in Fig. 2 inset), but the normalized intensity was in the intermediate between those of ZnO and ZnO/GQD, likely due to interfacial charge transfer from GQD to ZnO under photoexcitation that partially quenched the PL emission of the GQD.32
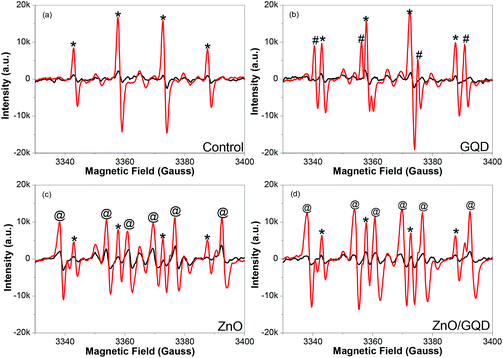
Notably, the samples produced above all facilitate the formation of ROS under UV photoirradiation. Fig. 3 depicts the EPR spectra of (a) pure water, and water solutions of (b) GQD, (c) ZnO, and (d) ZnO/GQD, by using DMPO as the spin trap for hydroxyl radicals (˙OH) where the resulting adduct DMPO-OH is a relatively stable paramagnetic species with a characteristic EPR profile.33 It can be seen that under ambient room light, no apparent EPR signals were produced with any of the samples (black curves), whereas exposure to UV light (365 nm) for only 1 min led to the emergence of well-defined EPR signals (red curves), which varied among the series of samples. From panel (a), one can see that with DMPO alone in water, a quartet of peaks (marked by asterisks) emerged within the range of magnetic field strength of 3340 to 3400 G under UV photoirradiation, with a hyperfine splitting of aH = aN = 14.9 G and an intensity ratio of ca. 1![[thin space (1/6-em)]](https://www.rsc.org/images/entities/char_2009.gif) :
:![[thin space (1/6-em)]](https://www.rsc.org/images/entities/char_2009.gif) 2
2![[thin space (1/6-em)]](https://www.rsc.org/images/entities/char_2009.gif) :
:![[thin space (1/6-em)]](https://www.rsc.org/images/entities/char_2009.gif) 2
2![[thin space (1/6-em)]](https://www.rsc.org/images/entities/char_2009.gif) :
:![[thin space (1/6-em)]](https://www.rsc.org/images/entities/char_2009.gif) 1, consistent with the UV-induced formation of DMPO-OH adducts, as observed previously.34 With the addition of GQD, in addition to the DMPO-OH quartet (*), a new sextet, where two of the lines are overlapped by the middle two lines of the DMPO-OH adduct signal, (marked by #) can be seen in panel (b) in the same range of magnetic field strength, with a hyperfine splitting of aH = 18.5 G and aN = 15.9 G, suggesting the formation of carboxyl radical (CO2˙−) adduct.34 This may be ascribed to the rich carboxylic functional moieties on the GQD surface (Fig. S2†) that underwent decarboxylation under UV photoirradiation.35–37
1, consistent with the UV-induced formation of DMPO-OH adducts, as observed previously.34 With the addition of GQD, in addition to the DMPO-OH quartet (*), a new sextet, where two of the lines are overlapped by the middle two lines of the DMPO-OH adduct signal, (marked by #) can be seen in panel (b) in the same range of magnetic field strength, with a hyperfine splitting of aH = 18.5 G and aN = 15.9 G, suggesting the formation of carboxyl radical (CO2˙−) adduct.34 This may be ascribed to the rich carboxylic functional moieties on the GQD surface (Fig. S2†) that underwent decarboxylation under UV photoirradiation.35–37
When ZnO nanoparticles were added instead into the solution, in addition to the DMPO-OH quartet (*), six new lines can be readily identified (marked by @) in Fig. 3c. These actually consist of three doublets (3338, 3360; 3354, 3376; and 3369, 3392 G), from which the hyperfine splitting was estimated to be aH = 15.6 G and aN = 22.9 G, suggesting adduct formation of DMPO with H˙ radicals34 that were likely produced by ZnO-catalyzed photoreduction of water.38–40 Interestingly, for the solution containing ZnO/GQD nanocomposites, the EPR profiles in panel (d) look almost identical to those with ZnO alone (Fig. 3c), indicating that radical formation was primarily due to the photochemical activity of ZnO, with minimal contributions from GQD. This is actually in good agreement with the PL results (Fig. 2) that suggests interfacial charge transfer from GQD to ZnO in the ZnO/GQD nanocomposites. This unique property may have substantial impacts on the antimicrobial activity of the nanocomposites under UV photoirradiation (vide infra).41
3.2 Antibacterial activities
The antimicrobial activity of ZnO, GQD and ZnO/GQD nanocomposites, within the context of MIC,42–44 was then quantified by monitoring the growth of Gram-negative E. coli in liquid media over time, and compared in ambient room light and under UV photoirradiation. Fig. 4 shows the growth curves of E. coil in ambient room light in MH broth containing (a) ZnO, (b) GQD, and (c) ZnO/GQD at different concentrations. It can be seen that ZnO nanoparticles exhibited a marked inhibitory effect on the growth of E. coli colonies, as compared to the blank control (Fig. 4a). For instance, the addition of 1.2 mg mL−1 ZnO nanoparticles into the growth media significantly suppressed bacterial growth, and at concentrations above 1.6 mg mL−1, no growth of bacteria was observed. That is, the MIC was estimated to be 1.6 mg mL−1. In contrast, much weaker inhibition was observed with GQD alone. Even at concentrations as high as 9.0 mg mL−1, apparent growth of bacteria remained visible, although the growth was slowed with increasing GQD concentration (Fig. 4b). In fact, studies have been scarce where apparent antibacterial performance is observed with bare graphene derivatives.45 For the ZnO/GQD nanocomposites (Fig. 4c), apparent inhibition of bacterial growth can also be seen, with the inhibitory effect in the intermediate between those of ZnO and GQD. From Fig. 4c, one can see that bacterial growth was diminished with increasing ZnO/GQD concentration and essentially stopped at concentrations above 3.2 mg mL−1. This suggests an MIC of ca. 3.2 mg mL−1. The fact that ZnO nanoparticles exhibited higher antimicrobial activity in ambient room light than ZnO/GQD might be accounted for by the smaller size of the nanoparticles in the former (Fig. 1). In fact, in a prior study with even smaller ZnO nanoparticles (dia. 3 nm), the MIC for E. coli was markedly lower at only 1 mg mL−1.46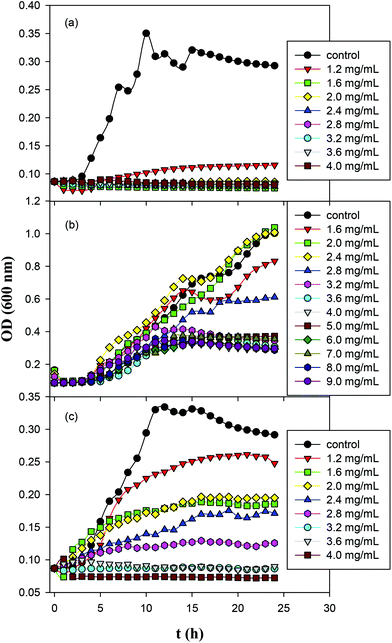 | ||
| Fig. 4 Growth curves of E. coil in Mueller Hinton broth containing (a) ZnO; (b) GQD; and (c) ZnO/GQD nanocomposites for 24 h in ambient room light. | ||
Fig. S3† depicts the growth curves of Gram-positive S. aureus in MH agar with the addition of ZnO, GQD and ZnO/GQD nanocomposites at varied concentrations. One can see that for both ZnO and ZnO/GQD, the MIC was lower than 1.6 mg mL−1; and apparent inhibition of bacterial growth even occurred with GQD alone, where the MIC was estimated to be ca. 4 mg mL−1. It is worth noting that all three samples displayed higher antibacterial activity for S. aureus than for E. coli, likely due to the absence of the outer membrane of the former such that the bacterial cells are more receptive to antibiotic agents. Further studies are desired to unravel the mechanistic insights.
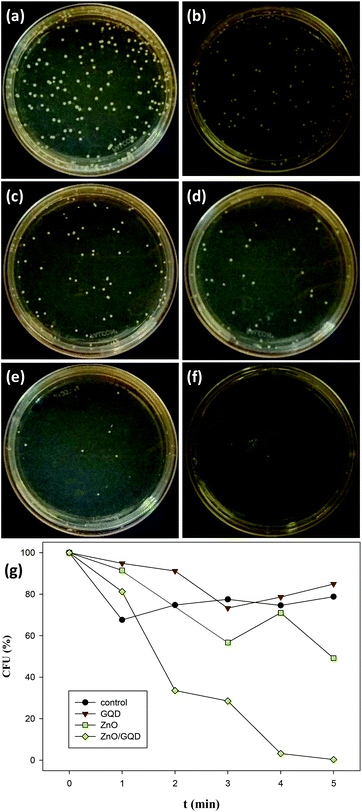
The antimicrobial activity of the samples was then tested under UV photoirradiation.47,48 Experimentally, E. coli cells were added into the nanoparticle solution, and the mixture was exposed to UV illumination for different periods of time, and incubated for 18 h at room temperature before the number of E. coli cells was counted. Based on the above MIC experiments, the concentrations of nanoparticles chosen for this set of experiments were all set below the MIC at 1 mg mL−1 to highlight the effects of photoirradiation on the antibacterial activities. The viable bacteria were monitored by counting the number of colony-forming units (CFU).
Fig. 5a–f depicts the photographs of E. coli colonies cultured under UV photoirradiation for up to 5 min in the presence of ZnO/GQD nanocomposites. One can see that the number of bacterial colonies decreased drastically with prolonging photoirradiation time, and after 5 min's UV exposure, there was virtually no bacterial colonies in sight. Apparent inhibition effects can also be observed with ZnO nanoparticles, whereas GQDs exhibited only minimal bactericidal activity, as compared to the control experiment where bacteria colonies were exposed to UV lights but in the absence of GQD, ZnO or ZnO/GQD (Fig. S4†). More quantitative analysis of the discrepancy of the antimicrobial activity among the series is illustrated in the photodynamic plot in Fig. 5g. For the control experiment where no nanoparticle was added, ca. 80% of the E. coli cells survived after exposure to UV light for 5 min, indicating that UV photoirradiation alone was not effective in bacteria elimination. In the presence of GQD, there was almost no difference, where about 85% of the bacterial cells survived 5 min's UV exposure, suggesting the lack of photoactivity of the GQDs. By contrast, ZnO nanoparticles exhibited much enhanced bactericidal activity. At 5 min, only ca. 50% of the bacterial cells survived. This might be ascribed to the small size of the ZnO nanoparticles (Fig. 1) that facilitated the penetration of the nanoparticles into the bacterial membrane,12,49 and hence inhibited bacterial growth. Even more drastic enhancement can be seen with ZnO/GQD nanocomposites, where 5 min's UV exposure eliminated virtually 100% of the bacterial cells.20,21
The photo-enhanced antimicrobial activity of ZnO/GQD nanocomposites may be accounted for, at least in part, by the ready production of ROS due to effective interfacial charge transfer from GQD to ZnO, as demonstrated in the afore-mentioned PL (Fig. 2) and EPR (Fig. 3) measurements.2,21,50 Mechanistically, the main step involves the photogeneration of electron–hole pairs,51 where the photoexcited electrons in the conduction band may reduce dissolved oxygen to produce superoxide radicals (O2˙−), whereas the hole in the valence band can react with H2O or OH− adsorbed on the oxide surface to produce hydroxyl radicals (˙OH), hydrogen peroxide (H2O2), and/or protonated superoxide radical (HO2˙). These radical species were then responsible for the bactericidal actions.52,53 This interpretation is in good agreement with results from fluorescence microscopic measurements, as detailed below.
3.3 Fluorescence microscopic studies
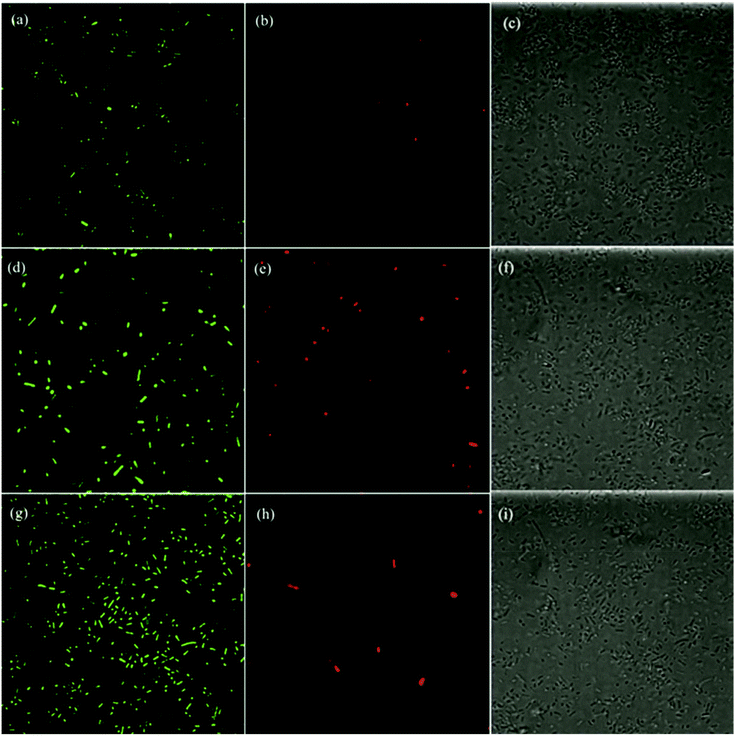
Further mechanistic insights into the antimicrobial activity were obtained in fluorescence microscopic measurement where the morphological changes of the E. coli cells were examined in the presence of ZnO, GQD, and ZnO/GQD nanocomposites. Fig. 6 depicts the fluorescence micrographs where E. coli cells were treated with (a–c) GQD, (d–f) ZnO nanoparticles and (g–i) ZnO/GQD nanocomposites. In the left column, Cellrox® green was used as the fluorescence probe. Note that Cellrox® green is a cell-permeable reagent and non-fluorescent in reduced state, but may bind to DNA and exhibit apparent green fluorescence upon oxidation by, for instance, ROS. Thus, it may be used to visualize ROS production during the bactericidal actions. From the figure, apparent green fluorescence can be seen with E. coli cells exposed to (a) GQD, (d) ZnO, and (g) ZnO/GQD (under the excitation of 488 nm), suggesting that ROS species were indeed generated; and in comparison with the total number of bacteria cells from the bright-field images in the right column (Fig. 6c, f and i), one can see that green fluorescence cells accounted for 5.5% of the population in the presence of GQD, 3.3% for ZnO, and 8.8% for ZnO/GQD. This indicates that the ROS concentration reached the maximum with ZnO/GQD, consistent with the observation that ZnO/GQD nanocomposites stood out as the best antimicrobial reagent among the series. This suggests that ROS production was most likely responsible for the antimicrobial activity.As membrane damage may also contribute to the antimicrobial activity,2 further studies were carried out by using PI as the fluorescence dye instead. PI cannot penetrate cell membranes and thus is generally excluded from viable cells. Yet for damaged cells where double-stranded DNA becomes accessible, PI may be intercalated between the base pairs and emit apparent red fluorescence when excited at 580 nm. From the fluorescence micrographs in the middle column of Fig. 6, one can see that overall the number of red fluorescent cells was small, only 0.15% with GQD, 0.96% with ZnO, and 0.41% with ZnO/GQD, suggesting minor contributions from membrane damage to the overall antimicrobial activity.12,54
Taken together, these results strongly suggest that the remarkable photo-induced antibacterial activity of ZnO/GQD nanocomposite most likely arose from the improved stabilization of the ZnO nanoparticles by GQD and hence good dispersibility of the ZnO/GQD nanocomposites, such that the interfacial charge transfer from GQD to ZnO facilitated the production of ROS, with minor contributions from membrane damage.21
4. Conclusion
In this study, highly dispersible ZnO/GQD nanocomposites were prepared by a facile hydrothermal method and exhibited markedly enhanced antibacterial activity towards E. coli under UV photoirradiation, as compared to that in ambient room light. The bactericidal activity was also found to be markedly better than those of ZnO and GQD alone. This was accounted for by effective interfacial charge transfer from GQD to ZnO that facilitated the formation of hydroxy radicals, as manifested in PL and EPR measurements. Fluorescence microscopic measurements showed that the antimicrobial activity was primarily due to ROS formation whereas membrane damage played a minor role. The results highlight the significance of functional nanocomposites based on oxide semiconductor nanoparticles and graphene derivatives in the development of effective antibacterial agents.Conflicts of interest
There are no conflicts to declare.Acknowledgements
This work was supported, in part, by the National Science Foundation (DMR-1409396 and CHE-1710408) and by the Merced Nanomaterials Center for Energy and Sensing (MACES), a NASA funded MIRO center, under award NNX15AQ01. J. L. L. thanks the China Scholarship Council for a research fellowship. TEM and XPS work was carried out at the National Center for Electron Microscopy and Molecular Foundry of Lawrence Berkeley National Laboratory as part of a user project.References
- S. Ambika and M. Sundrarajan, J. Photochem. Photobiol., B, 2015, 146, 52–57 CrossRef CAS PubMed.
- M. D. Rojas-Andrade, G. Chata, D. Rouholiman, J. L. Liu, C. Saltikov and S. W. Chen, Nanoscale, 2017, 9, 994–1006 RSC.
- A. Joe, S. H. Park, K. D. Shim, D. J. Kim, K. H. Jhee, H. W. Lee, C. H. Heo, H. M. Kim and E. S. Jang, J. Ind. Eng. Chem., 2017, 45, 430–439 CrossRef CAS.
- D. D. Sun, W. W. Zhang, Z. P. Mou, Y. Chen, F. Guo, E. D. Yang and W. Y. Wang, ACS Appl. Mater. Interfaces, 2017, 9, 10047–10060 CAS.
- A. Eivazihollagh, J. Backstrom, C. Dahlstrom, F. Carlsson, I. Ibrahem, B. Lindman, H. Edlund and M. Norgren, Mater. Lett., 2017, 187, 170–172 CrossRef CAS.
- K. Lingaraju, H. R. Naika, K. Manjunath, R. B. Basavaraj, H. Nagabhushana, G. Nagaraju and D. Suresh, Appl. Nanosci., 2016, 6, 703–710 CrossRef CAS.
- J. Podporska-Carroll, A. Myles, B. Quay, D. E. McCormack, R. Fagan, S. J. Hinder, D. D. Dionysiou and S. C. Pillai, J. Hazard. Mater., 2017, 324, 39–47 CrossRef CAS PubMed.
- Y. C. Hao, X. L. Dong, X. Y. Wang, S. R. Zhai, H. C. Ma and X. F. Zhang, J. Mater. Chem. A, 2016, 4, 8298–8307 CAS.
- J. C. Bear, N. Hollingsworth, P. D. McNaughter, A. G. Mayes, M. B. Ward, T. Nann, G. Hogarth and I. P. Parkin, Angew. Chem., Int. Ed., 2014, 53, 1598–1601 CrossRef CAS PubMed.
- S. Daumann, D. Andrzejewski, M. Di Marcantonio, U. Hagemann, S. Wepfer, F. Vollkommer, G. Bacher, M. Epple and E. Nannen, J. Mater. Chem. C, 2017, 5, 2344–2351 RSC.
- D. L. Ding, W. Lan, Z. W. Yang, X. H. Zhao, Y. X. Chen, J. Y. Wang, X. T. Zhang, Y. Zhang, Q. Su and E. Q. Xie, Mater. Sci. Semicond. Process., 2016, 47, 25–31 CrossRef CAS.
- J. M. Wu and L. Y. Tsay, Nanotechnology, 2015, 26, 395704 CrossRef PubMed.
- S. Saha and P. Sarkar, RSC Adv., 2014, 4, 1640–1645 RSC.
- K. R. Raghupathi, R. T. Koodali and A. C. Manna, Langmuir, 2011, 27, 4020–4028 CrossRef CAS PubMed.
- G. Applerot, A. Lipovsky, R. Dror, N. Perkas, Y. Nitzan, R. Lubart and A. Gedanken, Adv. Funct. Mater., 2009, 19, 842–852 CrossRef CAS.
- W. S. Kuo, C. Y. Chang, H. H. Chen, C. L. L. Hsu, J. Y. Wang, H. F. Kao, L. C. S. Chou, Y. C. Chen, S. J. Chen, W. T. Chang, S. W. Tseng, P. C. Wu and Y. C. Pu, ACS Appl. Mater. Interfaces, 2016, 8, 30467–30474 CAS.
- J. G. Wang, S. Cao, Y. Ding, F. C. Ma, W. G. Lu and M. T. Sun, Sci. Rep., 2016, 6, 24850 CrossRef CAS PubMed.
- Y. Li, Z. Y. Wu, D. Du, H. Q. Dong, D. L. Shi and Y. Y. Li, RSC Adv., 2016, 6, 6516–6522 RSC.
- M. Y. Lim, Y. S. Choi, J. Kim, K. Kim, H. Shin, J. J. Kim, D. M. Shin and J. C. Lee, J. Membr. Sci., 2017, 521, 1–9 CrossRef CAS.
- Y. W. Wang, A. N. Cao, Y. Jiang, I. Zhang, J. H. Liu, Y. F. Liu and H. F. Wang, ACS Appl. Mater. Interfaces, 2014, 6, 2791–2798 CAS.
- Y. T. Chung, E. Mahmoudi, A. W. Mohammad, A. Benamor, D. Johnson and N. Hilal, Desalination, 2017, 402, 123–132 CrossRef CAS.
- R. K. Mishra, Y. Shalom, V. B. Kumar, J. H. T. Luong, A. Gedanken and E. Banin, J. Mater. Chem. B, 2016, 4, 6706–6715 RSC.
- W. C. Hung, K. H. Wu, D. Y. Lyu, K. F. Cheng and W. C. Huang, Mater. Sci. Eng., C, 2017, 75, 1019–1025 CrossRef CAS PubMed.
- Y. Q. Dong, J. W. Shao, C. Q. Chen, H. Li, R. X. Wang, Y. W. Chi, X. M. Lin and G. N. Chen, Carbon, 2012, 50, 4738–4743 CrossRef CAS.
- X. Tang, E. S. Choo, L. Li, J. Ding and J. Xue, Langmuir, 2009, 25, 5271–5275 CrossRef CAS PubMed.
- X. S. Tang, E. S. G. Choo, L. Li, J. Ding and J. M. Xue, Langmuir, 2009, 25, 5271–5275 CrossRef CAS PubMed.
- X. Huang, M.-G. Willinger, H. Fan, Z.-L. Xie, L. Wang, A. Klein-Hoffmann, F. Girgsdies, C.-S. Lee and X.-M. Meng, Nanoscale, 2014, 6, 8787–8795 RSC.
- R. T. Senger and K. K. Bajaj, Phys. Rev. B: Condens. Matter Mater. Phys., 2003, 68, 045313 CrossRef.
- J. Mehta, N. Bhardwaj, S. K. Bhardwaj, S. K. Tuteja, P. Vinayak, A. K. Paul, K. H. Kim and A. Deep, Anal. Biochem., 2017, 523, 1–9 CrossRef CAS PubMed.
- R. L. Liu, D. Q. Wu, X. L. Feng and K. Mullen, J. Am. Chem. Soc., 2011, 133, 15221–15223 CrossRef CAS PubMed.
- J. H. Shen, Y. H. Zhu, C. Chen, X. L. Yang and C. Z. Li, Chem. Commun., 2011, 47, 2580–2582 RSC.
- M. Dutta, S. Sarkar, T. Ghosh and D. Basak, J. Phys. Chem. C, 2012, 116, 20127–20131 CAS.
- T. Dutta, R. Sarkar, B. Pakhira, S. Ghosh, R. Sarkar, A. Barui and S. Sarkar, RSC Adv., 2015, 5, 80192–80195 RSC.
- G. R. Buettner, Free Radical Biol. Med., 1987, 3, 259–303 CrossRef CAS PubMed.
- G. Q. He, Y. Song, K. Liu, A. Walter, S. Chen and S. W. Chen, ACS Catal., 2013, 3, 831–838 CrossRef CAS.
- Y. Song and S. W. Chen, ACS Appl. Mater. Interfaces, 2014, 6, 14050–14060 CAS.
- K. Liu, Y. Song and S. W. Chen, Int. J. Hydrogen Energy, 2016, 41, 1559–1567 CrossRef CAS.
- S. Y. Guo, T. J. Zhao, Z. Q. Jin, X. M. Wan, P. G. Wang, J. Shang and S. Han, J. Power Sources, 2015, 293, 17–22 CrossRef CAS.
- A. Lipovsky, Z. Tzitrinovich, H. Friedmann, G. Applerot, A. Gedanken and R. Lubart, J. Phys. Chem. C, 2009, 113, 15997–16001 CAS.
- A. Lipovsky, Y. Nitzan, A. Gedanken and R. Lubart, Nanotechnology, 2011, 22, 105101 CrossRef PubMed.
- J. Z. Ma, A. P. Hui, J. L. Liu and Y. Bao, Mater. Lett., 2015, 158, 420–423 CrossRef CAS.
- M. Rojas-Andrade, A. T. Cho, P. G. Hu, S. J. Lee, C. P. Deming, S. W. Sweeney, C. Saltikov and S. W. Chen, J. Mater. Sci., 2015, 50, 2849–2858 CrossRef CAS.
- M. Saghalli, S. K. Bidoki, A. Jamali, H. Bagheri and E. A. Ghaemi, Indian J. Pharm. Sci., 2016, 78, 763–768 Search PubMed.
- J. Pasquet, Y. Chevalier, E. Couval, D. Bouvier, G. Noizet, C. Morliere and M. A. Bolzinger, Int. J. Pharm., 2014, 460, 92–100 CrossRef CAS PubMed.
- S. Chen, Y. Quan, Y. L. Yu and J. H. Wang, ACS Biomater. Sci. Eng., 2017, 3, 313–321 CrossRef CAS.
- Z. Emami-Karvani and P. Chehrazi, Afr. J. Microbiol. Res., 2011, 5, 1368–1373 CAS.
- O. Akhavan, R. Azimirad, S. Safa and M. M. Larijani, J. Mater. Chem., 2010, 20, 7386–7392 RSC.
- B. Z. Ristic, M. M. Milenkovic, I. R. Dakic, B. M. Todorovic-Markovic, M. S. Milosavljevic, M. D. Budimir, V. G. Paunovic, M. D. Dramicanin, Z. M. Markovic and V. S. Trajkovic, Biomaterials, 2014, 35, 4428–4435 CrossRef CAS PubMed.
- S. H. Hsu, Y. Y. Lin, S. Huang, K. W. Lem, D. H. Nguyen and D. S. Lee, Nanotechnology, 2013, 24, 475102 CrossRef PubMed.
- A. R. Chowdhuri, S. Tripathy, S. Chandra, S. Roy and S. K. Sahu, RSC Adv., 2015, 5, 49420–49428 RSC.
- H. Kong, J. Song and J. Jang, Environ. Sci. Technol., 2010, 44, 5672–5676 CrossRef CAS PubMed.
- V. Etacheri, M. K. Seery, S. J. Hinder and S. C. Pillai, Inorg. Chem., 2012, 51, 7164–7173 CrossRef CAS PubMed.
- V. Etacheri, G. Michlits, M. K. Seery, S. J. Hinder and S. C. Pillai, ACS Appl. Mater. Interfaces, 2013, 5, 1663–1672 CAS.
- R. K. Dutta, B. P. Nenavathu and M. K. Gangishetty, J. Photochem. Photobiol., B, 2013, 126, 105–111 CrossRef CAS PubMed.
Footnote |
| † Electronic supplementary information (ESI) available: XPS data and analysis, and growth curves of S. aureus. See DOI: 10.1039/c7nr07367d |
| This journal is © The Royal Society of Chemistry 2018 |

