Z-scheme CaIn2S4/Ag3PO4 nanocomposite with superior photocatalytic NO removal performance: fabrication, characterization and mechanistic study†
Shipeng
Wan
 ab,
Man
Ou
 ab,
Qin
Zhong
 *ab and
Shule
Zhang
 ab
ab
aSchool of Chemical Engineering, Nanjing University of Science and Technology, Nanjing, Jiangsu 210094, P. R. China. E-mail: zq304@mail.njust.edu.cn; Fax: +86 25 84315517; Tel: +86 25 84315517
bNanjing AIREP Environmental Protection Technology Co., Ltd, Nanjing, Jiangsu 210091, P. R. China
First published on 20th November 2017
Abstract
The development of the economy benefits from fossil fuels, but their consumption inevitably results in environmental pollution. For example, nitric oxide (NO) removal from coal-fired flue gas is a significant aspect of atmospheric pollution control. Based on its unique advantages to resolve atmospheric pollution, photocatalytic oxidation (PCO) is regarded as an effective technique to remove NO. Herein, we have first fabricated Z-scheme CaIn2S4/Ag3PO4 nanocomposites and studied their performance in the PCO of NO (400 ppm) with the assistance of H2O2. The results indicate that the CaIn2S4/Ag3PO4 nanocomposites exhibit superior photocatalytic performance, and the PCO efficiency of NO can reach 83.61%. The excellent photocatalytic ability belongs to the low recombination rate of the photoinduced electron–hole pairs. The production and participation of more active species is another critical factor due to the injected H2O2. FTIR and ion chromatography results reveal that NO3− is the final product. Furthermore, the fluorescence spectra combined with the electron spin resonance and the trapping experiment suggest that ˙OH and ˙O2− might play a predominant role in NO removal.
1. Introduction
Over the past few decades, TiO2-based photocatalytic technology has been widely explored and used for environmental remediation and for energy production.1–6 Still, its practical applications cannot be generalized due to the poor visible-light response of TiO2. Instead, ternary metal sulfides have received increasing attention because of their unique photoelectrochemical characteristics and photocatalytic ability.7–11 In the case of CaIn2S4 (CIS), it is not only the cheapest alkali earth metal-based semiconductor material, but it also possesses suitable band gaps and good photocatalytic activity and can be easily fabricated.12 It has been used for photocatalytic pollution degradation and photocatalytic water splitting to H2.13,14 However, ternary metal sulfides usually have drawbacks of self-photooxidation and rapid charge recombination. Accordingly, it is indispensable to explore a novel pathway to improve the transfer efficiency of photoexcited electrons and holes in ternary metal sulfides.Recently, Ag3PO4 (APO), another excellent visible-light response semiconductor, has also aroused much attention in the photocatalytic water oxidation of O2 and pollution degradation.15–18 The semiconductor with a positive valence band potential (2.90 eV) is regarded as a promising material for the photocatalytic oxidation (PCO) of nitric oxide (NO) (E0 (HNO3/NO) = 0.94 eV).19,20 For example, the Wang group has fabricated hollow spherical APO and studied its photocatalytic activity on dyes.21 But pure APO usually suffers from high carrier recombination and the self-reduction process, leading to a relatively poor photocatalytic performance. To resolve this problem, many strategies have been attempted, among which the construction of Z-scheme photocatalysts has been considered as an effective method for improving the photocatalytic performance. Based on this idea, the Yi group fabricated a Z-scheme g-C3N4/Ag3PO4 composite and the experimental results indicated that the composites exhibited excellent performance on ethylene photodegradation.22 The Du group also synthesized Z-scheme g-C3N4/Ag3PO4 hybrids with enhanced photocatalytic degradation ability towards phenol dyes, such as bisphenol A.23 Inspired by these works, we expected that APO and CIS could form a Z-scheme CIS/APO nanocomposite to suppress their self-photocorrosion and promote the separation of photoexcited charge carriers. What's more, little attention has been paid to the PCO of NO by using the Z-scheme CIS/APO photocatalyst.
Herein, a Z-scheme CIS/APO nanocomposites was first successfully designed by a facile wet-impregnation method, which was expected to improve the separation efficiency of photoexcited electrons and holes in CIS and APO, thus enhancing the photocatalytic ability. The enhanced PCO efficiency of NO for the CIS/APO nanocomposite was achieved under visible light, and the reasons for this were analyzed minutely. Finally, the photocatalytic reaction production and the photocatalytic oxidation mechanism of NO removal were also investigated by a fluorescence technique, electron spin resonance experiments and spin trapping experiments.
2. Experimental section
2.1 Sample preparation
CaIn2S4 was fabricated by a hydrothermal method. 1.2 g of Ca(NO3)2·4H2O, 3.0 g of In(NO3)3·xH2O (molecular weight: 301 g mol−1) and 3.0 g of CH3CSNH2 were added to 80 mL of deionized water and stirred for 30 min. The corresponding pH was 1. Then the mixed solution was transferred into a 100 mL Teflon-lined stainless steel autoclave and maintained at 160 °C for 12 h. Thereafter, the autoclave was cooled to room temperature. The precipitate was centrifuged and washed with deionized water and ethanol. The final sample, denoted as CIS, was dried at 80 °C for 12 h.Ag3PO4 was synthesized by the facile precipitation method. First, 1.43 g of Na2HPO4 powder was dispersed in 50 mL of deionized water, then 1.70 g of AgNO3 was added to the solution until the initial colour changed to yellow. After that, the product was washed with distilled water and dried at 80 °C overnight. The obtained Ag3PO4 powder was labeled as APO.
CaIn2S4/Ag3PO4 (x%-CIS/APO; x = 0, 2, 5, 10, and 15) composites were synthesized by using a wet impregnation method. 0.3 g of yellow APO powders were dispersed in 50 mL of deionized water to form an APO suspension by an ultrasonic method for 30 min. Then the calculated amount of CIS was added to the suspension under stirring and kept for 24 h. Afterward, the final solid materials were dried at 80 °C for 12 h.
2.2 Sample characterization
To investigate the structural characteristics and chemical information of the materials, they were characterized by X-ray diffraction (XRD, Cu Kα, Purkinje XD-3), X-ray photoelectron spectroscopy (XPS, PHI-5000C ESCA), transmission electron microscopy (TEM, JEOL JEM-2100), field-emission scanning electron microscopy (SEM, FEI Quanta 250F), UV/Vis diffuse reflectance spectra (DRS, Shimadzu UV-2550, Ion Chromatography (IC, DionexICS90)), and photoluminescence spectra (PL, He-Cd laser, Labram-HR800). Electron spin resonance signals of the spin-trapped paramagnetic species with 5,5-dimethyl-l-pyrroline-N-oxide (DMPO) were recorded with a Bruker EMX-10/12-type spectrometer.2.3 Photocatalytic activity of NO removal
The photocatalytic activity of the CIS/APO composites was evaluated by removing NO at the ppm level (Fig. S1, ESI†). The reactor was made of a stainless steel reactor and covered with quartz glass. A 300 W xenon lamp with a UV cut-off filter (λ > 420 nm) was vertically placed above the reactor. 0.1 g of samples was uniformly dispersed in a small piece of cotton (d = 3.5 cm and h = 0.5 cm) and then placed on a porous Teflon omentum. The Teflon omentum was placed in the middle of the reactor. Gases were acquired from three compressed standard gas cylinders filled with O2, N2 and 2% NO in N2, respectively. The premixed reactant gases consisted of 400 ppm NO, 7% O2 and N2 balance, and fed into the photocatalytic reactor at a flow rate of 100 mL min−1. After reaching the adsorption–desorption equilibrium between gases and photocatalysts, hydrogen peroxide was introduced into the reactor via a peristaltic pump at a flow rate of 7.5 × 10⁻³ mL min−1. Simultaneously, the xenon lamp was turned on. The concentration of NO was detected every 10 min using a flue gas analyzer. The removal efficiency of NO is defined as: NO conversion% = (NOin − NOout)/NOin × 100%.2.4 Trapping experiment
As observed in Fig. S2 (ESI†), six quartz tubes were divided into four experimental groups (a–d) and two control groups (e–f). Groups (a–e) were filled with 4 mL of H2O2 solution and 40 mL of water, while group (f) was only injected with 40 mL of water. Then 10 mg of the 10%-CIS/APO composite was added to groups (a–d and f), respectively. Subsequently, 1 mL of isopropyl alcohol (IPA) was injected into group (b) to quench ˙OH, 0.1 mmol p-benzoquinone (BQ) was added to group (c) as the scavenger of ˙O2−, and 1 mL of methanol (MeOH) was added to group (d) to capture h+. Finally, NO was added in six quartz tubes, which were exposed to visible light under stirring for 30 min. After the reaction, 1 mL of clear supernatant was injected into IC columns to reveal the effect of active species.2.5 Photoelectrochemical characteristics
Photocurrent density was measured by a CHI 760B electrochemical workstation with a three-electrode system in which a Ag/AgCl electrode and a Pt wire respectively served as the reference and the counter electrode, and 0.5 M Na2SO4 aqueous solution was used as the electrolyte. The work electrodes were prepared by the following method. 0.01 g of the photocatalyst was dispersed in 1 mL of ethanol containing 50 μL of naphthol to form a homogeneous suspension by an ultrasonic method. The suspension was drop-coated on the exposed area of the conductive side of the FTO glass. The final FTO glasses were dried overnight in a vacuum oven under a N2 atmosphere.3. Results and discussion
3.1 Structural characterization
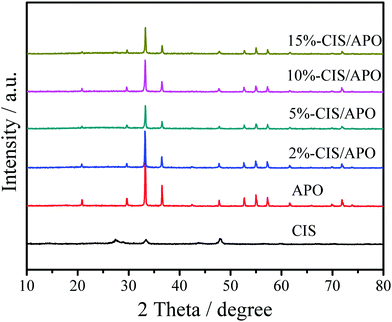
X-ray powder diffraction was used to analyze the crystal structures of all synthetic samples. As observed in Fig. 1 and Fig. S3 (ESI†), CIS exhibits the diffraction peaks at 14.5°, 23.4°, 27.5°, 28.8°, 33.4°, 43.8°, 47.9°, 56.6°, 59.8°, 67.1° and 70.2°, which are respectively indexed as (111), (220), (311), (222), (400), (511), (440), (533), (622), (731) and (800) planes of the cubic structure CaIn2S4.7 In terms of APO, its crystal structure is identified to be of the body-centered cubic structure, which is in accordance with the JCPDS Card No. 06-0505.24,25 The sharp diffraction peaks located at 33.3°, 36.6° and 55.0° matched with the (210), (211) and (320) crystal planes of APO. No peaks for any other impurities were found. The XRD results indicate that the well-crystallized APO was successfully prepared. CIS/APO composites exhibit similar diffraction peaks as those of APO. The absence of diffraction peaks for CIS in the CIS/APO composites might be ascribed to its low mass percentage or small crystal size. Simultaneously, the results of the XRD patterns also indicate that the crystal structure of APO cannot be easily destroyed during the preparation process of the CIS/APO composites.To study the surface chemical composition of the materials and the interaction between CIS and APO, X-ray photoelectron spectroscopy (XPS) was carried out. As shown in Fig. 2a, the survey spectrum of the 10%-CIS/APO composite shows the existence of C, Ag, P, O, Ca, In and S. The C 1s peak in the survey spectrum results from the carbon tape used for fixing the sample.26 As shown in Fig. 2b, the peaks at 367.9 eV and 373.9 eV corresponding to the binding energies of Ag 3d5/2 and Ag 3d3/2 of APO shift towards high values. The broad peak in Fig. 2c of the P 2p spectra affirms that the valence state of P in the 10%-CIS/APO composite is +5, and it also shows a slight shift to high values.20 The results confirm the existence of a strong interaction between APO and CIS. In the O 1s spectra of Fig. 2d, the peaks at 530.4 eV, 531.1 eV, and 532.4 eV for the 10%-CIS/APO composite are respectively ascribed to lattice O, chemisorbed oxygen and physically adsorbed oxygen.27 According to Fig. 2e–f, the peaks at 445 eV and 452.6 eV corresponding to the binding energies of In 3d5/2 and 3d3/2 of CIS slightly shift to low values, and the peaks at 348.5 eV and 352 eV corresponding to Ca 2p3/2 and 2p1/2 of CIS also respectively show a slight shift to low values. The slight shifts of the binding energies of In 3d and Ca 2p also confirm an effective electronic interaction between CIS and APO in the CIS/APO composite.
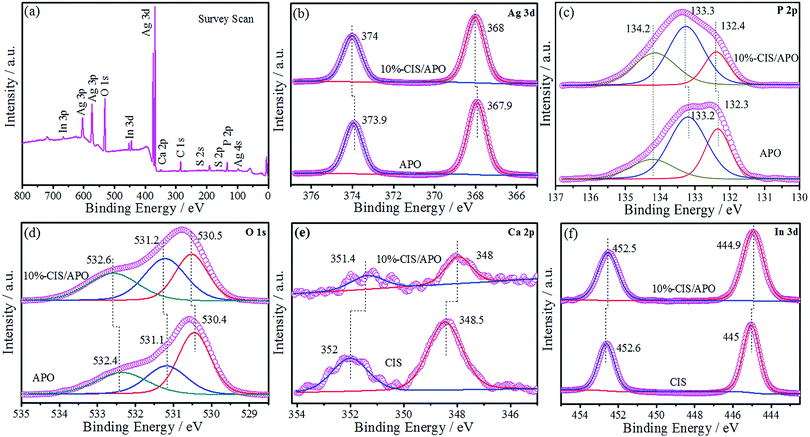 | ||
| Fig. 2 XPS survey spectra of the 10%-CIS/APO composite (a) and the high-resolution XPS spectra of the Ag 3d (b), P 2p (c), O 1s (d), Ca 2p (e), and In 3d (f) regions for CIS, APO and 10%-CIS/APO. | ||
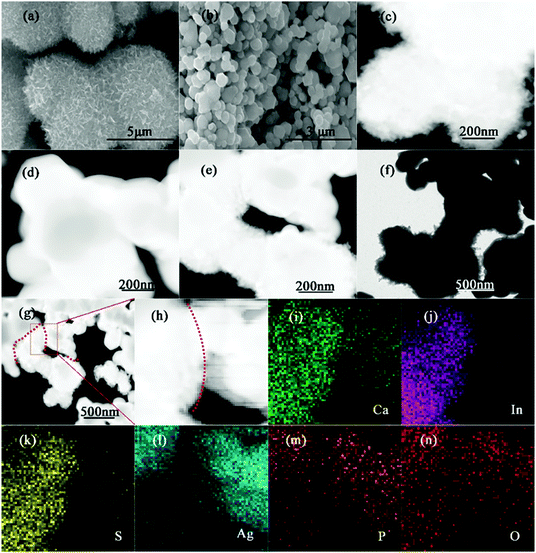
The morphologies and macrostructures of all samples have been studied by using field-emission scanning electron microscopy (SEM) and transmission electron microscopy (TEM). As observed in Fig. 3(a and c) and Fig. S4 (ESI†), CIS is composed of uniform marigold-flower-like microspheres with many nanosheets. The elemental mapping of CIS shows a relatively homogeneous distribution of Ca, In and S. And the corresponding EDS spectrum confirms the existence of Ca, In and S. As shown in Fig. 3(b and d) and Fig. S5 (ESI†), the pristine APO exhibits irregular sphere-like particles. For the 10%-CIS/APO composite in Fig. 3(e and f), we can find that the irregular sphere-like APO particles are interconnected with marigold-flower-like CIS, thus contributing to the electron transfer via the interface between CIS and APO in the process of the photocatalytic reaction. Furthermore, to further display the construction of the Z-scheme photocatalyst, the elemental mapping of the 10%-CIS/APO nanocomposite has also been performed as shown in Fig. 3(g–n). From the result of EDX mapping, it can be seen that APO and CIS are of relatively uniform dispersion and well connected, which is in accordance with that of XPS.
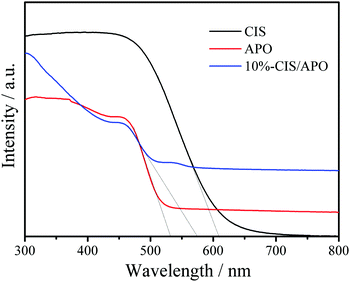
To investigate the electronic properties of the CIS/APO nanocomposites, their photophysical properties were studied. The UV/Vis diffuse reflection spectra (DRS) of CIS, 10%-CIS/APO nanocomposite and APO are shown in Fig. 4. It can be found that the pure CIS exhibits a strong visible light absorption capacity. For the 10%-CIS/APO nanocomposite, the visible light absorption edge shifts towards a long wavelength, indicating that the addition of CIS is beneficial to the absorption of visible light for CIS/APO photocatalysts. The corresponding band gaps (Eg) of CIS, APO and 10%-CIS/APO are respectively calculated to 1.85, 2.45 and 2.38 eV according to the derived plots of the transformed Kubelka–Munk function (Fig. S6, ESI†). To further study the photocatalytic mechanism of the CIS/APO nanocomposite, the valence band edge potentials (EVB) and conduction band edge potentials (ECB) of both CIS and APO are estimated based on the following equations: EVB = χ − Ee + 0.5Eg, where Ee is the energy of free electrons on the hydrogen scale (ca. 4.5 eV).28,29χ is the geometric mean of absolute electronegativity of the constituent atoms, and the electronegativity values of APO and CIS are respectively 6.17 and 4.39 eV.13,30 Hence, the ECB and EVB positions of APO and CIS are +0.45 and +2.90 eV, and −1.03 and +0.82 eV, respectively.
3.2 Photocatalytic activity and product analysis on NO degradation
To estimate their air purification potential, the synthetic CIS/APO nanocomposites were employed to study their PCO of NO performance under visible light. Firstly, contrast experiments were carried out (Fig. S7, ESI†). It can be observed that the NO removal rates are low, indicating that NO cannot be easily oxidized under the corresponding conditions. Thereafter, the visible-light-induced PCO performance of the CIS/APO nanocomposites on NO removal was carried out. The gas streams were introduced into the photocatalytic reactor after being premixed completely. After 1 h, the adsorption–desorption equilibrium between photocatalysts and gases was reached, and the xenon lamp and the peristaltic pump delivering H2O2 solution were turned on. As depicted in Fig. 5a, the PCO efficiency of NO first increases with the light irradiation time and then reaches chemical equilibrium. The CIS/APO nanocomposites exhibit superior photocatalytic activity compared with BVO, which is also much higher than that of the contrast experiment. It is worth mentioning that the 10%-CIS/APO nanocomposite exhibits the highest photocatalytic activity for NO removal (83.61%). The stability of a photocatalyst is also a critical parameter. Hence, the cyclic stability tests for the PCO of NO over the 10%-CIS/APO photocatalyst were carried out. As observed in Fig. 5b, the 10%-CIS/APO nanocomposite can maintain good photocatalytic activity and recyclability in the PCO of NO. The photocatalytic efficiency with a slight decrease could be ascribed to the deactivation of the CIS/APO nanocomposite. It is well known that metal sulfides suffer from severe self-photooxidation by photoinduced holes,31–33 that is, the self-oxidation of CIS occurred over the CIS/APO nanocomposite, resulting in its deactivation during the prolonged photocatalytic reaction. Hence, it is still desirable to further optimize the composition of the CIS/APO nanocomposite and photocatalytic reaction conditions, thus achieving more efficient photocatalysis. The stability of the CIS/APO nanocomposite can be improved by introducing reduced graphene oxide, and this will be studied in detail and reported in the follow-up work.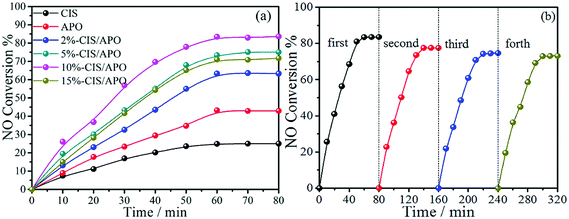 | ||
| Fig. 5 (a) The NO conversion efficiency of CIS, APO and x%-CIS/APO nanocomposites (x = 2, 5, 10, 15); (b) the stability tests of the 10%-CIS/APO nanocomposite for NO removal. | ||
The products in the PCO of NO were detected by ion chromatography (IC) according to our previous reported method.34,35 As depicted in Fig. S8 (ESI†), the qualitative result confirms the existence of NO3− on the surface of the 10%-CIS/APO nanocomposite after the PCO of NO. Of particular interest is that NO2− has not been detected by IC. These results could be ascribed to the introduction of H2O2, which could produce a considerable amount of active species in the presence of the 10%-CIS/APO nanocomposite and enhance the oxidative ability of the photocatalytic system. Therefore, NO3− can be considered as the photocatalytic reaction product. The standard solution was prepared and the corresponding IC technique was performed. The fitting line is shown in Fig. S9 (ESI†). Consequently, the concentration value of NO3− in the solution could be obtained through an external standard method. The FTIR spectra of the 10%-CIS/APO nanocomposite before and after the photocatalytic reaction were also obtained. As depicted in Fig. S10 (ESI†), there is no obvious change before and after the PCO of NO and only a new peak of NO3− at ca. 1384 cm−1 can be observed after the PCO of NO, which also indicates that NO3− is the product in the PCO of NO. Additionally, a nitrogen balance calculation was also carried out to investigate the possible byproducts, and the corresponding calculated method is in the supporting information. The results further confirm that NO3− is the final reaction product in the PCO of NO.
3.3 Mechanism of photocatalytic oxidation of NO
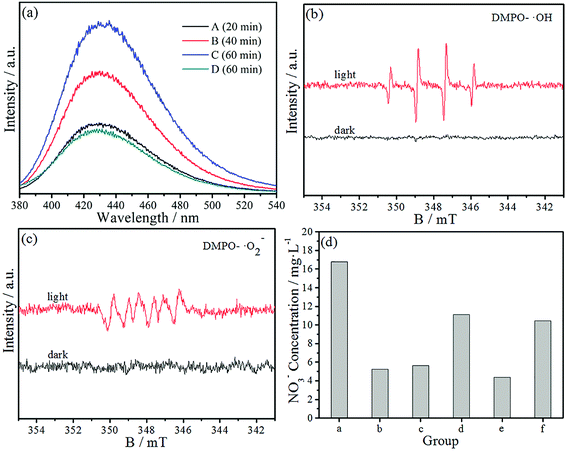
The PCO of NO is of importance in practical applications. Hence, a large amount of work on the photocatalytic removal of NO has been reported in recent years. However, little systematic study about the mechanism of NO removal via the photocatalytic technique can be found in the literature. Generally speaking, the photocatalytic removal of various pollutants is due to to photoexcited electrons and holes as well as active free radicals, such as the superoxide (˙O2−) and hydroxyl radicals (˙OH). We speculate that the PCO mechanism of NO is similar to those of other pollutants, but the active species that have significant functions in the process of the PCO of NO require further study.First of all, we employed a fluorescence technique to detect ˙OH by using terephthalic acid (TA) as the probe molecule.36 Four quartz tubes (labeled as A, B, C, D) were filled with 40 mL of deionized water, 50 μL of fresh H2O2 solution and 0.3 mmol of TA. Then 10 mg of the as-prepared 10%-CIS/APO nanocomposite powder was added in groups (A–C), respectively. Thereafter, all tubes were irradiated by using a 300 W xenon lamp under stirring for 20 min (A), 40 min (B), and 60 min (C and D). Finally, the ˙OH concentration in the supernatant was immediately detected by a fluorescence spectrophotometer with an excitation wavelength of 315 nm. As seen in Fig. 6a, there is an obvious fluorescence emission peak at 426 nm, indicating that 2-hydroxyterephthalic acid was formed from the reaction between ˙OH and TA. It is worth mentioning that the peak intensity of groups (A–C) is higher than that of group (D) and gradually increases with increasing light irradiation time, which confirms that a large amount of ˙OH ions are generated in the process of the PCO of NO.
To further prove the probable active species in the process of the PCO of NO, electron spin resonance (ESR) experiments were also carried out. DMPO–CH3OH and DMPO–H2O were prepared by the following method. 10 mg of the 10%-CIS/APO photocatalyst and 100 μL of DMPO were dissolved in 1 mL of deionized water and stirred for 5 min, denoted as solution A. 10 mg of the 10%-CIS/APO photocatalyst and 100 μL of DMPO were dissolved in 1 mL of methanol and stirred for 5 min, denoted as solution B. Solution A was used for the detection of DMPO-˙OH, and solution B was used for the detection of DMPO-˙O2−.37,38 As depicted in Fig. 6b, no ESR signal was observed when the 10%-CIS/APO suspension was in the dark. When the system was irradiated, four characteristic peaks for DMPO-˙OH indicated that a large amount of ˙OH radicals were produced, which is in accordance with the fluorescence spectra. In Fig. 6c, six characteristic peaks for DMPO-˙O2− could be obviously observed, indicating that a large amount of ˙O2− radicals was also generated in the system. In 2017, a similar result was reported by the Du group.23 The foregoing analytical results indicate that ˙OH and ˙O2− are indispensable in the PCO of NO.
Subsequently, to distinguish the role of various active species introduced in the PCO of NO, the trapping experiment was performed to study the involvement of the active species. The experimental steps are shown in the Experimental section. The NO3− qualitative results are shown in Fig. 6d. It can be found that group (b) is only a little higher than that of the control group (e), indicating that ˙OH plays an important role in the PCO of NO. Group (c) is only a little higher than that of group (b), and still in a low level in comparison with that of group (a). The results imply that ˙O2− is also essential and efficient in the PCO of NO. The result of group (d) implies that h+ also has weak oxidation ability and could directly oxidize NO to a certain extent. From the above-mentioned discussion, we can speculate that ˙OH and ˙O2− play an important role in the PCO of NO. It is worth mentioning that the NO3− concentration of group (f) is lower than that of group (a), which indicates that the injected H2O2 solution can produce more active species to improve the photocatalytic activity via the reaction between the photoinduced carriers and H2O2. The main reactions will occur as the following (1)–(8) in the presence of H2O2 in the PCO procedure.
| CIS + hν → e−(CIS) + h+(CIS) | (1) |
| APO + hν → e−(APO) + h+(APO) | (2) |
| H2O2 + e−(CIS) → ˙OH + OH− E0 = +0.06 eV | (3) |
| NO + ˙OH → HNO2 | (4) |
| HNO2 + ˙OH → NO2 + H2O | (5) |
| NO2 + ˙OH → HNO3 | (6) |
| H2O2 + 2h+(APO) → ˙O2 + 2H+ E0 = +1.00 eV | (7) |
| NO + ˙O2− → NO3− | (8) |
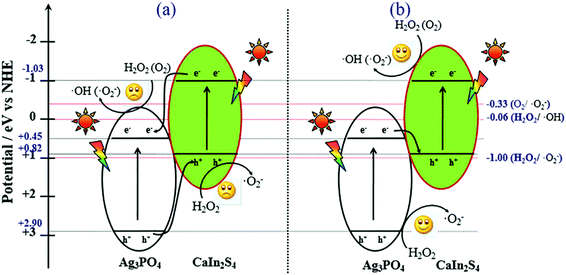
According to the results of the ESR spectra, FL spectra and the trapping experiment, as well as the unique band gap structures of CIS and APO, we proposed the possible mechanism for the superior photocatalytic activity of the CIS/APO nanocomposite (Fig. 7). Upon irradiation with light, electrons can be excited and transferred from the valence band of the semiconductor to the conduction bands. Providing that CIS and APO could form a common heterojunction-type composite photocatalyst, the transfer processes of the photoexcited electrons and holes occur as displayed in Fig. 7a. The photoinduced electrons would transfer from the CB of CIS to the CB of APO, while the holes in the VB of APO simultaneously migrate into the VB of CIS. This could offer the efficient separation of the photogenerated electrons and holes. But the accumulated holes on the VB of CIS could not oxidize water molecules and hydrogen peroxide molecules to produce the ˙O2− radicals. Similarly, the electron on the CB of APO could not reduce oxygen molecules (O2) into ˙O2−. This is ecause the CB potential of APO (+0.45 eV) is more positive than the redox potential of ˙O2− and ˙OH formation (O2/˙O2− = −0.33 eV; H2O2/˙OH = +0.06 eV)36,39,40 and the VB potential of CIS (+0.82 eV) is more negative than the potential required to oxidize H2O2 to ˙O2− (+1.00 eV).41 In contrast, provided that the coupling of CIS and APO could follow the Z-scheme mechanism (Fig. 7b), and this is evidently consistent with the results of the fluorescence spectra, ESR and the trapping experiment, the photoexcited electrons in the CB of APO are transferred to the VB of CIS, where they recombine with the holes in the VB of CIS. The electrons in the CB of CIS and the holes in the VB of APO are well separated, and they effectively participate in the reaction with the H2O2 molecule to produce a large amount of active free radicals and enhance the photocatalytic activity of the CIS/APO nanocomposite. As the higher positive VB potential of APO (+2.90 eV) can easily oxidize H2O2 to ˙O2−, similarly, the higher negative CB potential of CIS (−1.03 eV) can reduce O2 and H2O2 to ˙O2− and ˙OH, respectively. A large amount of active free radicals (˙O2−, ˙OH) would form a strong oxidation ability in the CIS/APO nanocomposite photocatalysts, thus making the PCO of NO more efficient in comparison with the pure CIS or APO photocatalyst.
To further understand the proposed mechanism and the separation and transfer of photoexcited carriers, photoluminescence (PL) spectra are employed.41 A low PL intensity usually reflects low recombination of photoinduced charge carriers, thus increasing the reaction chance of photoexcited charge carriers.42,43 As diaplayed in Fig. 8a, it can be seen that the 10%-CIS/APO nanocomposite displays a lower PL intensity in comparison with pure CIS, but possesses a higher PL intensity than APO. The result is in contradiction with that of general PL experiments, implying that the photoexcited electrons and holes in the CIS/APO nanocomposite are not transferred as shown in Fig. 7a but as in Fig. 7b.44 The higher PL intensity of the 10%-CIS/APO nanocomposite originates from the higher recombination rate between the photoinduced electrons in the CB of APO and the holes in the VB of CIS, thus leaving rich electrons in the CB of CIS and holes in the VB of APO to participate in the photocatalytic reaction. Hence, the recombination and transfer of the photoexcited electrons and holes for the CIS/APO nanocomposite are indeed in accordance with the Z-scheme photocatalytic oxidation process. Furthermore, the much enhanced photocurrent density in Fig. 8b also intuitively reflects the faster separation of photoinduced carriers to improve the photocatalytic oxidation ability of the as-fabricated Z-scheme CIS/APO photocatalyst.
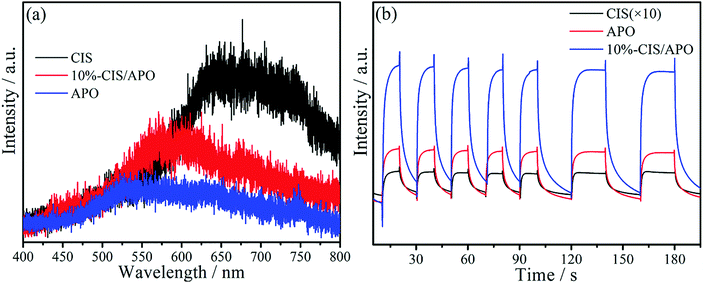 | ||
| Fig. 8 Photoluminescence spectra (a) and photocurrent density curves (b) of CIS, APO and 10%-CIS/APO. | ||
4. Conclusion
In summary, we fabricated a novel Z-scheme CaIn2S4/Ag3PO4 composite photocatalyst, which exhibited superior photocatalytic activity for NO (∼400 ppm) removal with the assistance of H2O2. The PCO efficiency of NO can run up to 83.56% over a 10%-CIS/APO photocatalyst. The excellent photocatalytic performance benefits from the low recombination rate of photogenerated electrons and holes, and the production and participation of the active radical species. The existence of H2O2 is also a critical factor in the improvement of the photocatalytic efficiency via the production of more active species (˙OH, ˙O2−). In addition, NO3− is validated to be the main product in the PCO of NO. The mechanistic study indicates that ˙OH and ˙O2− play an important role in the process of PCO of NO.Conflicts of interest
There are no conflicts to declare.Acknowledgements
This work was financially supported by the Key Project of Chinese National Programs for Research and Development (2016YFC0203800), the Assembly Foundation of the Industry and Information Ministry of the People's Republic of China 2012 (543), the National Natural Science Foundation of China (51408309 and 51578288), the Science and Technology Support Program of Jiangsu Province (BE2014713), the Natural Science Foundation of Jiangsu Province (BK20140777), the Industry-Academia Cooperation Innovation Fund Projects of Jiangsu Province (BY2014004-10), the Science and Technology Project of Nanjing (201306012), the Jiangsu Province Scientific and Technological Achievements into a Special Fund Project (BA2015062), the Top-notch Academic Programs Project of Jiangsu Higher Education Institutions, and a Project by the Priority Academic Program Development of Jiangsu Higher Education Institutions.References
- A. Fujishima and K. Honda, Nature, 1972, 238, 37 CrossRef CAS PubMed.
- M. R. Hoffmann, S. T. Martin, W. Y. Choi and D. W. Bahnemann, Chem. Rev., 1995, 95, 69 CrossRef CAS.
- B. S. Rodrigues, K. T. Ranjit, S. Uma, I. N. Martyanov and K. J. Klabunde, Adv. Mater., 2005, 17, 2467 CrossRef.
- G. N. Wang, X. F. Wang, J. F. Liu and X. M. Sun, Chem. – Eur. J., 2012, 18, 5361 CrossRef CAS PubMed.
- R. M. Li, G. J. Dong and G. M. Chen, New J. Chem., 2015, 39, 6854 RSC.
- J. G. Yu, Q. Li, S. W. Liu and M. Jaroniec, Chem. – Eur. J., 2013, 19, 2433 CrossRef CAS PubMed.
- J. J. Ding, S. Sun, W. H. Yan, J. Bao and C. Gao, Int. J. Hydrogen Energy, 2013, 38, 13153 CrossRef CAS.
- B. B. Kale, J. O. Baeg, S. M. Lee, H. J. Chang, S. J. Moon and C. W. Lee, Adv. Funct. Mater., 2006, 16, 1349 CrossRef CAS.
- J. Zhao, T. Minegishi, L. Zhang, M. Zhong, M. Nakabayashi, G. J. Ma, T. Hisatomi, M. Katayama, S. Ikeda, N. Shibata, T. Yamada and K. Domen, Angew. Chem., 2014, 126, 12002 CrossRef.
- S. P. Wan, Q. Zhong, M. Ou, S. L. Zhang and F. J. Song, Chem. Eng. J., 2017, 325, 690 CrossRef CAS.
- K. Iwashina, A. Iwase, Y. H. Ng, R. Amal and A. Kudo, J. Am. Chem. Soc., 2015, 137, 604 CrossRef CAS PubMed.
- J. J. Ding, B. Hong, Z. L. Luo, S. Sun, J. Bao and C. Gao, J. Phys. Chem. C, 2014, 118, 27690 CAS.
- W. K. Jo and T. S. Natarajan, ACS Appl. Mater. Interfaces, 2015, 7, 17138 CAS.
- J. Li, S. C. Meng, T. Y. Wang, Q. Xu, L. Q. Shao, D. L. Jiang and M. Chen, Appl. Surf. Sci., 2017, 396, 430 CrossRef CAS.
- H. Wang, Y. S. Bai, J. T. Yang, X. F. Lang, J. H. Li and L. Guo, Chem. – Eur. J., 2012, 18, 5524 CrossRef CAS PubMed.
- Y. P. Bi, S. X. Ouyang, N. Umezawa, J. Y. Cao and J. H. Ye, J. Am. Chem. Soc., 2011, 133, 6490 CrossRef CAS PubMed.
- X. J. Guan and L. J. Guo, ACS Catal., 2014, 4, 3020 CrossRef CAS.
- L. Liu, Y. H. Qi, J. R. Lu, S. L. Lin, W. J. An, Y. H. Liang and W. Q. Cui, Appl. Catal., B, 2016, 183, 133 CrossRef CAS.
- Z. H. Ai, W. K. Ho and S. C. Lee, J. Phys. Chem. C, 2011, 115, 25330 CAS.
- P. F. Tan, X. Chen, L. D. Wu, Y. Y. Shang, W. W. Liu, J. Pan and X. Xiong, Appl. Catal., B, 2017, 202, 326 CrossRef CAS.
- L. P. Wang, L. M. Wang, D. Q. Chu, Z. F. Wang, Y. F. Zhang and J. J. Sun, Catal. Commun., 2017, 88, 53 CrossRef CAS.
- X. X. Chen, X. T. Huang and Z. G. Yi, Chem. – Eur. J., 2014, 20, 17590 CrossRef CAS PubMed.
- M. Sun, Q. Zeng, X. Zhao, Y. Shao, P. G. Ji, C. Q. Wang, T. Yan and B. Du, J. Hazard. Mater., 2017, 339, 9 CrossRef CAS PubMed.
- H. C. Zhang, H. Huang, H. Ming, H. T. Li, L. L. Zhang, Y. Liu and Z. H. Kang, J. Mater. Chem., 2012, 22, 10501 RSC.
- H. Wang, L. He, L. H. Wang, P. F. Hu, L. Guo, X. D. Han and J. H. Li, CrystEngComm, 2012, 14, 8342 RSC.
- M. Y. Zhang, C. L. Shao and J. B. Mu, J. Mater. Chem., 2012, 22, 577 RSC.
- K. Yu, S. G. Yang, S. A. Boyd, H. Z. Chen and C. Sun, J. Hazard. Mater., 2011, 197, 88 CrossRef CAS PubMed.
- H. Y. Nie, M. Ou, Q. Zhong, S. L. Zhang and L. M. Yu, J. Hazard. Mater., 2015, 300, 598 CrossRef CAS PubMed.
- F. Dong, T. Xiong, Y. J. Sun, Y. X. Zhang and Y. Zhou, Chem. Commun., 2015, 51, 8249 RSC.
- J. F. Zhang and T. Zhang, J. Nanomater., 2013, 22, 4053 Search PubMed.
- T. Xiong, M. Q. Wen, F. Dong, J. Y. Yu, L. L. Han, B. Lei, Y. X. Zhang, X. S. Tang and Z. G. Zang, Appl. Catal., B, 2016, 199, 95 CrossRef.
- K. Iwashina, A. Iwase, Y. H. Ng, R. Amal and A. Kudo, J. Am. Chem. Soc., 2015, 137, 604 CrossRef CAS PubMed.
- S. P. Wan, M. Ou, Q. Zhong, S. L. Zhang and F. J. Song, Chem. Eng. J., 2017, 325, 690 CrossRef CAS.
- S. P. Wan, Q. Zhong, M. Ou, S. L. Zhang and W. Cai, J. Photochem. Photobiol., A, 2017, 340, 136 CrossRef CAS.
- M. Ou, Q. Zhong, S. L. Zhang, H. Y. Nie, Z. J. Lv and W. Cai, Appl. Catal., B, 2016, 193, 160 CrossRef CAS.
- T. Hirakawa and Y. Nosaka, Langmuir, 2002, 18, 3247 CrossRef CAS.
- W. J. Li, D. Z. Li, Y. M. Lin, P. X. Wang, W. Chen, X. Z. Fu and Y. Shao, J. Phys. Chem. C, 2012, 116, 3552 CAS.
- Y. M. Lin, D. Z. Li, J. H. Hu, G. G. Xiao, J. X. Wang, W. J. Li and X. Z. Fu, J. Phys. Chem. C, 2012, 116, 5764 CAS.
- F. Dong, Q. Y. Li, Y. J. Sun and W. K. Ho, ACS Catal., 2014, 4, 4341 CrossRef CAS.
- X. Feng, W. D. Zhang, H. Deng, Z. L. Ni, F. Dong and Y. X. Zhang, J. Hazard. Mater., 2017, 322, 223 CrossRef CAS PubMed.
- S. Martha, A. Nashim and K. M. Parida, J. Mater. Chem. A, 2013, 1, 7816 CAS.
- S. Kumar, A. Baruah, S. Tonda, B. Kumar, V. Shanker and B. Sreedhar, Nanoscale, 2014, 6, 4830 RSC.
- W. Cui, J. Y. Li, F. Dong, Y. J. Sun, G. M. Jiang, W. L. Cen, S. C. Lee and Z. B. Wu, Environ. Sci. Technol., 2017, 51, 10682–10690 CrossRef CAS PubMed.
- S. F. Chen, L. Ji, W. M. Tang and X. L. Fu, Dalton Trans., 2013, 42, 10759 RSC.
Footnote |
| † Electronic supplementary information (ESI) available. See DOI: 10.1039/c7nj03588h |
| This journal is © The Royal Society of Chemistry and the Centre National de la Recherche Scientifique 2018 |

