Nitrogen-doped carbon nanotube supported double-shelled hollow composites for asymmetric supercapacitors†
Yayun
Zheng
a,
Jie
Xu
 *a,
Yan
Zhang
b,
Xiaoshan
Yang
a,
Yingjiu
Zhang
*a and
Yuanyuan
Shang
a
aSchool of Physical Engineering and Key Laboratory of Material Physics, Ministry of Education, Zhengzhou University, NO. 75, Daxue Road, Zhengzhou 450052, China. E-mail: xujie@zzu.edu.cn; zhangyj2006@zzu.edu.cn; Fax: +86 371 67766629; Tel: +86 371 67766870
bCollage of Physics and Telecommunication Engineering, Zhoukou Normal University, Zhoukou 466001, China
First published on 20th November 2017
Abstract
In this work, a unique N–C@NiMoO4 composite with a double-shelled hollow microtube structure has been developed through a simple and low-cost growth process. The composite contains a NiMoO4 outer shell with high electrochemical activity and hollow nitrogen-doped carbon nanotubes (N–C NTs) with high conductivity, resulting in a high performance electrode material. The existence of N–C NTs effectively prevents the accumulation and agglomeration of the NiMoO4 nanosheets during the formation of a uniform outer shell, providing a higher specific surface area (258.2 m2 g−1). The electrochemical study displays that the C@NiMoO4 composite has a specific capacitance as high as 1242 F g−1 at a current density of 1 A g−1, and about 82.9% cycling stability after 2000 cycles. Moreover, the as-fabricated C@NiMoO4//N–C asymmetric supercapacitor (ASC) can achieve a maximum high energy density of 44.6 W h kg−1 at a power density of 250.4 W kg−1. These results imply that the C@NiMoO4 composite with a double-shelled hollow tube-structure is a promising candidate for high performance supercapacitors.
1. Introduction
As a promising candidate for energy storage, supercapacitor devices have been acclaimed for their low-cost, high power density, long cycling lifespan, fast charge/discharge rates and wide operating temperature range.1–5 According to the principle of electrical storage, supercapacitors are generally divided into electrical double-layer capacitors (EDLCs) and pseudocapacitors.6–8 Notably, pseudocapacitors could offer substantially higher specific capacitance and energy density than typical EDLCs because of the fast and reversible Faradaic redox reactions at the surface of the electrode materials.4,6 In this context, transition metal oxides, (RuO2,9 MnO2,10 MoO3,11 Co3O4,12 NiO,13 NiCoO2,14 NiCo2O4,15 NiMoO4,16etc.), conducting polymers (polypyrrole,17 polyaniline18etc.), and their compounds have been used successfully as the electrode materials of supercapacitors. In particular, nickel molybdate with different structures as the electrode material for pseudocapacitors has aroused extensive attention due to its low-cost, rich resource reserves, environmentally friendly nature, high theoretical reversible capacity, rich polymorphism and high electrochemical performance.19,20However, metal oxides as the electrode materials of supercapacitors invariably suffer from disadvantages including low ionic conductivity, and poor electrochemical stability, which limit their application in supercapacitors.14,21 One way to overcome these limitations is to prepare various nano/micro-structure NiMoO4 materials with high surface area.4,14 For example, Yin et al.22 synthesized hierarchical nanosheet-based NiMoO4 nanotubes and demonstrated a specific capacitance of 864 F g−1 at a current density of 1 A g−1. Cai et al.23 synthesized hierarchical NiMoO4 nanospheres made from mesoporous nanosheets and drew the conclusion that the NiMoO4 nanospheres possess a superior electrochemical performance compared to NiMoO4 nanorods. This excellent electrochemical performance of such nanotube and nanosphere shaped electrode materials with nanosheets as the understructure may result from the high specific surface area, high electrical conductivity and stable structure.24,25 Another method is to synthesize nano/micro-hybrids with carbon as a support material in order to improve the electrical conductivity and structural stability of the materials.4,26 Liu et al.27 synthesized a NiMoO4–rGO composite via a microwave-solvothermal method and the composite exhibited superior electrochemical performance compared to pure NiMoO4. As reported, taking carbon materials as conductive scaffolds can ideally achieve excellent electrical conductivity and superior cycling stability for composite electrodes. Moreover, carbon-based materials also have fast ion and electron transfer and enhanced capacitive performance due to their high porosity and enhanced wettability.6,27,28 Therefore, the N–C NT based NiMoO4 composite in this study is expected to provide improved electrochemical behaviour.
Herein, special nitrogen-doped carbon nanotubes which are made from polypyrrole (Ppy) nanotubes after a one-step carbonation process have been considered an ideal support material because of their high conductivity, highly porous nature and superior mechanical properties.29,30 Benefiting from the highly porous nature of Ppy nanotubes and great graphitic texture with copious heteroatom functionalities, N–C nanotubes are more conducive to the introduction of metal oxides and then provide more stable metal oxide nanocrystals. It has been reported that the addition of graphite nitrogen into the carbon network enhances the conductivity of the carbon material and wettability of electrolyte electrode interfaces, and then provides more internal accessible surfaces for ions compared to CNTs.29,31 Hence, the high conductivity of N–C materials tends to accelerate the transmission of electrons and ions, which will further facilitate the rapid charging–discharging of active materials. Moreover, the complex substance with desirable micro-/nanostructures of NiMoO4 and N–C nanotubes can integrate the advantages between each component and mitigate their inherent shortcomings, providing a high-rate electrochemical behaviour.
Based on these considerations, we successfully synthesized N–C@NiMoO4 microtubes with a double-shelled hollow structure through a simple hydrothermal process. The existence of N–C NTs in the hybrid material effectively prevented the accumulation and agglomeration of NiMoO4 nanosheets, providing a specific surface area of up to 258.2 m2 g−1, high electrochemical activity and good pore structure. The results of electrochemical measurements indicated that the N–C@NiMoO4 microtubes as an electrode material have a specific capacitance of 1242 F g−1 at a current density of 1 A g−1, and the cycling stability still remained as high as 82.9% even at a current density of 20 A g−1 after 2000 cycles. Compared with pure NiMoO4 microspheres, the N–C@NiMoO4 composite possessed a superior current capacitive behaviour and a better rate capability when the current density is increased. Moreover, an asymmetric supercapacitor device based on N–C@NiMoO4 microtubes as the positive electrode and N–C NTs as the negative one was fabricated. As expected, the as-assembled device delivered a maximum energy density of 44.6 W h kg−1 at a power density of 250.4 W kg−1 and excellent cycling stability of 104.1% retention after 2000 cycles.
2. Experimental
2.1 Reagents and materials
Ni(NO3)2·6H2O, (NH4)6Mo7O24·4H2O urea, isopropanol, hexadecyl trimethyl ammonium bromide (CTAB), tetraethoxysilane (TEOS), NH3·H2O, HCl, acetylene black, methyl orange (MO), FeCl3·6H2O, and pyrrole (py) were supplied by Sinopharm Chemical Reagent Co., Ltd. All the reactants in the experiments were of analytical grade and used without any further purification.2.2 Synthesis of N–C@NiMoO4 composites
The polypyrrole nanotubes (Ppy NTs) in the experiment were obtained from natural pyrrole (py) through a modified oxidation–reduction reaction based on a method reported previously.17 N–C nanotubes were prepared from Ppy nanotubes as precursors though a calcination process at 600 °C for 3 h (3 °C min−1) under the protection of Ar.30To achieve enhanced surface activity during the growth of the N–C@NiMoO4 composite, a layer of SiO2 was coated on the surface of the N–C nanotubes in the following process.32 Briefly, 0.1 g of N–C nanotubes was evenly dispersed into a mixture containing 10 mL water and 40 mL isopropyl alcohol by ultrasound. This was followed by addition of 1 mL NH3·H2O and 0.3 g CTAB with stirring for 30 minutes, and then 0.16 mL TEOS was slowly dropped into the above solution. After stirring for a further 3 hours, the as-obtained N–C@SiO2 was rinsed thoroughly with deionized water and ethanol.
The N–C@NiMoO4 microtubes were prepared through an in situ growth process of NiMoO4 nanosheets onto the N–C@SiO2 tube surfaces, and then residual SiO2 in the composites was eliminated through etching in 2 mol L−1 NaOH at 80 °C.33 The brief experimental operation is as follows: firstly, 0.01 g N–C@SiO2 powder was dispersed in 10 mL deionized water by ultrasonication and vigorous stirring, meanwhile, 4 mL Ni(NO3)2·6H2O (0.1 mol L−1), 0.07 g (NH4)6Mo7O24·4H2O and 0.12 g urea were homogeneously dispersed in 60 mL deionized water. Then after mixing the above two kinds of solution under vigorous stirring for 30 min, the mixture was subsequently placed in a Teflon-lined stainless steel autoclave and kept at 160 °C for 12 h. Thereafter, the resulting black products were separated by centrifugation, and collected after washing with deionized water and ethanol several times, then dried at 60 °C for 12 h under vacuum. Finally, the etching process of the composites was performed in 2 mol L−1 NaOH, and the as-obtained product is defined as N–C@NiMoO4 double-shelled hollow microtubes. For the purpose of comparison, NiMoO4 microspheres without any addition of N–C tubes were synthesized using a similar process.
2.3 Material characterization
The composition and structure of the composite materials were characterized by X-ray diffraction (XRD, PANalytical, Philip X’pert, Cu Kα, λ = 0.154056 nm). As an auxiliary test of XRD, X-ray photoelectron spectroscopy (XPS, Thermo Scientific ESCALAB 250XI) was used to analyse the surface composition of the samples. The morphologies of the as-synthesized materials were observed by scanning electron microscopy (SEM, JEOL-JSM-6700F, and Japan Electronics) and transmission electron microscopy (TEM, JSM-2100F, Japan). N2 adsorption/desorption tests (NOVA 4200e Surface Area and Pore Size Analyzer) via the Brunauer–Emmett–Teller (BET) method were used to obtain information on the specific surface areas, pore size and pore volume of the porous materials.2.4 Electrochemical measurements
The electrochemical measurements that consist of cyclic voltammetry (CV), galvanostatic charge–discharge (GCD), and electrochemical impedance spectroscopy (EIS) were carried out on an electrochemical workstation (CorrTest, Wuhan, China) through a three-electrode system in 2 mol L−1 KOH aqueous solution. The preparation process of the working electrode was mainly similar to that in our previous work.25 Typically, electroactive materials (N–C@NiMoO4, NiMoO4 and N–C NTs), acetylene black and polytetrafluoroethylene binder with a weight ratio of 80![[thin space (1/6-em)]](https://www.rsc.org/images/entities/char_2009.gif) :
:![[thin space (1/6-em)]](https://www.rsc.org/images/entities/char_2009.gif) 15
15![[thin space (1/6-em)]](https://www.rsc.org/images/entities/char_2009.gif) :
:![[thin space (1/6-em)]](https://www.rsc.org/images/entities/char_2009.gif) 5 were dispersed in ethanol to produce a homogeneous slurry; then the slurry was coated onto fresh foam nickel (1 cm ×1 cm) which had been cleaned with HCl (3 mol L−1) and DI water/ethanol. Finally the as-prepared working electrodes were dried at 60 °C for 12 h in a vacuum oven.
5 were dispersed in ethanol to produce a homogeneous slurry; then the slurry was coated onto fresh foam nickel (1 cm ×1 cm) which had been cleaned with HCl (3 mol L−1) and DI water/ethanol. Finally the as-prepared working electrodes were dried at 60 °C for 12 h in a vacuum oven.
The asymmetric device was equipped using N–C@NiMoO4 double-shelled hollow microtubes as the positive electrode, N–C NTs as the negative one, and filter paper as the separator. To approach the maximum capacitance and operating potential window, the optimal mass ratio between the positive and negative electrodes was calculated according to charge balance theory (Q+ = Q− = CsmΔV).34
3. Results and discussion
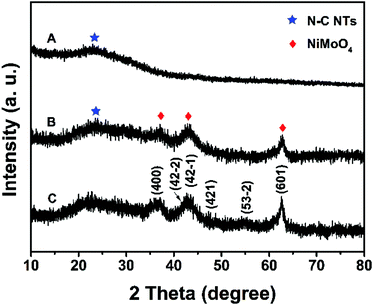
In this work, N–C@NiMoO4 double-shelled hollow composites taking N–C NTs as the inner shell and NiMoO4 nanosheets as the outer shell were successfully synthesized as per the following steps (Scheme 1): firstly, conducting polymer Ppy nanotubes were translated into N–C NTs through a calcination procedure under the protection of Ar. Secondly, a layer of SiO2 was coated on the surface of the N–C nanotubes through a surface treatment process. Lastly, NiMoO4 nanosheets were in situ grown on the N–C NT surfaces through a hydrothermal process. With the assistance of calcination and etching treatment, a N–C@NiMoO4 composite was obtained by removing possible residual SiO2.The typical powder XRD patterns of the N–C NTs, NiMoO4 microspheres and C@NiMoO4 double-shelled hollow microtubes are shown in Fig. 1. From Fig. 1A, a broad diffraction peak at around 24° can be observed in the XRD pattern, which corresponds to the graphitic texture, exhibiting the amorphous nature of the N–C NTs.35 Except for a relatively flat peak at 22° that may be caused by the glass slice during the testing process, the XRD patterns of the NiMoO4 microspheres (Fig. 1C) are in good accordance with the monoclinic structure of NiMoO4 (JCPDS Card No. 45-0142).36,37 In comparison, the XRD pattern of the C@NiMoO4 microtubes (Fig. 1B) is similar to that of NiMoO4 microspheres, which indicates that NiMoO4 nanosheets were successfully grown on the surface of the N–C NTs, and the crystal structure did not change much during the formation of the hollow composite.
The X-ray photoelectron spectroscopy (XPS) spectrum of the N–C@NiMoO4 double-shelled hollow composite was obtained in order to further analyse the composition of the as-prepared products. As expected, it can be seen that there are altogether five elements contained in the composite, namely C, N, O, Mo and Ni (Fig. 2). What's more, there is no Si signal in the XPS spectrum, indicating that SiO2 was completely removed during the etching process. In addition, the complete elimination of SiO2 can be further confirmed by the EDS analysis (Fig. S1G, ESI†). The XPS spectrum of C 1s (Fig. 2A) can be primarily fitted as three peaks centered at binding energies of 284.3, 285.6 and 287.7 eV, respectively. The main peak at the binding energy of 284.3 eV corresponds to the energy of sp2 C![[double bond, length as m-dash]](https://www.rsc.org/images/entities/char_e001.gif) C bonds, which confirms the presence of graphitic carbon. Besides, there are also two small signals at higher binding energies, corresponding to C–O (285.6 eV) and C–N (287.7 eV) species, respectively.29 In the N 1s XPS spectrum (Fig. 2B), two distinct peaks at 399.8 and 397.8 eV are clearly observed, which correspond to graphitic nitrogen species and hexagonal pyridinic nitrogen species, respectively. As expected, the existence of graphitic-N and pyridinic-N reveals the formation of N–C NTs.29,30 In the O 1s XPS spectrum (Fig. 2C), the presence of two oxygen peaks suggests that there are two types of oxygen containing species in the N–C@NiMoO4 double-shelled hollow microtubes. In detail, the large peak at 530.9 eV which corresponds to M–O–M, is typical of the lattice oxygen in N–C@NiMoO4. The other peak at 532.7 eV can be considered to be the binding energy of C
C bonds, which confirms the presence of graphitic carbon. Besides, there are also two small signals at higher binding energies, corresponding to C–O (285.6 eV) and C–N (287.7 eV) species, respectively.29 In the N 1s XPS spectrum (Fig. 2B), two distinct peaks at 399.8 and 397.8 eV are clearly observed, which correspond to graphitic nitrogen species and hexagonal pyridinic nitrogen species, respectively. As expected, the existence of graphitic-N and pyridinic-N reveals the formation of N–C NTs.29,30 In the O 1s XPS spectrum (Fig. 2C), the presence of two oxygen peaks suggests that there are two types of oxygen containing species in the N–C@NiMoO4 double-shelled hollow microtubes. In detail, the large peak at 530.9 eV which corresponds to M–O–M, is typical of the lattice oxygen in N–C@NiMoO4. The other peak at 532.7 eV can be considered to be the binding energy of C![[double bond, length as m-dash]](https://www.rsc.org/images/entities/char_e001.gif) O, which may be attributed to the oxygen groups remaining in the N–C tubes and the water molecule attached on the surface of the N–C@NiMoO4 microtubes.27 In the Mo 3d core level XPS spectrum (Fig. 2D), two remarkable peaks at the binding energies of 232.2 and 235.4 eV correspond to Mo 3d5/2 and Mo 3d3/2, respectively. It is worth mentioning that the energy separation is around 3.2 eV between Mo 3d5/2 and Mo 3d3/2, which is characteristic of the Mo6+ oxidation state in the molybdate ion.38,39 In the Ni 2p XPS spectrum (Fig. 2E), two major peaks at 855.9 and 873.7 eV can be assigned to Ni 2p3/2 and Ni 2p1/2, and the energy separation between the two peaks is approximately 17.8 eV, which is consistent with the Ni2+ oxidation state.39,40 From the results of XPS, it can be seen that there are Ni2+ and Mo6+ in the NiMoO4 samples, confirming the successful synthesis of NiMoO4 nanosheets on the N–C NTs surface.41
O, which may be attributed to the oxygen groups remaining in the N–C tubes and the water molecule attached on the surface of the N–C@NiMoO4 microtubes.27 In the Mo 3d core level XPS spectrum (Fig. 2D), two remarkable peaks at the binding energies of 232.2 and 235.4 eV correspond to Mo 3d5/2 and Mo 3d3/2, respectively. It is worth mentioning that the energy separation is around 3.2 eV between Mo 3d5/2 and Mo 3d3/2, which is characteristic of the Mo6+ oxidation state in the molybdate ion.38,39 In the Ni 2p XPS spectrum (Fig. 2E), two major peaks at 855.9 and 873.7 eV can be assigned to Ni 2p3/2 and Ni 2p1/2, and the energy separation between the two peaks is approximately 17.8 eV, which is consistent with the Ni2+ oxidation state.39,40 From the results of XPS, it can be seen that there are Ni2+ and Mo6+ in the NiMoO4 samples, confirming the successful synthesis of NiMoO4 nanosheets on the N–C NTs surface.41
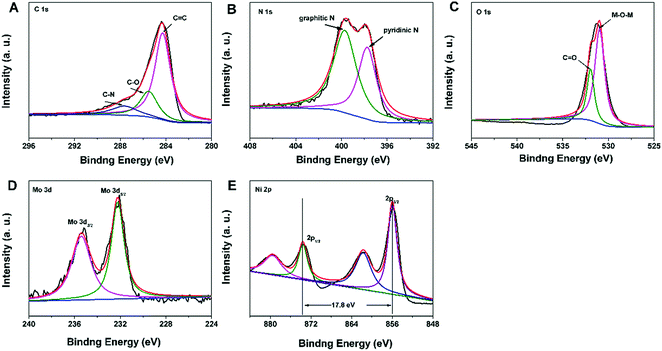 | ||
| Fig. 2 XPS spectra in the C 1s (A), N 1s (B), O 1s (C), Mo 3d (D), and Ni 2p (E) regions for the N–C@NiMoO4 double-shelled hollow microtubes. | ||
The morphology and structure analyses of the as-obtained samples are shown in Fig. 3 and 4. The SEM and TEM images of Fig. 3A–C show a well dispersed state of Ppy nanotubes with a length in the microscale. As shown in Fig. 3B and C, the TEM images of the Ppy tubes illustrate that the Ppy tubes have an obvious hollow structure with a wall thickness of approximately 15 ± 3 nm and a diameter in the nanoscale. After the carbonization process (Fig. 3D), the as-prepared N-doped C NTs still possess a nanotube structure with a shortened length compared with the Ppy NTs, which may be caused by the rupture of the N–C NTs under high temperature. From closer inspection of the TEM images (Fig. 3E and F), decreased thickness of the N–C NTs can also be observed due to shrinkage during the high temperature treatment. The SEM image of N–C@SiO2 is shown in Fig. 3G, and nanometric N–C@SiO2 still possess a certain dispersion with a decreased length due to ultrasonic treatment. In Fig. 3H and I, the successful deposition of the SiO2 layer on the surface of the N–C NTs can be clearly observed due to the obvious increase in wall thickness. It is worth mentioning that SiO2 has the advantages of non-toxicity, excellent compatibility, good hydrophilicity, stability and it being easy to realize surface functionalization and so on. Deposition of a SiO2 layer can improve the reaction inertia and surface wettability of N–C tubes prepared through a calcination treatment, which possibly provides favourable conditions for the in situ growth of NiMoO4 on the surface of the N–C NTs. From longitudinal comparison between the SEM and TEM images of the three samples, it can be concluded that the samples still maintain a good tubular structure and uniform wall thickness after the calcination and deposition processes.
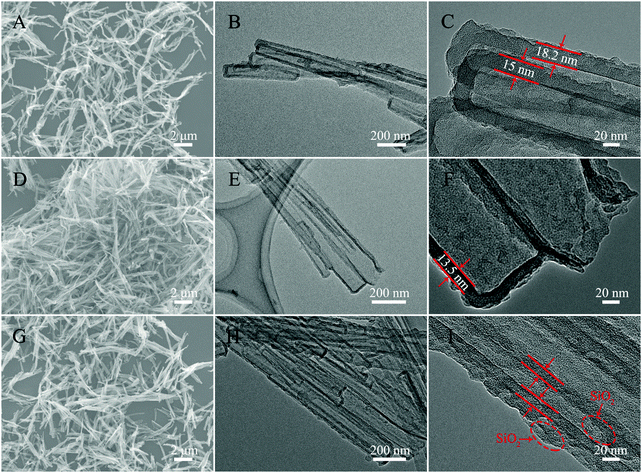 | ||
| Fig. 3 SEM (A) and TEM (B and C) images of Ppy NTs, SEM (D) and TEM (E and F) images of N–C NTs, and SEM (G) and TEM (H and I) images of N–C@SiO2 NTs. | ||
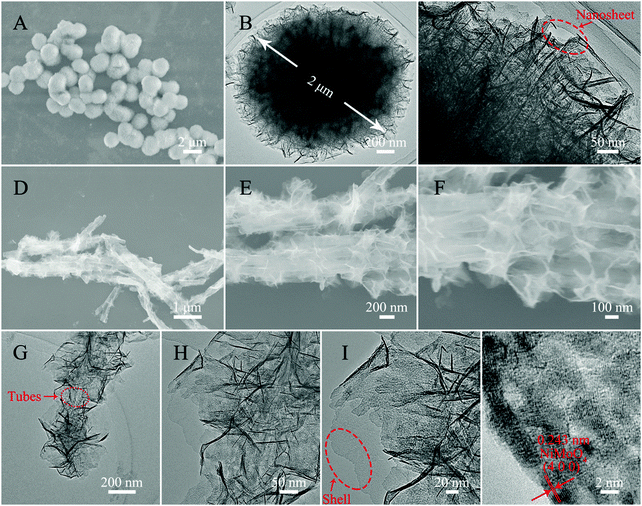
For the purpose of contrast, fluffy NiMoO4 microspheres were synthesized under the same conditions as the N–C@NiMoO4 double-shelled hollow microtubes with the absence of N–C NTs. As shown in Fig. 4A, it can be clearly seen that these NiMoO4 samples have a uniform diameter distribution with diameter of about 2 μm (Fig. 4B). On closer inspection of the TEM image in Fig. 4C, it can be concluded that the fluffy NiMoO4 microspheres are composed of numerous closely packed NiMoO4 nanosheets. From the SEM images of the N–C@NiMoO4 composite under different magnifications (Fig. 4D–F), it can be roughly observed that the N–C@NiMoO4 composite formed a hollow microtube-structure with numerous NiMoO4 outer shells grown on the inner N–C NT shell. In Fig. 4F, a large number of spaces can be seen among these sheets, which is beneficial for ion transfer and infiltration of electrolyte. A closer observation of the TEM images in Fig. 4G–I reveals that the double-shelled hollow tube-structure was successfully synthesized containing NiMoO4 nanosheets as the outer shell with high electrochemical activity and N–C NTs as the inner shell with high conductivity. The presence of N–C NTs efficiently avoids the stacking and aggregation of the NiMoO4 nanosheets, which eventually leads to a unique hollow tube-structure with high specific surface area and makes the NiMoO4 nanosheets exposed to the electrolyte with increased active sites. At the same time, due to the presence of N–C tubes, the N–C@NiMoO4 composite provides a higher conductivity and a better ion channel for electron transfer during the electrochemical process. Based on the HRTEM image of the N–C@NiMoO4 double-shelled hollow microtubes (Fig. 4J), an interplanar spacing of around 0.243 nm was measured, which corresponds to the (400) face of the monoclinic phase of NiMoO4. Besides, the successful synthesis of the N–C@NiMoO4 composite with numerous NiMoO4 nanosheets grown on the inner N–C NT shell can be further elucidated by the elemental mapping images and EDS. (Fig. S1, ESI†).
In order to study the specific surface area and pore structure of the electrode materials, N2 adsorption/desorption isotherms were acquired. As shown in Fig. 5, the N2 adsorption/desorption isotherms of the N–C@NiMoO4 double-shelled hollow microtubes, NiMoO4 microspheres, N–C NTs and Ppy NTs are similar in shape. From comparison of the four adsorption/desorption isotherms, it can be seen that all of the samples have typical type IV isotherms with an H3-type hysteresis loop (p/p0 > 0.4), which illustrates the existence of a mesoporous structure in the four kinds of materials. From the values shown in Table 1, the N–C@NiMoO4 double-shelled hollow composite with numerous NiMoO4 nanosheets grown on the N–C NT surfaces, has a larger specific surface area of 258.2 m2 g−1 and an appropriate pore volume of 1.084 cm3 g−1 compared with the other three samples, which is in good agreement with SEM and TEM. In detail, the introduction of N–C NTs and the in-situ growth process of the NiMoO4 nanosheets effectively prevent the aggregation of the outer shells and expose more NiMoO4 nanosheets in the exterior, thereby increasing the specific surface area of the composite. Besides, the average pore size of the N–C@NiMoO4 double-shelled hollow microtubes is about 9.164 nm, which is more narrow than that of the Ppy tubes (14.00 nm) and N–C tubes (12.33 nm), indicating a more stable pore structure of the composite.
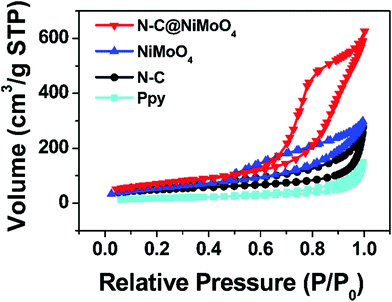 | ||
| Fig. 5 N2 adsorption/desorption isotherms of N–C@NiMoO4 double-shelled hollow microtubes, NiMoO4 microspheres, N–C NTs and Ppy NTs. | ||
| Material | Specific surface area (m2 g−1) | Pore volume (cm3 g−1) | Pore diameter (nm) |
|---|---|---|---|
| Ppy NTs | 63.24 | 0.2389 | 14.00 |
| N–C NTs | 165.3 | 0.4074 | 12.33 |
| NiMoO4 microspheres | 199.8 | 0.5477 | 7.021 |
| C@NiMoO4 microtubes | 258.2 | 1.084 | 9.164 |
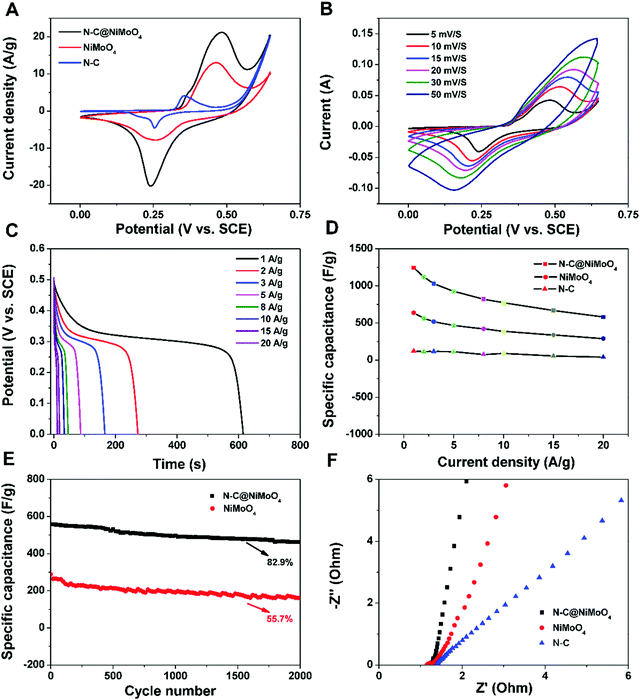
The electrochemical properties of the as-prepared electrode materials were mainly studied by cyclic voltammetry (CV), and galvanostatic charge–discharge (GCD) in order to analyze their potential applications for supercapacitors. The CV measurement of the N–C@NiMoO4 double-shelled hollow microtubes, NiMoO4 microspheres and N–C NTs was executed at a 5 mV s−1 scan rate in 2 mol L−1 KOH electrolytes, and the curves are shown in Fig. 6A. It can be seen that the CV curves of the N–C@NiMoO4 double-shelled hollow microtubes and NiMoO4 microspheres have a similar redox peak shape, which corresponds to the electrochemical reaction of Ni2+/Ni3+. But the position of the two peaks and the current density responses are slightly different, which may be attributed to the microtube structure and the existence of N–C NTs in the N–C@NiMoO4 composite during the electrochemical process.36 It is worth noting that the redox reaction of the Mo atoms does not occur. The contribution of Mo atoms to the capacitance is negligible, while the Mo atom plays an important role in improving the conductivity to enhance the electrochemical performance of the composite.42–44 In addition, it is well known that the specific capacitance is proportional to the area surrounded by the CV curve at the same scan rate. It is reasonable to speculate that the N–C@NiMoO4 composite has a higher specific capacitance due to its higher redox current intensity and larger integral area among the three electrode materials.45 These conclusions can also be further summarized from the following GCD measurements. The high specific capacitance of the double-shelled hollow N–C@NiMoO4 microtubes may be because of a large number of active sites on the surface of the composite materials and the existence of a porous structure, which is beneficial to ion transport during the electrochemical process. The CV curves of the N–C@NiMoO4 microtubes in the voltage range of 0–0.65 V at different scan rates (5–50 mV s−1) are shown in Fig. 6B. It is pretty obvious that the CV curves have a similar redox peak at different scan rates. The cathodic and anodic peak currents increase with an increase in scan rate, and the position of the cathodic and anodic peaks respectively shifts toward a high potential and low one, respectively, which is due to the polarization effect of the electrode.46 The unchanged shape of the CV curve as the scan rate increases from 5 to 50 mV s−1 indicates the high rate capability and good reversibility.47,48Fig. 6C contains the discharge curves of the N–C@NiMoO4 double-shelled hollow microtubes as electrode materials at different current densities in the range of 1–20 A g−1. It is well known that the discharge time is proportional to the specific capacitance value during the process of charge–discharge test according to the following equation [eqn (1)],25 where Csp is the specific capacity of the electrode materials (F g−1), I represents the constant current of the charge–discharge test (A), Δt is the discharge time (s), m is the mass of active material on the electrode (g), and ΔV means the voltage range of the constant current charge–discharge test (V).
| Csp = IΔt/mΔV | (1) |
As an important parameter to evaluate the practical application potential for supercapacitors, the electrochemical stability of the N–C@NiMoO4 double-shelled hollow microtubes was investigated by means of cyclic charge–discharge operation.49,50Fig. 6E reveals the cycling performance of the N–C@NiMoO4 composites and NiMoO4 micropheres at a current density of 20 A g−1. It displays that the double-shelled hollow N–C@NiMoO4 microtubes present a superior cycling stability of 82.9% specific capacitance after 2000 cycles. At the same operation, the capacitance retention was only 55.7% for the NiMoO4 micropheres. The loss of specific capacitance may be due to the destruction of the structure and the reduction of surface active sites, resulting in an increase in resistance during the charge–discharge process. The improvement in cycling performance of the N–C@NiMoO4 double-shelled hollow microtubes may be due to the introduction of N–C NTs as a substrate, which effectively prevents the NiMoO4 nanosheets from aggregating and increases the number of active sites exposed to the electrolyte; these changes are beneficial to the Faraday reaction. Meanwhile, the unique double-shelled hollow structure with high surface area and good pore size distribution of the N–C@NiMoO4 composite could accommodate the volume change and prevent the pulverization of the electrode material during the cycling process. What's more, the Nyquist plots of the three electrode materials (Fig. 6F) were studied in order to obtain more information on the superior electrochemical behavior. The semicircle at high frequencies is usually linked to the ionic charge-transfer resistance (Rct).51 The smaller diameter corresponds to the lower Rct. The lower Rct presents a larger electroactive surface area of the electrode materials, which is possibly because of the large specific surface area and high electrical conductivity of the N–C NTs in the composite.52,53 At low frequencies, a straight line represents the diffusive resistance of the electrode. As shown in Fig. 6F, the straight line of the double-shelled hollow N–C@NiMoO4 microtubes is nearly perpendicular to the real axis, indicating high capacitive behavior.46,54 These results suggest that NiMoO4 nanosheets grown on N–C NTs possess a lower resistance than NiMoO4 microspheres during the electrochemical process.
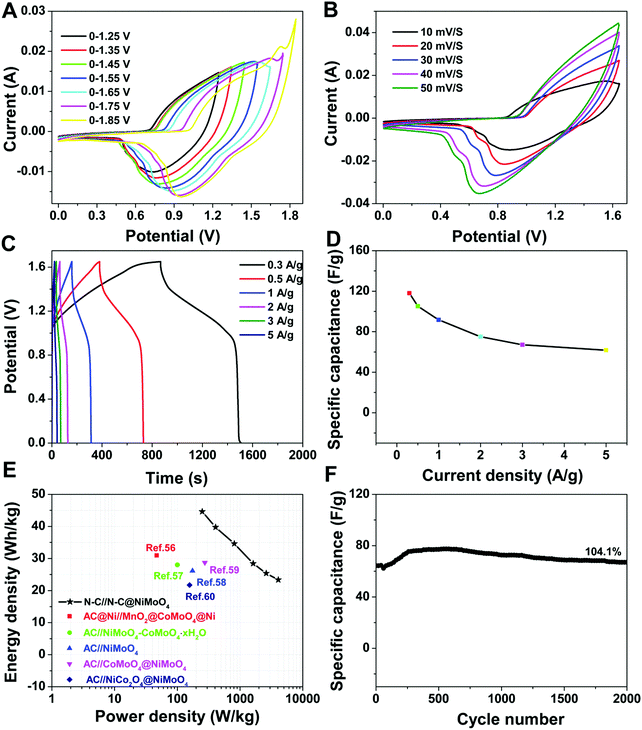
To further confirm the excellent electrochemical performance of the double-shelled hollow N–C@NiMoO4 composite electrode material in practical applications, an asymmetric supercapacitor (ASC) device was assembled by configuring the N–C@NiMoO4 composite material as the positive electrode and N–C as the negative one in 2 mol L−1 KOH electrolyte with a piece of filter paper as the separator (Fig. 7). As shown in Fig. S2 (ESI†), the voltage window of the N–C electrode is from −1.0 to 0 V with representative EDLC behaviour. Combined with the 0–0.65 V voltage window of the N–C@NiMoO4 microtube electrode in a three-electrode system, the total cell voltage of the ASC device can be increased up to 1.65 V. Fig. 7A shows the CV curves of the N–C@NiMoO4//N–C ASC device in different voltage windows from 1.25 V to 1.85 V at the same scan rate of 10 mV s−1. Considering the influence of voltage window on the energy density of supercapacitors, the electrochemical windows of the ASC device can be extended to 1.65 V as expected. As shown in Fig. 7B, the CV peak current of the N–C@NiMoO4//N–C ASC in the voltage window of 0–1.65 V increases with an increase in scan rate from 10 mV s−1 to 50 mV s−1, and the position of the redox peaks is shifted to high and low potential, respectively. Galvanostatic charge–discharge curves of the N–C@NiMoO4//N–C ASC device at a series of current densities were acquired in the range of 0–1.65 V and presented in Fig. 7C. According to these curves, an increase in specific capacitance with a decrease in current density was calculated and shown in Fig. 7D. It can be seen that the specific capacitance of the N–C@NiMoO4//N–C ASC device is 118, 105.1, 91.56, 75.11, 67.09 and 61.76 F g−1 at a current density of 0.3, 0.5, 1, 2, 3 and 5 A g−1, respectively. The energy density and power density of the ASC can be estimated according to eqn (2) and (3) based on the results of galvanostatic charging–discharging (Fig. 7E).55
| E = (Cm × ΔV2)/7.2 | (2) |
| P = (E × 3600)/Δt | (3) |
4. Conclusions
In summary, a N–C@NiMoO4 composite with a tube-structure has been successfully synthesized via a simple and environmentally friendly hydrothermal method. It is remarkable that the brilliant double-shelled hollow composite with NiMoO4 nanosheets as the outer shell and N–C nanotubes as the inner shell, effectively integrates NiMoO4 materials (high specific capacitance) with N–C NTs (excellent conductive properties), and exhibits a series of prominent features including high specific surface area, incremental electrical conductivity, short ion diffusion paths, more active sites and flexiblity. N–C@NiMoO4 double-shelled hollow microtubes as an electrode material have a specific capacitance of up to 1242 F g−1 at 1 A g−1, superior current capacitive behaviour and better rate capability compared with bare NiMoO4 microspheres and N–C NTs. Furthermore, the as-designed N–C@NiMoO4//N–C asymmetric supercapacitor device with a high operation voltage delivers a high energy density of 44.6 W h kg−1 at a power density of 250.4 W kg−1 and provides an excellent cycling stability of 104.1% after 2000 cycles.Conflicts of interest
There are no conflicts to declare.Acknowledgements
The present work is financially supported by the Natural Science Foundation under the grants of NSFC (51602289), the Outstanding Young Talent Research Fund of Zhengzhou University (32210461), and the Startup Research Fund of Zhengzhou University (51090104).References
- Y. Yu, J. Zhong, W. Sun, R. Kumar and N. Koratkar, Adv. Funct. Mater., 2017, 27, 1606461 CrossRef.
- G. Z. Sun, X. Zhang, R. Z. Lin, B. Chen, L. X. Zheng, X. Huang, L. Huang, W. Huang, H. Zhang and P. Chen, Adv. Electron. Mater., 2016, 2, 1600102 CrossRef.
- Z. Q. Niu, W. Y. Zhou, X. D. Chen, J. Chen and S. S. Xie, Adv. Mater., 2015, 27, 6002–6008 CrossRef CAS PubMed.
- M. J. Deng, C. C. Wang, P. J. Ho, C. M. Lin, J. M. Chen and K. T. Lu, J. Mater. Chem. A, 2014, 2, 12857–12865 CAS.
- A. P. P. Alves, R. Koizumi, A. Samanta, L. D. Machado, A. K. Singh, D. S. Galvao, G. G. Silva, C. S. Tiwary and P. M. Ajayan, Nano Energy, 2017, 31, 225–232 CrossRef CAS.
- D. L. Li, Y. N. Gong and C. X. Pan, Sci. Rep., 2016, 6, 29788 CrossRef PubMed.
- S. Khalid, C. B. Cao, L. W. Wang and Y. Zhu, Sci. Rep., 2016, 6, 22699 CrossRef CAS PubMed.
- S. K. Kaverlavani, S. E. Moosavifard and A. Bakouei, J. Mater. Chem. A, 2017, 5, 14301 CAS.
- H. Y. Ma, D. B. Kong, Y. Xu, X. Y. Xie, Y. Tao, Z. C. Xiao, W. Lv, H. D. Jang, J. X. Huang and Q. H. Yang, Small, 2017, 1701026 CrossRef PubMed.
- J. H. Lee, T. Y. Yang, H. Y. Kang, D. H. Nam, N. R. Kim, Y. Y. Lee, S. H. Lee and Y. C. Joo, J. Mater. Chem. A, 2014, 2, 7197–7204 CAS.
- F. R. Jiang, W. Y. Li, R. J. Zou, Q. Liu, K. B. Xu, L. An and J. Q. Hu, Nano Energy, 2014, 7, 72–79 CrossRef CAS.
- B. Wang, X. Y. He, H. P. Li, Q. Liu, J. Wang, L. Yu, H. J. Yan, Z. S. Li and P. Wang, J. Mater. Chem. A, 2014, 2, 12968–12973 CAS.
- J. Q. Yang, X. C. Duan, W. Guo, D. Li, H. L. Zhang and W. J. Zheng, Nano Energy, 2014, 5, 74–81 CrossRef CAS.
- J. Liang, K. Xi, G. Q. Tan, S. Chen, T. Zhao, P. R. Coxon, H. Kim, S. J. Ding, Y. Yang, R. V. Kumar and J. Lu, Nano Energy, 2016, 27, 457–465 CrossRef CAS.
- G. X. Gao, H. B. Wu and X. W. Lou, Adv. Energy Mater., 2014, 4, 1400422 CrossRef.
- K. Xiao, L. Xia, G. X. Liu, S. Q. Wang, L. X. Ding and H. H. Wang, J. Mater. Chem. A, 2015, 3, 6128–6135 CAS.
- C. Yang, L. L. Zhang, N. T. Hu, Z. Yang, H. Wei and Y. F. Zhang, J. Power Sources, 2016, 302, 39–45 CrossRef CAS.
- T. Y. Liu, L. Finn, M. H. Yu, H. Y. Wang, T. Zhai, X. H. Lu, Y. X. Tong and Y. Li, Nano Lett., 2014, 14, 2522–2527 CrossRef CAS PubMed.
- S. Ratha, A. K. Samantara, K. K. Singha, A. S. Gangan, B. Chakraborty, B. K. Jena and C. S. Rout, ACS Appl. Mater. Interfaces, 2017, 9, 9640–9653 CAS.
- B. Wang, S. M. Li, X. Y. Wu, W. M. Tian, J. H. Liu and M. Yu, J. Mater. Chem. A, 2015, 3, 13691–13698 CAS.
- H. Chen, X. L. Liu, J. M. Zhang, F. Dong and Y. X. Zhang, Ceram. Int., 2016, 42, 8909–8914 CrossRef CAS.
- Z. X. Yin, S. Zhang, Y. J. Chen, P. Gao, C. L. Zhu, P. P. Yang and L. H. Qi, J. Mater. Chem. A, 2015, 3, 739–745 CAS.
- D. P. Cai, D. D. Wang, B. Liu, Y. R. Wang, Y. Liu, L. L. Wang, H. Li, H. Huang, Q. H. Li and T. H. Wang, ACS Appl. Mater. Interfaces, 2013, 5, 12905–12910 CAS.
- S. E. Moosavifard, J. Shamsi, S. F. Jahromi and S. Kadkhodazade, RSC Adv., 2014, 4, 52555–52561 RSC.
- J. Xu, S. L. Gai, F. He, N. Niu, P. Gao, Y. J. Chen and P. P. Yang, J. Mater. Chem. A, 2014, 2, 1022–1031 CAS.
- D. Z. Kong, C. W. Cheng, Y. Wang, J. I. Wong, Y. P. Yang and H. Y. Yang, J. Mater. Chem. A, 2015, 3, 16150–16161 CAS.
- T. Liu, H. Chai, D. Z. Jia, Y. Su, T. Wang and W. Y. Zhou, Electrochim. Acta, 2015, 180, 998–1006 CrossRef CAS.
- X. Xu, D. M. Yu, H. Zhou, L. S. Zhang, C. H. Xiao, C. W. Guo, S. W. Guo and S. J. Ding, J. Mater. Chem. A, 2016, 4, 4375–4379 CAS.
- D. P. Dubal, N. R. Chodankar, Z. Caban-Huertas, F. Wolfart, M. Vidotti, R. Holze, C. D. Lokhande and P. Gomez-Romero, J. Power Sources, 2016, 308, 158–165 CrossRef CAS.
- Q. Liu, Z. H. Pu, C. Tang, A. M. Asiri, A. H. Qusti, A. O. Al-Youbi and X. P. Sun, Electrochem. Commun., 2013, 36, 57–61 CrossRef CAS.
- W. Yang, X. W. Xu, L. Q. Hou, X. L. Ma, F. Yang, Y. Wang and Y. F. Li, J. Mater. Chem. A, 2017, 5, 5952–5960 CAS.
- T. Zhu, H. B. Wu, Y. B. Wang, R. Xu and X. W. Lou, Adv. Energy Mater., 2012, 2, 1497–1502 CrossRef CAS.
- J. Xu, L. Li, F. He, R. C. Lv and P. P. Yang, Electrochim. Acta, 2014, 148, 211–219 CrossRef CAS.
- Y. Zhang, J. Xu, Y. Y. Zheng, Y. J. Zhang, X. Hu and T. T. Xu, Nanoscale Res. Lett., 2017, 12, 412 CrossRef PubMed.
- G. Y. Xu, B. Ding, P. Nie, L. F. Shen, J. Wang and X. G. Zhang, Chem. – Eur. J., 2013, 19, 12306–12312 CrossRef CAS PubMed.
- D. P. Cai, B. Liu, D. D. Wang, Y. Liu, L. L. Wang, H. Li, Y. R. Wang, C. X. Wang, Q. H. Li and T. H. Wang, Electrochim. Acta, 2014, 125, 294–301 CrossRef CAS.
- D. P. Cai, B. Liu, D. D. Wang, Y. Liu, L. L. Wang, H. Li, Y. R. Wang, C. X. Wang, Q. H. Li and T. H. Wang, Electrochim. Acta, 2014, 115, 358–363 CrossRef CAS.
- X. H. Wang, H. Y. Xia, J. Gao, B. Shi, Y. Fang and M. W. Shao, J. Mater. Chem. A, 2016, 4, 18181–18187 CAS.
- Y. F. Li, J. M. Jian, Y. Fan, H. Wang, L. Yu, G. Cheng, J. L. Zhou and M. Sun, RSC Adv., 2016, 6, 69627–69633 RSC.
- W. Hong, J. Q. Wang, P. W. Gong, J. F. Sun, L. Y. Niu, Z. J. Yang, Z. F. Wang and S. R. Yang, J. Power Sources, 2014, 270, 516–525 CrossRef CAS.
- D. Cheng, Y. F. Yang, Y. B. Luo, C. J. Fang and J. Xiong, Electrochim. Acta, 2015, 176, 1343–1351 CrossRef CAS.
- G. Jiang, M. Y. Zhang, X. Q. Li and H. Gao, RSC Adv., 2015, 5, 69365–69370 RSC.
- D. Guo, Y. Z. Luo, X. Z. Yu, Q. H. Li and T. H. Wang, Nano Energy, 2014, 8, 174–182 CrossRef CAS.
- J. Wang, L. P. Zhang, X. S. Liu, X. Zhang, Y. L. Tian, X. X. Liu, J. P. Zhao and Y. Li, Sci. Rep., 2017, 7, 41088 CrossRef CAS PubMed.
- Y. Z. Jiang, Z. H. Li, B. B. Li, J. Y. Zhang and C. M. Niu, J. Power Sources, 2016, 320, 13–19 CrossRef CAS.
- X. J. Ma, W. B. Zhang, L. B. Kong, Y. C. Luo and L. Kang, New J. Chem., 2015, 39, 6207–6215 RSC.
- Q. H. Tian, X. Wang, G. Y. Huang and X. Y. Guo, Nanoscale Res. Lett., 2017, 12, 214 CrossRef PubMed.
- A. M. Patil, A. C. Lokhande, N. R. Chodankar, V. S. Kumbhar and C. D. Lokhande, Mater. Des., 2016, 97, 407–416 CrossRef CAS.
- S. J. Peng, L. L. Li, H. T. Tan, R. Cai, W. H. Shi, C. C. Li, S. G. Mhaisalkar, M. Srinivasan, S. Ramakrishna and Q. Y. Yan, Adv. Funct. Mater., 2014, 24, 2155–2162 CrossRef CAS.
- X. J. Ma, W. B. Zhang, L. B. Kong, Y. C. Luo and L. Kang, New J. Chem., 2015, 39, 6207–6215 RSC.
- E. K. Feng, H. Peng, Z. G. Zhang, J. D. Li and Z. Q. Lei, New J. Chem., 2017, 41, 9024–9032 RSC.
- J. Y. Zhou, H. Zhao, X. M. Mu, J. Y. Chen, P. Zhang, Y. L. Wang, Y. M. He, Z. X. Zhang, X. J. Pan and E. Q. Xie, Nanoscale, 2015, 7, 14697–14706 RSC.
- J. B. Cheng, H. L. Yan, Y. Lu, K. W. Qiu, X. Y. Hou, J. Y. Xu, L. Han, X. M. Liu, J. K. Kim and Y. S. Luo, J. Mater. Chem. A, 2015, 3, 9769–9776 CAS.
- J. S. Wei, H. Ding, P. Zhang, Y. F. Song, J. Chen, Y. G. Wang and H. M. Xiong, Small, 2016, 12, 5927–5934 CrossRef CAS PubMed.
- J. Zhang, H. J. Feng, Q. Qin, G. F. Zhang, Y. X. Cui, Z. Z. Chai and W. J. Zheng, J. Mater. Chem. A, 2016, 4, 6357–6367 CAS.
- Z. L. Liu, Z. Y. Zhao, F. Teng, C. Chang, Y. X. Zhao, Y. Yang, W. Q. Yao, Y. F. Zhu and Y. Z. Fan, RSC Adv., 2016, 6, 46508–46515 RSC.
- B. Senthilkumar, D. Meyrick, Y. S. Lee and R. K. Selvan, RSC Adv., 2013, 3, 16542–16548 RSC.
- M. M. Yao, Z. H. Hu, Y. F. Liu and P. P. Liu, Ionics, 2016, 22, 701–709 CrossRef CAS.
- Z. Q. Zhang, H. D. Zhang, X. Y. Zhang, D. Y. Yu, Y. Ji, Q. S. Sun, Y. Wang and X. Y. Liu, J. Mater. Chem. A, 2016, 4, 18578–18584 CAS.
- D. Cheng, Y. F. Yang, J. L. Xie, C. J. Fang, G. Q. Zhang and J. Xiong, J. Mater. Chem. A, 2015, 3, 14348–14357 CAS.
Footnote |
| † Electronic supplementary information (ESI) available: STEM image, EDS mapping results and EDS spectrum of the double-shelled hollow N–C@NiMoO4 composite; CV curve of the N–C NT electrode in a three-electrode system. See DOI: 10.1039/c7nj03422a |
| This journal is © The Royal Society of Chemistry and the Centre National de la Recherche Scientifique 2018 |


