Development and characterization of amine-functionalized hyper-cross-linked resin for CO2 capture†
Fenglei
Liu
a,
Shuoyu
Wang
a,
Guorong
Lin
a and
Shuixia
Chen
 *ab
*ab
aPCFM Lab, School of Chemistry, Sun Yat-Sen University, Guangzhou 510275, P. R. China. E-mail: cescsx@mail.sysu.edu.cn
bMaterials Science Institute, Sun Yat-Sen University, Guangzhou 510275, P. R. China
First published on 20th November 2017
Abstract
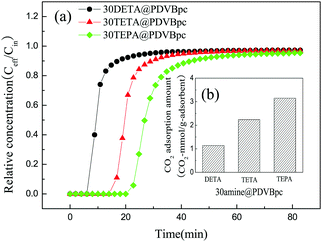
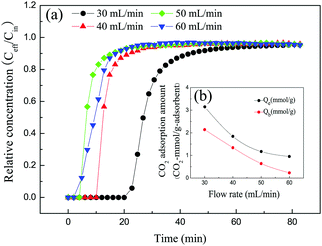
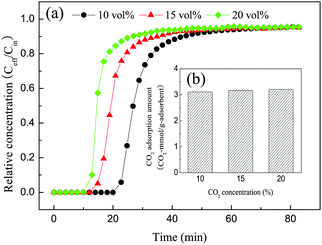
A hyper-cross-linked resin (PDVBpc) based solid amine adsorbent was synthesized by suspension polymerization of divinylbenzene (DVB) and a Friedel–Crafts alkylation reaction, followed by impregnation with tetraethylenepentamine (TEPA), for CO2 capture. The results showed that the specific surface area and pore volume of the initial porous polymer (PDVB) remarkably increased after the Friedel–Crafts alkylation reaction, which was beneficial for increasing the loading of TEPA and the adsorption of CO2. To determine the CO2 adsorption performance, certain factors, including the TEPA loading, flow rate, CO2 concentration and adsorption temperature, were investigated. The maximum adsorbed amount of CO2 (3.11 mmol g−1) was achieved at 25 °C and a CO2 concentration of 10 vol% when the flow rate was 30 mL min−1 and the TEPA loading was 30 wt%. The optimal TEPA loading could provide sufficient active sites for CO2 capture, whereas excessive loading may lead to aggregation of the adsorbent and blockage of pore channels. An increase in temperature was unfavourable for the adsorption of CO2, because the reaction between amine groups and carbon dioxide was exothermic. A high CO2 concentration would reduce the breakthrough time but would not affect the adsorption capacity for CO2. The experimental data fitted the Avrami model well at different temperatures, which indicated that both physisorption and chemisorption contributed to the adsorption of CO2. Thus, a promising material for the adsorption of CO2 was obtained via the functionalization with TEPA of a hyper-crosslinked resin.
1. Introduction
Ever since the industrial revolution, the CO2 concentration has been increasing rapidly in the atmosphere, which is considered to be a principal reason for climate change and global warming.1–3 Therefore, the problems of CO2 capture and storage (CCS) have become an important issue for governments and academia. Over several years, by using techniques based on liquid amines, CO2 capture has been well developed and is used in various industrial fields.4,5 Nevertheless, this method has to confront many shortcomings, such as high regeneration energies, corrosion and solvent losses.6 To overcome these challenges, researchers have focused on solid adsorbents for CO2 capture because of their high adsorption capacity and selectivity, lower energy requirements and stable adsorption–desorption performance. Recently, a number of solid adsorbents have been developed for the adsorption of CO2, such as zeolites,7 activated carbon (AC),8 mesoporous silica,9 metal–organic frameworks (MOFs)10 and hyper-crosslinked polymers (HCPs).11In particular, hyper-crosslinked polymers have been regarded as among the most outstanding solid adsorbents owing to their large specific surface area, high thermal stability, low skeleton density and adjustable porosity. Hence, they have been extensively studied and examined for CO2 capture. For example, Pillaiyar et al.12 synthesized a low-cost porous hyper-crosslinked polymer (PHAP-1) with a specific surface area of 1137 m2 g−1, which exhibited an adsorption capacity of 2.6 mmol g−1. Yao et al.13 developed a tetraphenylmethane-based HCP for the adsorption of CO2, of which the equilibrium adsorption capacity was 3.63 mmol g−1. Saleh et al.14 reported a novel hyper-crosslinked heterocyclic porous polymer for CO2 capture, which displayed a specific surface area of up to 1022 m2 g−1 with a CO2 adsorbed amount of 11.4 wt%. Wang et al.15 prepared a hyper-crosslinked polymer with a large specific surface area of 1168 m2 g−1, and its maximum CO2 adsorbed amount was 12.9 wt%. However, on the one hand, these adsorbent materials exhibited large surface areas and high adsorption capacity, but on the other hand they also exhibited low selectivity and low adsorption capacity for CO2 at low pressures. In addition, the synthesis of these materials usually uses formaldehyde dimethyl acetal as an external linker. Therefore, the search for new adsorbent materials has been of great importance. Hyper-crosslinked resin is a kind of hyper-crosslinked polymer, which is frequently prepared from styrene or divinylbenzene by suspension polymerization and a Friedel–Crafts alkylation reaction.16–19 The large specific surface area, large pore volume and unique porous structure of hyper-crosslinked resin make it possible to increase the loading amount of amine and the CO2 adsorption performance. Moreover, TEPA is a typical amine compound and contains abundant amine groups in molecular chains.20 On the basis of these reasons, the use of a hyper-crosslinked resin functionalized with TEPA would probably be an effective way of adsorbing CO2.
In this study, a solid amine adsorbent based on hyper-crosslinked resin was synthesized by suspension polymerization, a Friedel–Crafts alkylation reaction and a wet impregnation method. The prepared adsorbent was characterized by the N2 adsorption–desorption isotherm, FT-IR spectroscopy, EA and TGA. To achieve desirable CO2 adsorption performance, various adsorption parameters such as the TEPA loading, CO2 concentration, flow rate and adsorption temperature are discussed in detail. Three kinetic models were also employed to investigate the CO2 adsorption behaviour. Furthermore, the regenerability of this adsorbent was also investigated under dry conditions.
2. Experimental section
2.1 Materials and reagents
Divinylbenzene (DVB, purity 55%), dibenzoyl peroxide (BPO) and polyvinyl alcohol (PVA) were purchased from Aladdin Chemical Company, Shanghai. Toluene, acetone, ethanol, anhydrous ferric chloride (FeCl3), diethylenetriamine (DETA), triethylenetetramine (TETA), tetraethylenepentamine (TEPA), sodium chloride (NaCl), hydrochloric acid (HCl) and 1,2-dichloroethane (DCE) were obtained from Guangzhou Jinghong Chemical Company. Highly pure N2 and CO2 were supplied by Guangzhou Zhuorui Company. All chemical reagents were of analytical grade and were used without further purification.2.2 Synthesis of solid amine adsorbent
The preparation process of the solid amine adsorbent based on the hyper-crosslinked resin is illustrated in Fig. 1. Firstly, the initial porous polymer was prepared by a suspension polymerization method.21 A 0.2 g sample of BPO was dissolved in an organic phase (20 g DVB and 40 g toluene). Afterwards, the organic phase was gradually added to an aqueous phase (120 mL pure water, 1.2 g PVA and 12 g NaCl). Toluene and BPO were used as a porogen and an initiator, respectively. The polymerization reaction was continued at 80 °C for 12 h. Subsequently, the white products were washed, extracted with acetone in a Soxhlet apparatus for 24 h and dried at 70 °C for 8 h. The porous polymer that was obtained was denoted as PDVB.Secondly, 1 g of PDVB was immersed in 20 mL of 1,2-dichloroethane for 12 h, after which 0.2 g of FeCl3 was added to the mixture as a catalyst.22 Then, the reaction temperature was raised to 80 °C and held for 12 h. The brown products were washed with acetone, 0.1 M HCl and water, respectively, and dried at 65 °C for 6 h. The hyper-crosslinked resin that was obtained was denoted as PDVBpc.
Finally, PDVBpc was further functionalized with TEPA via a physical impregnation method.23 Typically, a certain amount of TEPA was added to 15 mL of ethanol under stirring. After complete dissolution, PDVBpc was added to the solution and impregnated for 12 h. Afterwards, all adsorbents were dried at 60 °C for 6 h. The product that was obtained was denoted as xTEPA@PDVBpc, where x represents the respective TEPA content in the adsorbent. The initial porous polymer (PDVB) was also impregnated with a maximum loading of TEPA for CO2 capture.
2.3 Physical and chemical characterization
Adsorption–desorption isotherms of N2 were obtained using an automatic gas adsorption instrument at 77.35 K (ASAP2020, Micromeritics, Norcross, GA, USA) to characterize the pore structure of all adsorbents. The total pore volume was calculated from the adsorption capacity for N2 at P/P0 = 0.95. The specific surface area was calculated by the Brunauer–Emmett–Teller (BET) method, and the pore size distribution was determined via a density functional theory (DFT) method. Fourier transform infrared (FT-IR) spectroscopy (Bruker Optics, Mannheim, Germany) and elemental analysis (Elementar Vario EL, Germany) were used to analyze the structure and chemical composition of the samples. The thermal stability of all samples was determined using a thermogravimetric analyzer (Netzsch TG-209, Germany) in the range of 25–700 °C under an N2 atmosphere.2.4 CO2 adsorption experiment
A dynamic CO2 adsorption test was performed by gas chromatography. A fresh adsorbent (1 g) was packed into the middle of an adsorption column (Φ = 1.3 cm). Prior to the adsorption experiment, dry N2 was introduced into the sample for 30 min to remove air. After that, dry CO2/N2 gas mixtures were introduced into the adsorption column. The CO2 concentrations of the inlet and outlet gas mixtures were measured by gas chromatography. The flow rates of the gas mixtures were controlled by mass flow controllers, and the CO2 concentration was monitored by changing the volume ratio of N2 and CO2.The adsorbed amount was calculated according to eqn (1):
 | (1) |
3. Results and discussion
3.1 Characterization of adsorbents
The porosity of PDVB and PDVBpc and the corresponding samples impregnated with TEPA were characterized via the adsorption of N2 at 77.3 K. Fig. 2 shows the N2 adsorption–desorption isotherms and pore size distributions of samples of PDVB, PDVBpc, TEPA@PDVB and TEPA@PDVBpc. The N2 adsorption–desorption isotherms of PDVB and PDVBpc were type IV isotherms with a hysteresis loop, which demonstrated their porous characteristics. The amount of N2 adsorbed by PDVBpc was much larger than that adsorbed by PDVB at the same relative pressure, as seen in Fig. 2(a). Moreover, the shape of the pore diameter distribution of PDVBpc was also quite different from that of PDVB, as seen in Fig. 2(b). Table 1 shows the corresponding textural properties of all the adsorbents, such as their specific surface area, pore volume and average pore diameter. As listed in Table 1, the specific surface area (1369 m2 g−1) and pore volume (1.274 cm3 g−1) of PDVBpc were twice those of PDVB (672 m2 g−1 and 0.580 cm3 g−1, respectively). These results suggested that the pore structure of PDVB had been altered and some new pores had been formed during the Friedel–Crafts alkylation reaction.21 However, when TEPA was introduced into PDVBpc, both the specific surface area and the pore volume of TEPA@PDVBpc decreased dramatically. The reason was that the pores of PDVBpc were filled and blocked by TEPA molecules, which reduced the specific surface area and total pore volume. However, the average pore diameter increased markedly as the TEPA content increased. This phenomenon can be explained as follows: during the impregnation process, TEPA molecules initially filled the small pores and then the large pores,24 which led to a decline in the values of VTotal and SBET from 1.274 mL g−1 for PDVBpc to 0.294 mL g−1 for 40TEPA@PDVBpc and from 1369 m2 g−1 to 122 m2 g−1, respectively. Because the pores were not filled with TEPA, the value of DPore was calculated by the following formula: DPore = 4VTotal/SBET. As a result, the value of DPore increased significantly as the TEPA content increased.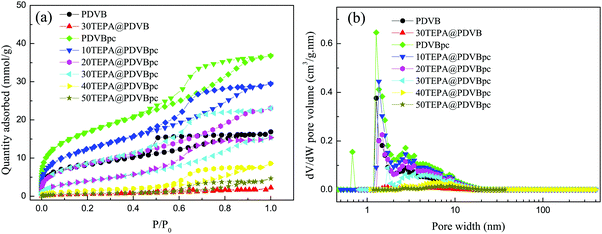 | ||
| Fig. 2 The N2 adsorption–desorption isotherms (a) and (b) pore size distributions of PDVB and PDVBpc before and after loading with TEPA. | ||
| Adsorbent | S BET (m2 g−1) | V Total (cm3 g−1) | D Pore (nm) |
|---|---|---|---|
| PDVB | 672 | 0.580 | 3.45 |
| 30TEPA@PDVB | 47 | 0.012 | — |
| PDVBpc | 1369 | 1.274 | 3.71 |
| 10TEPA@PDVBpc | 997 | 1.019 | 4.09 |
| 20TEPA@PDVBpc | 690 | 0.797 | 4.62 |
| 30TEPA@PDVBpc | 330 | 0.531 | 6.44 |
| 40TEPA@PDVBpc | 122 | 0.294 | 9.64 |
| 50TEPA@PDVBpc | 53 | 0.154 | 11.7 |
Interestingly, when PDVB and PDVBpc were impregnated with the same amount of 30 wt% TEPA, 30TEPA@PDVB agglomerated, whereas 30TEPA@PDVBpc formed uniform brown beads. This may be attributed to the large specific surface area (1369 m2 g−1) and pore volume (1.274 cm3 g−1) of PDVBpc, and TEPA could be well dispersed in the pore channels. To confirm this phenomenon, samples of 30TEPA@PDVBpc and 30TEPA@PDVB were characterized via N2 adsorption–desorption isotherms. As shown in Table 1, after impregnation with 30 wt% TEPA, the specific surface area and pore volume of 30TEPA@PDVBpc were 330 m2 g−1 and 0.531 cm3 g−1. However, for 30TEPA@PDVB, the specific surface area was only 47 m2 g−1 with a pore volume of 0.012 cm3 g−1, which implied that the pores of PDVB were totally filled with TEPA. This result was further proved by SEM. As shown in Fig. S1 (ESI†), samples of both PDVB and PDVBpc displayed typical porous morphology. After impregnation with 30 wt% TEPA, the surface of 30TEPA@PDVB was mostly covered by TEPA, and the pores were almost blocked. In contrast, the morphology of 30TEPA@PDVBpc was almost the same as that of PDVBpc, which suggested that TEPA completely filled the pore channels. Moreover, several considerable pore channels still remained in 30TEPA@PDVBpc, which can reduce the resistance to CO2 diffusion and improve the amine efficiency. This result was consistent with the N2 adsorption–desorption isotherms.
The FT-IR spectra of PDVB and PDVBpc before and after loading with TEPA are shown in Fig. 3. For PDVB, the peak at 3438 cm−1 was associated with adsorbed water.25 The two characteristic bands at 1633 cm−1 and 990 cm−1 were associated with the pendent double-bonded groups (CH![[double bond, length as m-dash]](https://www.rsc.org/images/entities/char_e001.gif) CH2) of PDVB.26 In comparison with the spectrum of PDVB, the two characteristic peaks of the pendent double-bonded groups were weaker or even disappeared in that of PDVBpc, which suggested that the pendent double-bonded groups were consumed during the Friedel–Crafts alkylation reaction.27 After impregnation with TEPA, two emerging absorption peaks appeared at 1650 cm−1 and 1569 cm−1, which might be assigned to the bending vibrations of N–H and NH2 in TEPA.28 More importantly, the more TEPA was loaded, the higher the intensities of the characteristic peaks became. These conclusions were further proved by elemental analysis. As listed in Table 2, there was no nitrogen in PDVB and PDVBpc, but the other samples had similar elemental compositions comprising carbon, hydrogen and nitrogen. With an increase in the loading amount of TEPA, the nitrogen content also increased. From these experimental results, the conclusion can be drawn that TEPA had been successfully introduced into PDVBpc and PDVB.
CH2) of PDVB.26 In comparison with the spectrum of PDVB, the two characteristic peaks of the pendent double-bonded groups were weaker or even disappeared in that of PDVBpc, which suggested that the pendent double-bonded groups were consumed during the Friedel–Crafts alkylation reaction.27 After impregnation with TEPA, two emerging absorption peaks appeared at 1650 cm−1 and 1569 cm−1, which might be assigned to the bending vibrations of N–H and NH2 in TEPA.28 More importantly, the more TEPA was loaded, the higher the intensities of the characteristic peaks became. These conclusions were further proved by elemental analysis. As listed in Table 2, there was no nitrogen in PDVB and PDVBpc, but the other samples had similar elemental compositions comprising carbon, hydrogen and nitrogen. With an increase in the loading amount of TEPA, the nitrogen content also increased. From these experimental results, the conclusion can be drawn that TEPA had been successfully introduced into PDVBpc and PDVB.
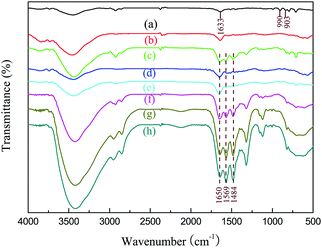 | ||
| Fig. 3 FT-IR spectra of (a) PDVB, (b) PDVBpc, (c) 30TEPA@PDVB, (d) 10TEPA@PDVBpc, (e) 20TEPA@PDVBpc, (f) 30TEPA@PDVBpc, (g) 40TEPA@PDVBpc, and (h) 50TEPA@PDVBpc. | ||
| Adsorbent | Element content (wt%) | ||
|---|---|---|---|
| C | H | N | |
| PDVB | 91.32 | 8.05 | — |
| 30TEPA@PDVB | 76.58 | 9.12 | 9.32 |
| PDVBpc | 89.79 | 7.67 | — |
| 10TEPA@PDVBpc | 81.33 | 7.85 | 3.92 |
| 20TEPA@PDVBpc | 78.21 | 7.84 | 6.95 |
| 30TEPA@PDVBpc | 75.16 | 8.13 | 9.53 |
| 40TEPA@PDVBpc | 63.48 | 9.02 | 12.81 |
| 50TEPA@PDVBpc | 60.76 | 10.26 | 13.37 |
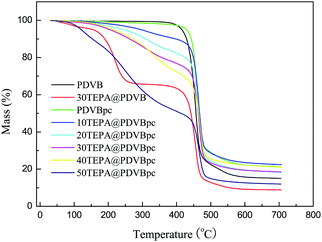
During the regeneration process, given the energy consumption and cost, a major factor for applications used for CO2 capture is the thermal stability of the solid amine adsorbent. Fig. 4 shows the TGA curves for PDVB and PDVBpc before and after loading with TEPA. It can be seen that all the TGA curves exhibited slight weight loss below 100 °C, which may be due to desorption of physically adsorbed water and carbon dioxide.29 Weight loss did not occur until the temperature rose to 340 °C, which demonstrated that both PDVB and PDVBpc had high thermal stability. However, as TEPA was loaded into PDVBpc, obvious weight loss occurred at about 150 °C, which in all probability was due to decomposition of TEPA. The decline in thermal stability followed the increase in the TEPA content from 10 wt% to 50 wt%. The reason was that excess TEPA molecules were located outside the surface of the support at high loading, and these were easily lost by volatilization or decomposition. In other words, TEPA@PDVBpc should be used at temperatures of less than 150 °C.
3.2 CO2 adsorption performance of solid amine adsorbent
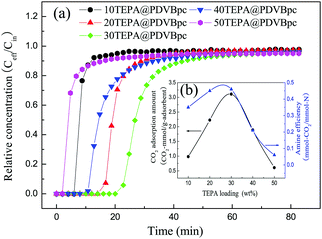 | ||
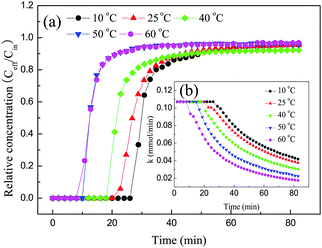
| Fig. 7 (a) Breakthrough curves and (b) amine efficiencies of PDVBpc with different TEPA contents (TEPA@PDVBpc: 1 g, C (CO2): 10 vol%, T: 25 °C, V: 30 mL min−1). | ||
3.3 Adsorption kinetics
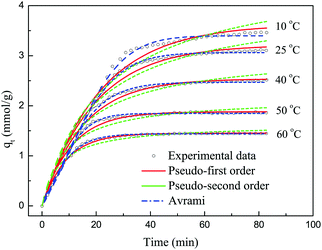
The adsorption kinetics is a critical parameter for assessing the performance of an adsorbent. In order to investigate the kinetics of the adsorption of CO2 on 30TEPA@PDVBpc, three kinetics models were used to fit the experimental data for different temperatures, as follows:the pseudo-first-order model equation:
| qt = qe[1 − exp(−kft)] | (2) |
 | (3) |
| qt = qe[1 − exp(−(kat)n)] | (4) |
Fig. 11 shows the experimental data and the corresponding fits to the kinetic models at different temperatures. Table 4 lists the values of the kinetic parameters of different kinetic models. As shown in Fig. 11, the pseudo-first-order and pseudo-second-order models displayed some deviations with regard to describing the adsorption of CO2 on 30TEPA@PDVBpc. The relative errors for the pseudo-first-order model were 4.74%, 3.41%, 1.11%, 2.17%, and 0.42%, respectively, whereas for the pseudo-second-order model this parameter was 36.04%, 31.02%, 22.42%, 17.66% and 12.11%, respectively. However, the relative errors for the Avrami model were only 1.90%, 1.61%, 1.67%, 0.33% and 0.42%, respectively. Moreover, the R2 values for the Avrami model (R2 = 0.999–0.996) were higher than those for the pseudo-first-order (R2 = 0.993–0.979) and pseudo-second-order models (R2 = 0.963–0.946). In addition, the qe.cal values for the Avrami model were consistent with the experimental values (qe.exp). Therefore, the Avrami model could describe the adsorption behavior of CO2 on 30TEPA@PDVBpc more effectively than the other two models.35
| Kinetic model | Parameter | Temperature/°C | ||||
|---|---|---|---|---|---|---|
| 10 | 25 | 40 | 50 | 60 | ||
| Experimental | q e.exp | 3.465 | 3.110 | 2.511 | 1.840 | 1.445 |
| Pseudo-first-order model | q e.cal | 3.629 | 3.216 | 2.539 | 1.880 | 1.451 |
| k f | 0.0468 | 0.0524 | 0.0665 | 0.0934 | 0.112 | |
| R 2 | 0.979 | 0.984 | 0.987 | 0.983 | 0.993 | |
| Error (%) | 4.74 | 3.41 | 1.11 | 2.17 | 0.42 | |
| Pseudo-second-order model | q e.cal | 4.713 | 4.075 | 3.074 | 2.165 | 1.620 |
| k s | 0.009 | 0.013 | 0.024 | 0.055 | 0.096 | |
| R 2 | 0.961 | 0.963 | 0.963 | 0.946 | 0.959 | |
| Error (%) | 36.04 | 31.02 | 22.42 | 17.66 | 12.11 | |
| Avrami | q e.cal | 3.399 | 3.060 | 2.469 | 1.846 | 1.439 |
| k a | 0.049 | 0.054 | 0.068 | 0.089 | 0.114 | |
| n | 1.636 | 1.516 | 1.339 | 1.493 | 1.178 | |
| R 2 | 0.999 | 0.998 | 0.996 | 0.997 | 0.996 | |
| Error (%) | 1.90 | 1.61 | 1.67 | 0.33 | 0.42 | |
3.4 Regeneration runs
In actual applications, as well as a high CO2 adsorption capacity and fast adsorption kinetics, industrially useful adsorbents should also exhibit stable regenerability. The spent adsorbent 30TEPA@PDVBpc after the adsorption of CO2 was regenerated at 75 °C. To test the stability of 30TEPA@PDVBpc, five cycles of CO2 adsorption–desorption were carried out in this work. As shown in Fig. 12, the breakthrough curve remained almost the same as that of the fresh adsorbent after five cyclic regeneration tests. The CO2 adsorption capacity of 30TEPA@PDVBpc was 2.88 mmol g−1 in the 5th cycle, which represented a decrease of 7.4% in comparison with that of the fresh adsorbent (3.11 mmol g−1). This may be because a proportion of the TEPA was vaporized or decomposed during the desorption process. However, the CO2 adsorption capacity of 30TEPA@PDVBpc could still meet the actual requirement for flue gas of 2–3 mmol g−1 after 5 cycles.36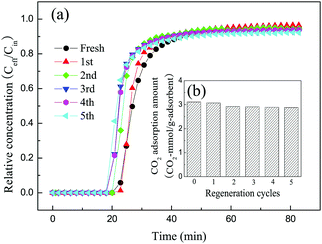 | ||
| Fig. 12 Cyclic CO2 adsorption–desorption performance of 30TEPA@PDVBpc under dry conditions (30TEPA@PDVBpc: 1 g, C (CO2): 10 vol%, T: 25 °C, flow rate: 30 mL min−1). | ||
4. Conclusions
In summary, an efficient material for the adsorption of CO2 was successfully prepared by loading TEPA onto hyper-crosslinked resin and displayed excellent CO2 adsorption performance. The specific surface area and pore volume of PDVB were significantly increased after the Friedel–Crafts alkylation reaction, which was beneficial for increasing the loading of TEPA and adsorption of CO2. The maximum CO2 adsorption capacity (3.11 mmol g−1) was achieved at 25 °C with a CO2 concentration of 10 vol% when the flow rate was 30 mL min−1 and the TEPA loading was 30 wt%. The optimal TEPA loading could provide sufficient active sites for CO2 capture, whereas excessive loading may lead to aggregation of the adsorbent and the blockage of pore channels. An increase in temperature was unfavourable for the adsorption of CO2 because the reaction between amine groups and carbon dioxide was exothermic. A kinetics study found that the Avrami model can not only describe the adsorption behaviour of CO2 but also preliminarily explain the adsorption mechanism on 30TEPA@PDVBpc. In addition, the CO2 adsorption–desorption process was performed under relatively mild conditions. Therefore, the hyper-crosslinked resin modified with TEPA possesses high potential for the adsorption of CO2 and the separation of CO2 from flue gas.Conflicts of interest
There are no conflicts to declare.Acknowledgements
The authors gratefully acknowledge the financial support provided by the National Natural Science Foundation of China (Grant No. 51473187) and the Natural Science Foundation of Guangdong Province (2016A010103013).References
- Z. Tang, Z. Han, G. Yang and J. Yang, Appl. Surf. Sci., 2013, 277, 47–52 CrossRef CAS.
- R. Kishor and A. K. Ghoshal, Chem. Eng. J., 2016, 300, 236–244 CrossRef CAS.
- C. Song, Q. Liu, N. Ji, S. Deng, J. Zhao, Y. Li and Y. Kitamura, Energy, 2017, 124, 29–39 CrossRef CAS.
- W. Zhang, X. Jin, W. Tu, Q. Ma, M. Mao and C. Cui, Appl. Energy, 2017, 195, 316–323 CrossRef CAS.
- G. Fytianos, S. J. Vevelstad and H. K. Knuutila, Int. J. Greenhouse Gas Control, 2016, 50, 240–247 CrossRef CAS.
- A. H. Gorji and A. Sayari, Chem. Eng. J., 2011, 173, 72–79 CrossRef.
- F. Su, C. Lu, S. C. Kuo and W. Zeng, Energy Fuels, 2010, 24, 1441–1448 CrossRef CAS.
- M. G. Plaza, C. Pevida, A. Arenillas, F. Rubiera and J. J. Pis, Fuel, 2007, 86, 2204–2212 CrossRef CAS.
- C. F. Martín, M. B. Sweatman, S. Brandani and X. Fan, Appl. Energy, 2016, 183, 1705–1721 CrossRef.
- A. K. Adhikari and K. S. Lin, Chem. Eng. J., 2016, 284, 1348–1360 CrossRef CAS.
- S. Sung and M. Suh, J. Mater. Chem. A, 2014, 2, 13245–13249 CAS.
- P. Puthiaraj and W. S. Ahn, Ind. Eng. Chem. Res., 2016, 55, 7917–7923 CrossRef CAS.
- S. Yao, X. Yang, M. Yu, Y. Zhang and J. Jiang, J. Mater. Chem. A, 2014, 2, 8054–8059 CAS.
- M. Saleh, H. M. Lee, K. C. Kemp and K. S. Kim, ACS Appl. Mater. Interfaces, 2014, 6, 7325–7333 CAS.
- J. Wang, Y. J. Wei, G. Yi and Y. Zhang, Chem. Commun., 2015, 51, 15708–15711 RSC.
- K. Ando, T. Ito, H. Teshima, H. Kusano and M. Streat, Ion Exchange for Industry, Ellis Horwood Ltd, Chichester, UK, 1988 Search PubMed.
- Z. Fu, H. Li, L. Yang, H. Yuan, Z. Jiao, L. Chen, J. Huang and Y. N. Liu, Chem. Eng. J., 2015, 273, 240–246 CrossRef CAS.
- G. Xiao, L. Fu and A. Li, Chem. Eng. J., 2012, 191, 171–176 CrossRef CAS.
- X. Jiang and J. Huang, J. Colloid Interface Sci., 2016, 467, 230–238 CrossRef CAS PubMed.
- M. Irani, K. A. M. Gasem, B. Dutcher and M. Fan, Fuel, 2016, 183, 601–608 CrossRef CAS.
- X. Zeng, Y. Fan, G. Wu, C. Wang and R. Shi, J. Hazard. Mater., 2009, 169, 1022–1028 CrossRef CAS PubMed.
- Z. Fu, C. He, J. Huang and Y. N. Liu, J. Colloid Interface Sci., 2015, 451, 1–6 CrossRef CAS PubMed.
- S. Xian, X. Feng, M. Chen, Y. Wu, Q. Xia, H. Wang and Z. Li, Chem. Eng. J., 2015, 280, 363–369 CrossRef CAS.
- Z. Chen, S. Deng, H. Wei, B. Wang, J. Huang and G. Yu, ACS Appl. Mater. Interfaces, 2013, 5, 6937–6945 CAS.
- J. Zhu, Q. Chen, Z. Sui, L. Pan, J. Yu and B. Han, J. Mater. Chem. A, 2014, 2, 16181–16189 CAS.
- X. Zeng, H. Yao, N. Ma, Y. Fan, C. Wang and R. Shi, J. Colloid Interface Sci., 2011, 354, 353–358 CrossRef CAS PubMed.
- X. Wang, Z. Fu, N. Yu and J. Huang, J. Colloid Interface Sci., 2015, 466, 322–329 CrossRef PubMed.
- W. Xia, L. Chen and Q. Guo, Chem. Eng. J., 2014, 260, 573–581 Search PubMed.
- X. Yan, L. Zhang, Y. Zhang, G. Yang and Z. Yan, Ind. Eng. Chem. Res., 2011, 50, 3220–3226 CrossRef CAS.
- Y. Liu, J. Shi, J. Chen, Q. Ye, H. Pan, Z. Shao and Y. Shi, Microporous Mesoporous Mater., 2010, 134, 16–21 CrossRef CAS.
- Q. Wang, L. Yao, J. Chen, Z. Du and J. Mi, Environ. Sci. Technol., 2016, 50, 7879–7888 CrossRef CAS PubMed.
- A. H. Gorji, Y. Yang and A. Sayari, Energy Fuels, 2011, 25, 4206–4210 CrossRef.
- X. Xu, C. Song, J. M. Andrésen, B. G. Miller and A. M. Scaroni, Microporous Mesoporous Mater., 2003, 62, 29–45 CrossRef CAS.
- L. Pino, C. Italiano, A. Vita, C. Fabiano and V. Recupero, J. Environ. Sci., 2016, 48, 138–150 CrossRef PubMed.
- S. Loganathan, M. Tikmani and S. Edubilli, Chem. Eng. J., 2014, 256, 1–8 CrossRef CAS.
- M. Niu, H. Yang, X. Zhang, Y. Wang and A. Tang, ACS Appl. Mater. Interfaces, 2016, 8, 17312–17320 CAS.
Footnote |
| † Electronic supplementary information (ESI) available. See DOI: 10.1039/c7nj03421k |
| This journal is © The Royal Society of Chemistry and the Centre National de la Recherche Scientifique 2018 |


