Thiamine-functionalized silver nanoparticles for the highly selective and sensitive colorimetric detection of Hg2+ ions†
Umerdaraz
Khan
a,
Abdul
Niaz
a,
Afzal
Shah
 *b,
Muhammad Iqbal
Zaman
a,
Muhammad Abid
Zia
c,
Faiza Jan
Iftikhar
b,
Jan
Nisar
d,
Muhammad Naeem
Ahmed
e,
Mohammad Salim
Akhter
f and
Aamir Hassan
Shah
 *g
*g
aDepartment of Chemistry, University of Science & Technology, Bannu 28100, KPK, Pakistan
bDepartment of Chemistry Quaid-i-Azam University, Islamabad, 45320, Pakistan. E-mail: afzals_qau@yahoo.com; Fax: +92-5190642241; Tel: +92-5190642110
cUniversity of Education, Attock, Punjab 43600, Pakistan
dNational Centre of Excellence in Physical Chemistry, University of Peshawar, Peshawar, 25120, Pakistan
eDepartment of Chemistry, University of Azad Jammu and Kashmir, Muzaffarabad 13100, Pakistan
fCollege of Science, University of Bahrain, 32038, Bahrain
gUniversity of Chinese Academy of Sciences, Beijing 100049, China. E-mail: quaidian.51214@gmail.com
First published on 29th November 2017
Abstract
Hg2+ contamination is a serious threat to the environment; hence, the development of methods for its trace level detection is urgently required. To contribute in this domain, we report for the first time the application of a highly sensitive and selective colorimetric sensing platform for Hg2+ ions using thiamine-functionalized silver nanoparticles (Th-AgNPs). Upon the addition of Hg2+ ions to the solution, the AgNPs exhibited a noticeable color change from yellow to violet-blue. This color change was monitored by the UV-vis spectrophotometric observation of a significant decrease in the absorption band at 395 nm along with the appearance of a new peak at 550 nm. The designed sensor demonstrated good sensitivity in the concentration range of 1 × 10⁻⁸ to 5 × 10⁻⁶ M with a detection limit of 5 nM. The sensor also showed high selectivity for Hg2+ when tested in the presence of several competing metal ions. Moreover, the method was found to be applicable to river water samples with satisfactory percentage recoveries.
1. Introduction
The unintended agricultural and industrial growth in the last century has triggered widespread water contamination by heavy metal ions. Among the heavy metal ions, mercury is very toxic in all its oxidation states as well as in its elemental form and organometallic complex form such as methyl-mercury.1–4 Owing to high risks to human health and water-dwelling species, the approximate permissible level of Hg2+ in water bodies is suggested to be 2 ppb (10 nM) by the United States Environmental Protection Agency (USEPA).5 Being non-biodegradable, Hg2+ accumulates in human bodies and causes dysfunction of body cells, which ultimately results in kidney, brain, liver and central nervous system related diseases.6 These serious threats related to mercury-contaminated water systems have compelled the scientific community to search for sensitive analytical tools which could detect this water toxin below the threshold limit suggested by the USEPA.The much higher toxicity of Hg2+ among other heavy metal ions has been reported to be related to its stronger affinity for the thiol groups present in specific amino acids of proteins and enzymes.7,8 This high degree of toxicity, posing a serious health hazard, demands immense attention and effort for the development of a highly selective and sensitive sensing system for the routine analysis of Hg2+ ions in food and water bodies. In this context, a number of techniques such as electrochemistry,9 reversed-phase high-performance liquid chromatography,10 fluorometry,11 atomic spectrometry,12,13 and inductively coupled plasma-mass spectrometry14 have been developed for the trace level determination of Hg2+. Although these methods are sensitive towards Hg2+ detection, they generally require cumbersome and time-consuming sample preparation procedures, specialized laboratories, and expensive and bulky instrumentation which render them difficult to be used particularly in field monitoring. In contrast, colorimetric sensors based on noble metal nanoparticles, especially gold nanoparticles (AuNPs) and silver nanoparticles (AgNPs), have gained a great deal of attention for the detection of various organic and inorganic ions.15–17 These nanoparticles confer unique properties to the sensors depending on their size, shape and interparticle distance. These sensing systems are simple, low cost, rapid and suitable for real time and on site monitoring with limited resources. Moreover, these nanoparticle-based sensors provide high sensitivity and selectivity which are mainly attributed to their distinct strong absorption and high extinction properties in the UV-vis region. Moreover, in such kinds of colorimetric sensors, the dispersion and aggregation state of the nanoparticles essentially leads to a change in color that can be observed by the naked eye.16,17 Higher extinction coefficients and lower costs prompted us to prefer AgNPs over AuNPs in designing nanoparticle-based colorimetric sensors.18
The colorimetric detection of ions greatly depends on the ligand attached to the surfaces of the nanoparticles. For this purpose, a number of ligands have been proposed to modify AuNP and AgNP surfaces for the sensitive and selective recognition of Hg2+ ions. Due to the strong affinity of Hg2+ towards sulfur and nitrogen atoms, many Hg2+ sensors have been designed with ligands which contain these kinds of donor atoms. Examples of such ligands include dithioerythritol,19 mercaptoundecanoic acid,20 mercaptopropionic acid,21 thioctic acid,22L-cysteine,23 peptides,24 proteins,25 quaternary ammonium group-terminated thiols,26 DNA27,28 and N-1-(2-mercaptoethyl) thymine.29 The presence of these groups on the surfaces of the nanoparticles can easily and selectively recognize Hg2+ ions through metal–ligand coordination, resulting in the aggregation of nanoparticles. Conversely, Duan et al. reported a colorimetric method based on the anti-aggregation of AgNPs, in which Hg2+ ions prevented the aggregation of AgNPs induced by 6-thioguanine.30 DNA and N-1-(2-mercaptoethyl)thymine have been found to be more suitable sensing ligands for the detection of Hg2+ ions;31 however, their synthetic methods are complex and tedious. Moreover, expensive chemicals are required for the modification of surfaces using these ligands. Therefore, cost-effective, stable and easily available ligands are highly desired for the selective and sensitive detection of Hg2+ ions. Therefore, we used thiamine for the first time as a suitable ligand to modify AgNPs for the development of a highly selective and sensitive sensor for Hg2+ detection. Thiamine, also known as vitamin B1, is a water soluble vitamin and an easily available ligand. Its structure consists of a thiazole ring which contains –S functionality and an aminopyrimidine ring which contains –N functionality. AgNPs could be easily modified with thiamine molecules by the formation of Ag–S bonds. Upon the addition of Hg2+ ions to the solution, the thiamine-modified AgNPs are expected to readily aggregate due to specific interactions between the –N groups on the surface of the Th-AgNPs and Hg2+ to form an N–Hg2+–N complex, in a similar fashion as thymine–Hg2+–thymine coordination (T–Hg2+–T).29 This induced aggregation by Hg2+ ions can result in a color change from yellow to red or violet-blue, which could be readily observed by the naked eye or using a UV-vis spectrophotometer. Our designed sensing system provides high selectivity and sensitivity, a broad linear range and trace level detection of Hg2+ in aqueous solutions.
2. Materials and methods
2.1. Materials
All chemicals utilized in this work were of analytical grade and used without further purification. Thiamine hydrochloride and mercuric chloride were obtained from Merck, Germany. Sodium borohydride (NaBH4), silver nitrate (AgNO3) and other heavy metal salts in the form of either chlorides or nitrates were acquired from Sigma Aldrich, Germany. Deionized water was used for the preparation of all stock solutions and the final washing of glassware. Before starting any experiment, all glassware including cuvettes were first thoroughly washed with 3![[thin space (1/6-em)]](https://www.rsc.org/images/entities/char_2009.gif) :
:![[thin space (1/6-em)]](https://www.rsc.org/images/entities/char_2009.gif) 1 HCl/HNO3 (aqua regia) and then rinsed with deionized water. All measurements and experimental work including the synthesis of AgNPs were performed at room temperature.
1 HCl/HNO3 (aqua regia) and then rinsed with deionized water. All measurements and experimental work including the synthesis of AgNPs were performed at room temperature.
2.2. Instrumentation
UV-vis absorption spectra were recorded on a UV-1800 double beam spectrophotometer (Shimadzu, Japan), using quartz cuvettes of 1.0 cm path length. The absorption spectra were recorded in the UV-vis range from 200 to 800 nm.For HR-TEM measurements, a Hitachi H-8100 (Tokyo, Japan) electron microscope, was used with an accelerating voltage of 200 kV. The HR-TEM analysis was carried out after placing a drop of the colloidal solution of AgNPs onto a carbon-coated copper grid and allowing it to dry at room temperature.
2.3. Procedure for the synthesis of AgNPs
AgNPs were prepared according to the method reported by Wang et al.32 20 mL of 1.0 mM AgNO3 was added dropwise into a 500 mL conical flask containing 70 mL of 0.28 mM trisodium citrate solution and 7.6 mM NaBH4. The mixture was stirred at room temperature for 1 h. The color of the mixture changed to pale yellow which indicated the formation of colloidal AgNPs. To complete the reaction time, the mixture was kept at room temperature for 48 h before its use.2.4. Synthesis of thiamine-functionalized AgNPs (Th-AgNPs)
To prepare Th-AgNPs, 5 mL of the as-prepared AgNPs was diluted up to 10 mL with deionized water, and then 40 μL of 0.01 M thiamine was added to this solution. The mixture was stirred for 2 h and then left undisturbed for 30 h to achieve complete functionalization of the AgNPs with thiamine molecules. The as-prepared Th-AgNPs were used for the colorimetric detection of Hg2+.2.5. Colorimetric detection procedure for Hg2+
For the detection of Hg2+, different concentrations of Hg2+ were added into a beaker/test tubes containing 5 mL of Th-AgNPs solution and stirred to mix them uniformly. Then the mixture was allowed to equilibrate for 5 min. During this time the color of the solution completely turned from yellow to red or violet-blue. The solution was then transferred to quartz cuvettes to monitor the absorption spectra. For real sample analysis, the Hg2+ concentration was determined in river water samples collected from the Kurram river, Pakistan, following the standard addition method. Different known concentrations of Hg2+ were added into a solution containing 3.5 mL of Th-AgNPs plus 1.5 mL of river water and then the absorption spectra were measured. All absorption measurements were performed in triplicate.3. Results and discussion
3.1. The colorimetric detection ability of the Th-AgNPs
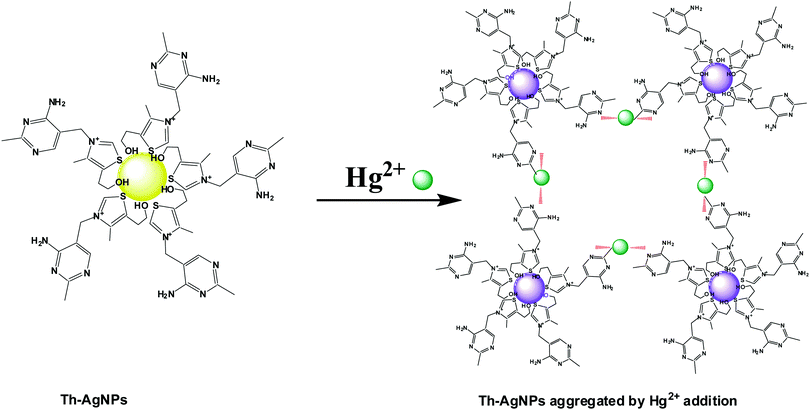
Thiamine has –S and –N functionalities in its structure. Owing to the strong affinity of sulfur atoms with Ag, the surface of the AgNPs could be easily modified with thiamine molecules through Ag–S bonds. FT-IR analysis was carried out to verify the possible interaction between thiamine molecules and AgNPs. As problems were faced in isolating the functionalized AgNPs from the solution, to record the IR data we added drop by drop solutions of thiamine and AgNPs directly into the KBr salt and then dried the samples in a desiccator. The FT-IR spectra of thiamine and thiamine-functionalized AgNPs are presented in Fig. S1 (ESI†). The absorption bands of thiamine at about 3670 cm−1, 1603 cm−1 and 1390 cm−1 can be related to the –NH (–NH2) stretching, –NH bending and C–N stretching of the amine groups in the pyrimidine ring, respectively. Observation of Fig. S1 (ESI†) further reveals the appearance of strong absorption peaks at about 3245 cm−1 and 1065 cm−1 which correspond to the –OH and C–O stretching vibrations of the hydroxyl group, respectively, attached to the thiazole ring via a hydrocarbon chain. A small peak around 740 cm−1 corresponding to the stretching vibration of C–S–C also appeared in the spectrum of thiamine. While recording the IR spectrum of thiamine-functionalized AgNPs, typical bands of –OH at 3245 cm−1 and C–S–C at 740 cm−1 almost disappeared, while the signals of the amino groups still remained. These peaks offer evidence of the attachment of thiamine molecules onto the surface of the AgNPs through the –OH and C–S–C groups of the thiazole ring.It is well known that the amino groups present in the DNA molecules can bind to Hg2+ ions to form a T–Hg2+–T complex.27,28 Similar to the thymine structure, thiamine also offers –N functionalities to the surface of AgNPs that can easily interact with Hg2+ to form a N–Hg2+–N complex. Thus the Th-AgNPs have the ability to sense Hg2+ in solution. The proposed sensing mechanism for Hg2+ is illustrated in Fig. 1. Initially, the color of the dispersed Th-AgNPs was yellow which showed a strong surface plasmon resonance (SPR) band at 395 nm, as shown in Fig. 2.
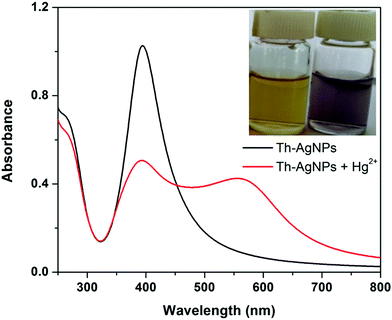 | ||
| Fig. 2 The UV-vis absorption spectra of Th-AgNPs in the absence and presence of 5 × 10⁻⁶ M Hg2+; inset: a photo of the corresponding color change. | ||
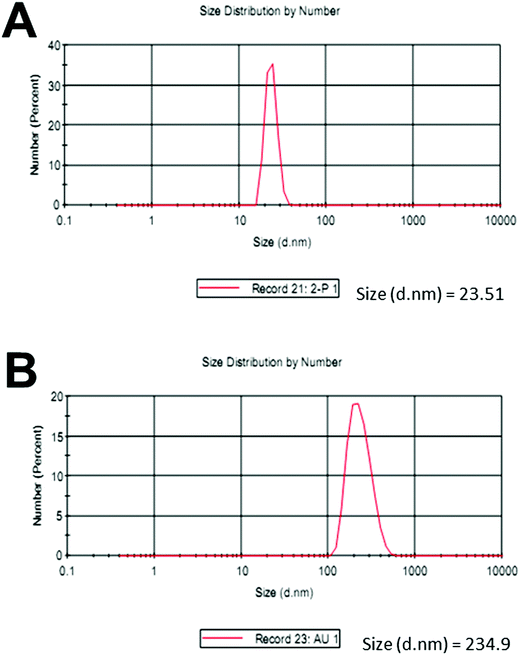
Upon the addition of a small amount of Hg2+ to the solution containing Th-AgNPs, the color of the solution immediately turned from yellow to red or violet-blue, as shown in the inset of Fig. 2. This color change can be related to the aggregation of Th-AgNPs from their dispersed state due to the formation of N–Hg2+–N complexes between thiamine and Hg2+. The color change and aggregation of Th-AgNPs in the presence of Hg2+ were monitored using a UV-vis spectrophotometer. Upon the addition of Hg2+ ions to a solution of Th-AgNPs, the intensity of the SPR band at 395 nm decreased along with the appearance of a new peak at about 550 nm, as demonstrated in Fig. 2. This result suggests that Hg2+ ions could be readily detected using Th-AgNPs. The Hg2+-induced aggregation of Th-AgNPs was further confirmed by the HR-TEM analysis both in the absence and in the presence of Hg2+, as represented by HR-TEM images in Fig. 3. The observation of Fig. 3(A) reveals that in the absence of Hg2+, Th-AgNPs with a particle size of about 13.0 nm were well dispersed in the solution, but in the presence of 1 × 10⁻⁵ M Hg2+, aggregation of Th-AgNPs occurs as shown in Fig. 3(B). This aggregation behavior can be attributed to the interactions between Th-AgNPs and Hg2+ through N–Hg2+–N linkages which are expected to reduce the inter-particle distance with a concomitant increase in the size of the AgNPs. Moreover, a change in the particle size of the AgNPs before and after the addition of Hg2+ to the Th-AgNP solution was observed by dynamic light scattering (DLS) analysis. The observation of Fig. 4(A) manifests that the size of the Th-AgNPs in the absence of Hg2+ is around 23.51 nm. However, in the presence of Hg2+ the dynamic size of the Th-AgNPs significantly increased to a diameter of around 234.9 nm, as shown in Fig. 4(B). Furthermore, the size measured by DLS analysis is somewhat larger than that measured by HR-TEM analysis, as DLS measures the hydrodynamic diameter of the AgNPs dispersed in the aqueous system. These results clearly indicate that Hg2+ triggers the aggregation of the Th-AgNPs.
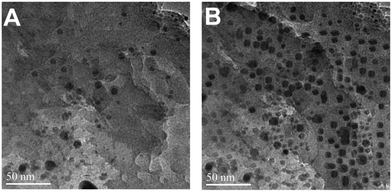 | ||
| Fig. 3 HR-TEM images of (A) dispersed Th-AgNPs in the absence of Hg2+ and (B) aggregated Th-AgNPs in the presence of 1 × 10⁻⁵ M Hg2+ ions. | ||
3.2. Effect of pH on the sensing system
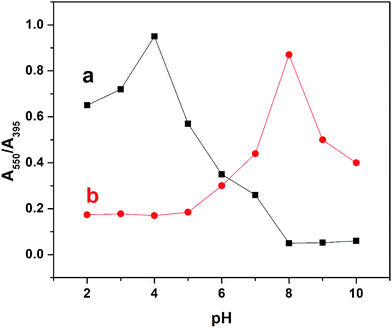
The effect of pH on the colorimetric detection of Hg2+ was examined in the range of 2–10 using UV-vis absorption spectrophotometry. Initially the pH of the functionalized nanoparticles was 8. For investigating the influence of pH on the sensing matrix, the pH was decreased by the addition of hydrochloric acid and increased by the addition of sodium hydroxide. In the absence of Hg2+, decreasing the pH from 8 to 2 led to a gradual increase in the absorption ratio (A550/A395) of the Th-AgNPs with the maximum value of this ratio at pH 4, as shown in Fig. 5.This maximum value indicates that the Th-AgNPs have aggregated themselves, which could be attributed to the strong inter-particle interaction via H-bonding between the protonated (–NH) and (–N) groups32,33 at the heterocyclic free end of the thiamine molecule on the AgNP surfaces. Additionally, with the increase of pH from 8 to 10, no obvious changes in A550/A395 can be observed. This could be mainly due to the de-protonation of (–NH) groups in the heterocyclic ring that may not cause aggregation of the nanoparticles via H-bonding. This result suggests that the colorimetric detection of Hg2+ could not be performed below pH 8, because the Th-AgNPs prefer self-aggregation. Subsequently, the A550/A395 change was evaluated in the presence of Hg2+ in the pH range from 8 to 2. As shown in Fig. 5, the highest A550/A395 ratio was obtained at pH 8, as no interparticle H-bonding could occur at this pH value. Upon further increase in the pH of the solution, the A550/A395 ratio gradually decreased possibly due to the formation of mercuric hydroxide. From this study, it can be concluded that there is no need to adjust the pH conditions below or above 8 for the colorimetric detection of Hg2+.
The reaction time of the assay was examined by measuring the A550/A395 ratio of the Th-AgNP solution after the addition of Hg2+. Fig. S2 (ESI†) shows that the A550/A395 ratio increases quickly up to 5 min and then attains a steady state after further increasing the reaction time from 5 to 15 min. This behavior suggests that the Th-AgNPs get aggregated immediately within 5 min after the addition of Hg2+, thus demonstrating a fast colorimetric response for the detection of Hg2+.
3.3. Sensitivity of the proposed system
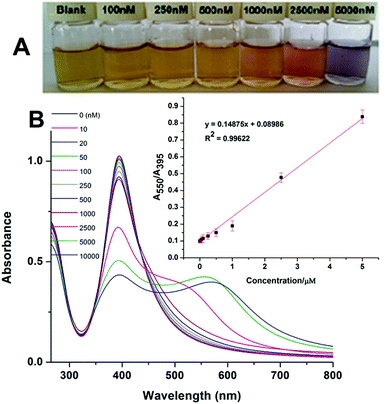
To test the colorimetric detection of Hg2+, different amounts of Hg2+ were added into the solution containing Th-AgNPs and then examined after 5 min of mixing. Fig. 6 shows that with the increase of Hg2+ concentrations ranging from 10 to 10![[thin space (1/6-em)]](https://www.rsc.org/images/entities/char_2009.gif) 000 nM, the absorption band at 395 nm decreases gradually while at the same time the bands at a longer wavelength (550 nm) undergo red shift.
000 nM, the absorption band at 395 nm decreases gradually while at the same time the bands at a longer wavelength (550 nm) undergo red shift.
Similarly, along with the spectral changes, progressive color variations from yellow to red and to violet-blue were also observed, as shown in Fig. 6. The color changes could be easily recognized by the naked eye when the concentration is over 100 nm. Based on the spectral changes (A550/A395), a calibration plot was constructed between the absorption ratio (A550/A395) and concentration of Hg2+, as shown in the inset of Fig. 6. The plot is nicely linear in the concentration range from 10 to 5000 nM, with a good linear correlation coefficient (R2) of 0.9962. The limit of detection (LOD) was found to be 5 nM using the equation 3σ/slope. Thus, the proposed sensor exhibits good sensitivity with a broad linear range and a lower detection limit as compared to most of the previously reported colorimetric methods34–45 for the detection of Hg2+. The sensitivity of some recent colorimetric methods is shown in Table 1.
| Colorimetric detection system | Linear range (nM) | LOD (nM) | Ref. |
|---|---|---|---|
| Mercaptophenyl boronic acid functionalized-AuNPs | 80–1250 | 37 | 34 |
| Green synthesized AgNPs | 50–500![[thin space (1/6-em)]](https://www.rsc.org/images/entities/char_2009.gif) 000 000 |
— | 35 |
| Multi-sulfhydryl hyperbranched polyethylenimine functionalized-AuNPs | 8.76–127![[thin space (1/6-em)]](https://www.rsc.org/images/entities/char_2009.gif) 000 000 |
8.76 | 36 |
| Cytosine triphosphate-capped AgNPs | 625–5000 | 125 | 37 |
| Cysteine-modified Au–Ag core–shell nanorods | 1000–60![[thin space (1/6-em)]](https://www.rsc.org/images/entities/char_2009.gif) 000 000 |
273 | 38 |
| Heteroepitaxially synthesized unmodified-AgNPs | 100–10![[thin space (1/6-em)]](https://www.rsc.org/images/entities/char_2009.gif) 000 000![[thin space (1/6-em)]](https://www.rsc.org/images/entities/char_2009.gif) 000 000 |
100 | 39 |
| Unmodified-AuNPs | 50–300 | 15 | 40 |
| AuNPs formed by H2O2 reduction of HAuCl4 | 0.1–10![[thin space (1/6-em)]](https://www.rsc.org/images/entities/char_2009.gif) 000 000 |
0.0089 | 41 |
| Glutamine and histidine functionalized AgNPs | 1000–5![[thin space (1/6-em)]](https://www.rsc.org/images/entities/char_2009.gif) 00 00![[thin space (1/6-em)]](https://www.rsc.org/images/entities/char_2009.gif) 000 000 |
900 | 42 |
| Biosynthesized AuNPs | 1000–20![[thin space (1/6-em)]](https://www.rsc.org/images/entities/char_2009.gif) 000 000 |
1440 | 43 |
| Carrageenan-functionalized Ag/AgCl NPs | 1000–1![[thin space (1/6-em)]](https://www.rsc.org/images/entities/char_2009.gif) 00 00![[thin space (1/6-em)]](https://www.rsc.org/images/entities/char_2009.gif) 000 000 |
1000 | 44 |
| Bimetallic Ag–Cu nanoparticles | 1–10 | 0.51 | 45 |
| Thiamine functionalized-AgNPs | 10–5000 | 5 | This work |
3.4. Selectivity of the method
To explore the selectivity of Th-AgNPs towards Hg2+, we tested their colorimetric response in the presence of different potential interfering metal ions including Zn2+, Pb2+, Ni2+, Fe2+, Fe3+, Cr3+, Cu2+, Mn2+, Co2+, Al3+, Cd2+, Ca2+ and Mg2+. The color and the spectral changes of the Th-AgNPs upon the addition of various interfering metal ions are presented in Fig. S3 (ESI†).No obvious color change was observed after the addition of different metal ions except Hg2+, as can be seen from the photo images shown in Fig. S3(A and C) (ESI†). Similarly, no noticeable change can be observed in the UV-vis absorption spectra of the Th-AgNPs in the presence of various metal ions (see the inset of Fig. S3(B and C), ESI†). Based on the UV-vis spectral changes obtained for various metal ions, the A550/A395 ratio was calculated to be: 0.823, 0.023, 0.0392, 0.01, 0.017, 0.017, −0.0104, 0.1, 0.02, −0.063, 0.065, 0.08, 0.05, and 0.069 for Hg2+, Zn2+, Pb2+, Ni2+, Fe2+, Fe3+, Cr3+, Cu2+, Mn2+, Co2+, Al3+, Ca2+, Cd2+ and Mg2+, respectively. This study reveals that the developed sensor has excellent recognition ability towards Hg2+ ions even in the presence of other metal ions. Thus, the high selectivity of the sensor is apparent. Furthermore, we probed the effects of NaCl on the stability of the Th-AgNPs. As the observation of Fig. S4 (ESI†) reveals, there is no significant effect on the absorption signal of the Th-AgNPs in the presence of 0.005 M and 0.025 M concentrations of NaCl. This result indicates that the Th-AgNPs are highly stable in saline conditions, and thus, the sensor is suitable for the detection of Hg2+, even at relatively high concentrations of NaCl.
3.5. Application to real water samples
The reliability of the method was tested by spiking different known concentrations of Hg2+ into solutions containing Th-AgNPs and river water. The absorption spectrum of each spiked sample was recorded after 5 min, as represented in Fig. S5 (ESI†). The results obtained are shown in Table 2. The percentage recovery in the range from 96.2 to 107.5% suggests that the Th-AgNP probe has the potential to practically determine Hg2+ in real water samples.| Sample | Added (μM) | Found (n = 3) (μM) | Recovery (%) |
|---|---|---|---|
| River water | 0.00 | — | Not detected |
| 0.02 | 0.021 | 105.0 | |
| 3.30 | 3.500 | 107.5 | |
| 5.00 | 4.810 | 96.2 |
4. Conclusions
A highly selective and sensitive colorimetric method was successfully developed for the detection of Hg2+ ions using thiamine-functionalized AgNPs. The Th-AgNPs displayed a visible color change from yellow to red or violet-blue accompanied by a distinct spectral change. The presence of thiamine molecules on the surface of the AgNPs provided suitable functionalities that recognized Hg2+ ions using N–Hg2+–N coordination chemistry. The proposed sensing system demonstrated high selectivity for Hg2+ ions in the presence of various competing metal ions. The designed sensor utilizes a cost-effective, greener and easily available ligand compared to DNA or other ligands which could be obtained from difficult synthetic processes. Moreover, the sensor provides high sensitivity and selectivity requirements. Good percentage recoveries obtained from the practical analysis of Hg2+ ions in river water confirmed that the designed sensing method could be easily implemented for the routine analysis of Hg2+ ions.Conflicts of interest
There are no conflicts to declare.Acknowledgements
Financial support from the Quaid-i-Azam University and Higher Education Commission of Pakistan is gratefully acknowledged.References
- T. W. Clarkson, Crit. Rev. Clin. Lab. Sci., 1997, 34, 369–403 CrossRef CAS PubMed.
- L. R. Goldman, M. W. Shannon and C. o. E. Health, Pediatrics, 2001, 108, 197–205 CrossRef CAS PubMed.
- R. A. Bernhoft, J. Environ. Public Health, 2011, 2012 Search PubMed.
- P. Holmes, K. James and L. Levy, Sci. Total Environ., 2009, 408, 171–182 CrossRef CAS PubMed.
- E. M. Nolan and S. J. Lippard, Chem. Rev., 2008, 108, 3443–3480 CrossRef CAS PubMed.
- T. W. Clarkson, L. Magos and G. J. Myers, N. Engl. J. Med., 2003, 349, 1731–1737 CrossRef CAS PubMed.
- K. Rurack and U. Resch-Genger, Chem. Soc. Rev., 2002, 31, 116–127 RSC.
- S. Homma-Takeda, M. Shinyashiki, Y. Kumagai and N. Shimojo, J. Occup. Health, 1996, 38, 118–119 CrossRef CAS.
- D. Martín-Yerga, M. B. González-García and A. Costa-García, Talanta, 2013, 116, 1091–1104 CrossRef PubMed.
- H. Kodamatani, A. Matsuyama, K. Saito, K. Yuriko, R. Kanzaki and T. Tomiyasu, Anal. Sci., 2012, 28, 959–965 CrossRef CAS PubMed.
- W. Lu, X. Qin, S. Liu, G. Chang, Y. Zhang, Y. Luo, A. M. Asiri, A. O. Al-Youbi and X. Sun, Anal. Chem., 2012, 84, 5351–5357 CrossRef CAS PubMed.
- L. R. Bravo-Sánchez, B. S. V. de la Riva, J. M. Costa-Fernández, R. Pereiro and A. Sanz-Medel, Talanta, 2001, 55, 1071–1078 CrossRef.
- G. Leng, L. Feng, S. B. Li, S. Qian and D. Z. Dan, Environ. Forensics, 2013, 14, 9–15 CrossRef CAS.
- M. Legrand, R. Lam, M. Jensen-Fontaine, E. D. Salin and H. M. Chan, J. Anal. At. Spectrom., 2004, 19, 1287–1288 RSC.
- J. Duan and J. Zhan, Sci. China Mater., 2015, 58, 223–240 CrossRef CAS.
- D. Vilela, M. C. González and A. Escarpa, Anal. Chim. Acta, 2012, 751, 24–43 CrossRef CAS PubMed.
- Z. Yan, M. F. Yuen, L. Hu, P. Sun and C. S. Lee, RSC Adv., 2014, 4, 48373–48388 RSC.
- R. El-Dessouky, M. Georges and H. Azzazy, Functional Nanoparticles for Bioanalysis, Nanomedicine, and Bioelectronic Devices, 2012 Search PubMed.
- Y. R. Kim, R. K. Mahajan, J. S. Kim and H. Kim, ACS Appl. Mater. Interfaces, 2009, 2, 292–295 Search PubMed.
- Y. Kim, R. C. Johnson and J. T. Hupp, Nano Lett., 2001, 1, 165–167 CrossRef CAS.
- C. C. Huang and H. T. Chang, Chem. Commun., 2007, 1215–1217 RSC.
- D. Su, X. Yang, Q. Xia, F. Chai, C. Wang and F. Qu, RSC Adv., 2013, 3, 24618–24624 RSC.
- F. Chai, C. Wang, T. Wang, Z. Ma and Z. Su, Nanotechnology, 2009, 21, 025501 CrossRef PubMed.
- J. M. Slocik, J. S. Zabinski, D. M. Phillips and R. R. Naik, Small, 2008, 4, 548–551 CrossRef CAS PubMed.
- J. Xie, Y. Zheng and J. Y. Ying, Chem. Commun., 2010, 46, 961–963 RSC.
- D. Liu, W. Qu, W. Chen, W. Zhang, Z. Wang and X. Jiang, Anal. Chem., 2010, 82, 9606–9610 CrossRef CAS PubMed.
- J. S. Lee, M. S. Han and C. A. Mirkin, Angew. Chem., Int. Ed., 2007, 46, 4093–4096 CrossRef CAS PubMed.
- Y. Miyake, H. Togashi, M. Tashiro, H. Yamaguchi, S. Oda, M. Kudo, Y. Tanaka, Y. Kondo, R. Sawa and T. Fujimoto, J. Am. Chem. Soc., 2006, 128, 2172–2173 CrossRef CAS PubMed.
- L. Chen, T. Lou, C. Yu, Q. Kang and L. Chen, Analyst, 2011, 136, 4770–4773 RSC.
- J. Duan, H. Yin, R. Wei and W. Wang, Biosens. Bioelectron., 2014, 57, 139–142 CrossRef CAS PubMed.
- T. Lou, L. Chen, C. Zhang, Q. Kang, H. You, D. Shen and L. Chen, Anal. Methods, 2012, 4, 488–491 RSC.
- G. L. Wang, X. Y. Zhu, H. J. Jiao, Y. M. Dong and Z. J. Li, Biosens. Bioelectron., 2012, 31, 337–342 CrossRef CAS PubMed.
- J. Du, Z. Wang, X. Peng and J. Fan, Ind. Eng. Chem. Res., 2015, 54, 12011–12016 CrossRef CAS.
- Y. Kong, J. Shen and A. Fan, Anal. Sci., 2017, 33, 925–930 CrossRef CAS PubMed.
- V. Kumar, D. K. Singh, S. Mohan, D. Bano, R. K. Gundampati and S. H. Hasan, J. Photochem. Photobiol., B, 2017, 168, 67–77 CrossRef CAS PubMed.
- Y. Liu, Y. Liu, L. Xu, J. Li, X. Liu, J. Liu and G. Li, Sens. Actuators, B, 2017, 249, 331–338 CrossRef CAS.
- L. Zhan, T. Yang, S. J. Zhen and C. Z. Huang, Microchim. Acta, 2017, 184, 3171–3178 CrossRef CAS.
- J. Zhu, B. Z. Zhao, Y. Qi, J. J. Li, X. Li and J. W. Zhao, Sens. Actuators, B, 2018, 255, 2927–2935 CrossRef CAS.
- A. Nain, S. R. Barman, S. Jain, A. Mukherjee and J. Satija, Appl. Nanosci., 2017, 7, 299–307 CrossRef CAS.
- A. G. Memon, X. Zhou, J. Liu, R. Wang, L. Liu, B. Yu, M. He and H. Shi, J. Hazard. Mater., 2017, 321, 417–423 CrossRef CAS PubMed.
- Y. Zhou and Z. Ma, Sens. Actuators, B, 2017, 241, 1063–1068 CrossRef CAS.
- P. Buduru, B. C. Sundher, R. Reddy and N. V. S. Naidu, Sens. Actuators, B, 2017, 244, 972–982 CrossRef CAS.
- N. Zohora, D. Kumar, M. Yazdani, V. M. Rotello, R. Ramanathan and V. Bansal, Colloids Surf., A, 2017, 532, 451–457 CrossRef CAS.
- K. B. Narayanan and S. S. Han, Carbohydr. Polym., 2017, 160, 90–96 CrossRef CAS PubMed.
- S. Li, T. Wei, M. Tang, F. Chai, F. Qu and C. Wang, Sens. Actuators, B, 2018, 255, 1471–1481 CrossRef CAS.
Footnote |
| † Electronic supplementary information (ESI) available. See DOI: 10.1039/c7nj03382f |
| This journal is © The Royal Society of Chemistry and the Centre National de la Recherche Scientifique 2018 |

