 Open Access Article
Creative Commons Attribution 3.0 Unported Licence
The porogen effect on the complexation step of trinitrotoluene–methacrylic acid: towards efficient imprinted polymer sensors†
Luke Bird and
Carmelo Herdes *
*
Department of Chemical Engineering, University of Bath, Claverton Down, Bath, Somerset BA2 7AY, UK. E-mail: c.e.herdes.moreno@bath.ac.uk
First published on 13th October 2017
Abstract
The development of sensors capable of efficient 2,4,6-trinitrotoluene detection is evolving into an important research field due to mounting threats to public safety. Molecularly imprinted polymers are receiving intensifying attention as potential recognition elements. Currently, there is limited understanding as to how the solvent impacts the crucial complexation stage in imprinted polymer production. Here, we investigate whether solvent interactions during the complexation stage should be considered in the optimal design of such sensors. The approach adopted uses molecular dynamics to simulate the interactions between all relevant molecules in the pre-polymerization mixture with different porogenic solvents: pure acetonitrile, dimethyl sulfoxide, water, and binary mixtures at different compositions of the former two. Molecular dynamics provides an excellent opportunity to gain an accurate insight into the behaviour of the porogen molecules with the target molecule and functional monomers. The results showed conclusive evidence towards solvent interactions impacting the complex's quality in the studied system. A porogen mixture, acetonitrile![[thin space (1/6-em)]](https://www.rsc.org/images/entities/char_2009.gif) :
:![[thin space (1/6-em)]](https://www.rsc.org/images/entities/char_2009.gif) dimethyl sulfoxide, of 75
dimethyl sulfoxide, of 75![[thin space (1/6-em)]](https://www.rsc.org/images/entities/char_2009.gif) :
:![[thin space (1/6-em)]](https://www.rsc.org/images/entities/char_2009.gif) 25 molar ratio is suggested for optimal trinitrotoluene and methacrylic acid complexation.
25 molar ratio is suggested for optimal trinitrotoluene and methacrylic acid complexation.
Design, System, ApplicationMolecularly imprinted polymers (MIPs) can be designed as a recognition element for a target molecule on a given sensor, promising to advance substantially the detection level. However, it is vital to understand how the different components in the MIP's pre-polymerization mixture interact. Here, we bring to the design table information about the impact of various solvents on the crucial complexation stage of these systems, via a molecular dynamics approach. A comprehensive critical appraisal of the current TNT detection techniques using MIPs set the case study. We predicted that an optimal complexation stage could be obtained by manipulating the solvent composition for this application. Additionally, the presented methodology could be easily customized for the study of other MIP systems. |
Introduction
2,4,6-Trinitrotoluene (TNT) is a widely used explosive and an environmentally damaging toxic substance, arousing great concern for public safety and health. TNT is a preferred explosive due to its insensitivity to shock and friction; however, for those very same handy reasons, it poses a threat through potential terrorist activity. Currently, due to its widespread military use in the first and second World Wars, TNT contaminates vast areas of soil and groundwater on a global scale. Through the 20th century, there were more than 17![[thin space (1/6-em)]](https://www.rsc.org/images/entities/char_2009.gif) 000 documented cases of TNT poisoning resulting in over 475 fatalities.1 The need for effective TNT detection is unmistakable and the required recognition technology must be able to function quickly at on-site testing (e.g. crowded public venues and/or remote countryside locations).
000 documented cases of TNT poisoning resulting in over 475 fatalities.1 The need for effective TNT detection is unmistakable and the required recognition technology must be able to function quickly at on-site testing (e.g. crowded public venues and/or remote countryside locations).
Gas chromatography is the usual technique used for TNT detection, but it is not suitable for on-site recognition due to its poor specificity and long testing cycles. Spectroscopic techniques such as fluorescence, infrared and luminescence, as well as immunochemistry and electrochemistry have been used as alternative methods for TNT identification.2 None of these technologies provide the sensitivity or the speed of detection required. This poses a challenge for design and engineering in its key role within public health and safety.
Employing coatings made of molecularly imprinted polymers (MIPs) is a way to increase both the sensitivity and the detection speed of existing sensors.3–6 Ideally, MIPs operate identically to biological sensors, exhibiting the same selective characteristics. Additionally, as polymeric man-made receptors,7 MIPs provide essential advantages over biosensors such as low cost, high stability, and reusability.
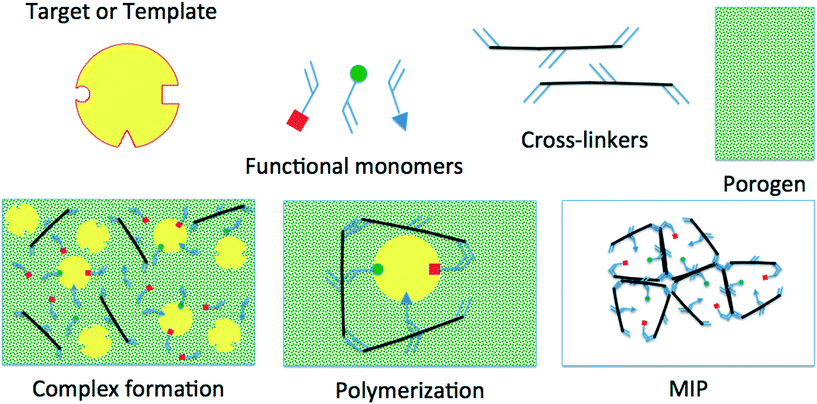
Imprinting (shown in Fig. 1) is the process of using a template or target molecule (TM) and functional and cross-linking monomers (FMs and CLs) to produce a porous material containing cavities with preferential binding for the TM. The polymerization is carried out in a porogenic solvent (SOL) and an initiator could also be required depending on the selected polymerization route.7
After the polymerization, the TM and the SOL are washed out; what remains is a polymeric porous network with accessible cavities exhibiting preferential selectivity towards the TM used during its synthesis; however, and very frequently, it also shows affinity to other molecules similar to the TM. To design sites with 100% selectivity towards an individual compound, enzyme-like selectivity and rational understanding of the different stages of the process must be gained.8–16
Combining MIPs (as the enhancing recognition element) with surface plasmon resonance (SPR) has shown potential for quick TNT on-site detection.2,17 An SPR sensor reads changes in the local surface environment and converts them into an observable optical signal. SPR sensors are very sensitive and therefore can be used to characterise molecular interactions occurring at surfaces. Commonly, SPR detection of small molecules involves reactions to produce molecules that are large enough to gain observable signals. The MIP is designed to interact with TNT, pulling the molecule close to the SPR sensor, which then provides an optical response allowing for identification of the molecule. TNT detection was observed at limits as low as 10−8 mol L−1, which is at a comparable level to that of electrochemical sensors.2 Overcoming the need for reactions, a detection limit of 50 μM has been attained,18 which is in the order of 103 times greater than the lower detection limit previously achieved.2 The differences in the detection limits in these works2,17,18 are attributed to the differences in the MIP preparations.
Voltammetric-MIP sensors for TNT detection have shown high sensitivity and moderate selectivity, via chemically modified electrodes.19 These sensors were capable of observing TNT at limits as low as 1.5 × 10⁻⁹ mol L−1.19 Electrochemical biosensors are an option that provides high selectivity but are expensive and exhibit poor stability.
Integration of surface-enhanced Raman scattering (SERS) with MIPs and xerogels for TNT detection has also been suggested,20 but so far with limited selectivity. The xerogel matrix includes 3-aminopropyltriethoxysilane, which acts as the FM, forming strong bonds with the electron-deficient ring of the TNT molecule. The xerogel–MIPs were deposited on the SERS-active surface so that the recognition sites would concentrate TNT, enhancing its specific molecular fingerprint. The sensor successfully responded to TNT at levels as low as 3 μM while showing good stability and a selectivity factor of 1.63 for TNT to 2,4-dinitrotoluene (DNT).20 Selectivity is an important characteristic of detection systems, and imprinted polyvinyl alcohol microspheres have been synthesised to produce an exceptional selectivity coefficient of 12.44, relative to 2,4-DNT.21
Another technique worth mentioning, which offers the capability for TNT detection, is the combination of MIPs and metal organic frameworks (MOFs). MOFs are metal complexes with organic linkers and can exist in one-, two- or three-dimensional structures. One of the MIP–MOFs that have recently drawn attention is based on bisaniline-crosslinked gold nanoparticles (AuNPs). AuNPs can be functionalised with p-aminothiophenol and then electro-polymerised in the presence of the TM. The template can then be extracted, leaving recognition sites. MIP–MOFs can be combined with an electrochemical sensor as well as with optical and mass transducers.5
Importance of the porogen in the complexation stage
In MIP production, the reactants are initially blended in the so-called pre-polymerization mixture. Our main focus is the crucial TM–FM complexation step at this first stage. In the second stage, the polymerization itself consists of three further steps: initiation, propagation and termination. The details of this process are not discussed here as it is beyond the scope of this study; clear and comprehensive details for each component at all stages of MIP synthesis are given somewhere else;22 however, a few remarks follow. The current consensus on the role of the SOL is that it generates a homogeneous system to facilitate the complexation stage and controls the porosity of the MIP.7,22 SOLs are currently selected based on their impacts on the morphology and total volume of the polymer. A good SOL is viewed as producing a polymer with a well-developed pore structure and a high surface area. The FM serves to interact with the TM, producing a complex prior to the polymerization of the MIP. These TM–FM interactions are fundamental to the selectivity of the MIP and often form the basis of FM selection;22–25 however, the influence of the SOL in the complexation stage of TNT–MIP is yet to be researched in depth.A previous computational study specifically investigated TNT–FM interactions, based on ab initio density functional theory calculations providing information on a single-site.26
Here, the TM–SOL and FM–SOL interactions in the pre-polymerization mixture will be investigated to further our understanding of the factors affecting the production of a TNT–MIP sensor. Improving the prediction of the quality of the complexation stage will advance the selectivity of such an MIP, further refining its recognition ability. Molecular dynamics (MD) is used to simulate the complexation of TNT (the TM) with methacrylic acid (MAA, the FM) in three different pure solvents, water, acetonitrile (ACN), and dimethyl sulfoxide (DMSO), and binary mixtures of ACN and DMSO. Since the complexation relies on TNT and MAA interaction, the TNT–SOL and MAA–SOL interactions will significantly screen this complexation. Analysis including radial distribution functions (RDFs, g(r)), Kirkwood–Buff integrals (KBI) and cluster size will be used to study the simulation results. Systems with water as solvent express relevance towards TNT–MIP for aqueous applications, rather than the synthesis of the polymers in water.
A g(r) is defined as the ratio between the average number density at any given distance, r, from any atom and the density at the same distance, r, from an atom in an ideal gas, with the same overall density. By definition g(r) = 1 for an ideal gas, for all r. Any change in this value is due to intermolecular interactions since the ideal gas theory states that interactions are negligible.27
The Kirkwood–Buff solution theory28 relates molecular interactions to macroscopic properties. This theory describes structural thermodynamics over the complete range of compositions for solvents using RDFs. The KBI (eqn (1)) can be related to many physical properties, including the interaction/binding energies of atoms.28 The KBI represents the volume per number of atoms and allows a quantitative comparison between the RDFs for the various interactions and is therefore deemed a satisfactory analysis tool.
 | (1) |
Eqn (1) shows the relationship between the KBI and RDF where r is the distance, between the atoms i and j in an open system, which can be approximated and applied to closed systems with R being the cut-off distance.
Computational methodology
Here, a general strategy implemented for the simulation of MIPs is followed,8 only mimicking the pre-polymerization stage of the synthesis. In this particular case and in order to capture the solvent effect on the complexation step, we manipulated the composition of commonly used porogens in MIP synthesis.Molecular models
For this work, TNT, MAA, ACN and DMSO were modelled with a common force field, specifically OPLS-AA (optimised parameters for liquid simulations, all atoms).29 For the molecular description of water molecules, the SPC/E force field was chosen.30 It has been shown that OPLS-AA force field partial charges for nitro functional groups are too large, leading to over-predictions of thermodynamic properties (e.g. densities, hydration free energies, etc.).31–33 Hence, the TNT density charge distribution at atom level definition was calculated. The preliminary geometry optimizations were run at the PM3 level of theory using the Arguslab software. Partial charges, bond lengths and angles were optimized at the DFT/R-B3LYP/6-311G** level of theory. The geometry convergence tolerance was set to 10−6 Hartree and the SCF convergence at 10−7, and a vibrational (force matrix) analysis was performed in order to ensure that the obtained geometries rest at the minimum of the potential energy surface. All calculations were run with the GAMESS-US package. The charge distributions along with the force field parameters for all species are given in the ESI.†Simulation details
MD simulations were performed under the NVT and NpT ensembles for i) the pure porogens, ii) binary mixtures of TNT and MAA,‡ iii) ternary systems involving TNT![[thin space (1/6-em)]](https://www.rsc.org/images/entities/char_2009.gif) :
:![[thin space (1/6-em)]](https://www.rsc.org/images/entities/char_2009.gif) MAA
MAA![[thin space (1/6-em)]](https://www.rsc.org/images/entities/char_2009.gif) :
:![[thin space (1/6-em)]](https://www.rsc.org/images/entities/char_2009.gif) SOL, and iv) quaternary systems with TNT
SOL, and iv) quaternary systems with TNT![[thin space (1/6-em)]](https://www.rsc.org/images/entities/char_2009.gif) :
:![[thin space (1/6-em)]](https://www.rsc.org/images/entities/char_2009.gif) MAA
MAA![[thin space (1/6-em)]](https://www.rsc.org/images/entities/char_2009.gif) :
:![[thin space (1/6-em)]](https://www.rsc.org/images/entities/char_2009.gif) ACN
ACN![[thin space (1/6-em)]](https://www.rsc.org/images/entities/char_2009.gif) :
:![[thin space (1/6-em)]](https://www.rsc.org/images/entities/char_2009.gif) DMSO; all under common laboratory conditions, 1 atm and 298.15 K, unless specified otherwise. Pressure and temperature were maintained via a Berendsen barostat and thermostat, respectively. The number of molecules in pure systems was set to 300. The TNT
DMSO; all under common laboratory conditions, 1 atm and 298.15 K, unless specified otherwise. Pressure and temperature were maintained via a Berendsen barostat and thermostat, respectively. The number of molecules in pure systems was set to 300. The TNT![[thin space (1/6-em)]](https://www.rsc.org/images/entities/char_2009.gif) :
:![[thin space (1/6-em)]](https://www.rsc.org/images/entities/char_2009.gif) MAA equimolar binary mixture was simulated using 600 molecules. For the ternary mixtures, 50 TNT molecules were used along with 300 MAA and 300 porogen molecules. In the quaternary systems, the same TM
MAA equimolar binary mixture was simulated using 600 molecules. For the ternary mixtures, 50 TNT molecules were used along with 300 MAA and 300 porogen molecules. In the quaternary systems, the same TM![[thin space (1/6-em)]](https://www.rsc.org/images/entities/char_2009.gif) :
:![[thin space (1/6-em)]](https://www.rsc.org/images/entities/char_2009.gif) FM ratio was kept within ACN
FM ratio was kept within ACN![[thin space (1/6-em)]](https://www.rsc.org/images/entities/char_2009.gif) :
:![[thin space (1/6-em)]](https://www.rsc.org/images/entities/char_2009.gif) DMSO binary molar compositions of 25
DMSO binary molar compositions of 25![[thin space (1/6-em)]](https://www.rsc.org/images/entities/char_2009.gif) :
:![[thin space (1/6-em)]](https://www.rsc.org/images/entities/char_2009.gif) 75, 50
75, 50![[thin space (1/6-em)]](https://www.rsc.org/images/entities/char_2009.gif) :
:![[thin space (1/6-em)]](https://www.rsc.org/images/entities/char_2009.gif) 50 and 75
50 and 75![[thin space (1/6-em)]](https://www.rsc.org/images/entities/char_2009.gif) :
:![[thin space (1/6-em)]](https://www.rsc.org/images/entities/char_2009.gif) 25. All the MD simulations were carried out using GROMACS v5.1.34 Periodic boundary conditions were applied to the simulation cells. A simple cutoff radius corresponding to 1.2 nm was applied. Long-range interactions were calculated by the standard PME method. The SHAKE algorithm was employed to constrain the molecular bonds. The time resolution of the equations of motion was set to 2 fs. The different systems were monitored until the relevant properties (e.g. density, total energy, etc.) attained equilibrium (this part of the MD trajectory was discarded). Afterwards, production runs were extended to 10 ns for the reported averages.
25. All the MD simulations were carried out using GROMACS v5.1.34 Periodic boundary conditions were applied to the simulation cells. A simple cutoff radius corresponding to 1.2 nm was applied. Long-range interactions were calculated by the standard PME method. The SHAKE algorithm was employed to constrain the molecular bonds. The time resolution of the equations of motion was set to 2 fs. The different systems were monitored until the relevant properties (e.g. density, total energy, etc.) attained equilibrium (this part of the MD trajectory was discarded). Afterwards, production runs were extended to 10 ns for the reported averages.
Results and discussion
Pure porogen sanity checks
Density, self-diffusion coefficient and RDF calculations were performed for each pure solvent. The comparison between simulated results and available experimental density values is shown in Table 1. All models presented good agreement with the experimental density values, with absolute errors below 5%.| Porogen | Sim. density [kg m−3] | Exp. density [kg m−3] | Error [%] |
|---|---|---|---|
| Experimental densities obtained from the NIST webbook.35 | |||
| Water | 990.04 | 997.05 | −0.703 |
| ACN | 743.96 | 776.60 | −4.20 |
| DMSO | 1147.7 | 1095.4 | +4.77 |
Self-diffusion coefficients were calculated from the mean square displacement (msd) of the pure solvent molecules, using the post-processing function g_msd in Gromacs;34 the predictions are shown in Table 2. Good agreement is found between the predicted and experimental values for ACN and water. The error for DMSO is magnified by its low diffusivity; its absolute error is only 0.171 × 10⁻⁹ m2 s−1, compared to 0.202 × 10⁻⁹ m2 s−1 for ACN. Therefore, the DMSO model is far more accurate than indicated by the calculated percentage error. It is worth noticing that an available united atom model for DMSO36 reported a diffusivity coefficient of 1.1 × 10⁻⁹ m2 s−1 (+37.5% error), significantly less accurate than the one calculated here via the selected all-atom model.
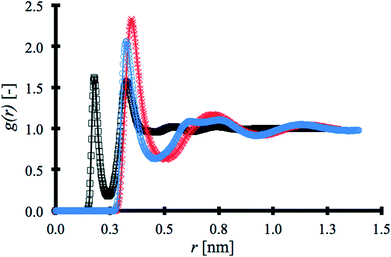
RDFs for each solvent were obtained using the post-processing function gmx rdf in Gromacs34 and are shown in Fig. 2. The first coordination shell produced by water, at 0.176 nm, is at a significantly shorter distance than the other solvents.
The second coordination shell for water appears at a shorter distance, 0.324 nm, than the first coordination shell for ACN at 0.4 nm and about the same distance as that of the first coordination shell for DMSO, but in both cases with lower intensity than the other solvents. This is due to water being the smallest porogen and exhibiting strong intermolecular interaction via hydrogen bonding. Fig. 2 is constructed with the strongest atom–atom pair interaction within each solvent molecule, i.e. hydrogen–oxygen in the water molecule, methyl carbon–nitrogen in ACN and, oxygen–carbon in DMSO. RDF results are in excellent agreement with previous studies.40–42 Overall, the unique force field selected to model the porogens has been shown to reproduce experimental and other simulated results accurately.
TNT, MAA and porogen interactions
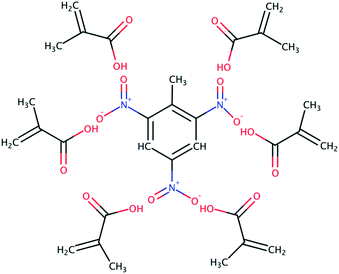
Carboxylic acids have been the preferred functional monomer for TNT–MIP production.2,17–21,26,43,44Here, understanding how the porogen interacts with TNT and MAA is crucial to calculate the quality of the TNT–MAA complex and ultimately predict the TNT–MIP rebinding capabilities. An ideal TNT–MAA complex structure can be seen in Fig. 3.
However, short carboxylic acids exhibit a remarkable tendency to aggregate.29 Hence, a prime structure such as the one in Fig. 3 will only be attained in the presence of an optimal porogen, which disrupts the tendency of MAA to form clusters while promoting the TNT–MAA interactions.
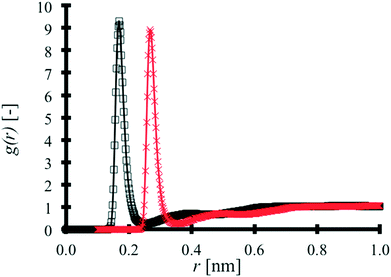
MAA–MAA RDFs are produced for binary TNT![[thin space (1/6-em)]](https://www.rsc.org/images/entities/char_2009.gif) :
:![[thin space (1/6-em)]](https://www.rsc.org/images/entities/char_2009.gif) MAA and pure MAA systems as shown in Fig. 4.
MAA and pure MAA systems as shown in Fig. 4.
In Fig. 4, the pure MAA RDF has been shifted by 0.1 nm for the sake of clarity. The influence of the TNT molecules in the binary mixture on the MAA–MAA interaction peak is negligible. The results of a cluster size analysis in both systems are found in Table 3.
| System | Maximum cluster size [—] | Average cluster size [—] |
|---|---|---|
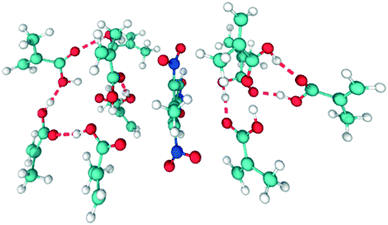
| The cluster size represents the number of MAA atoms in a cut off distance of 0.35 nm, deemed appropriate based on the interaction distances seen in Fig. 2 and 4. The maximum cluster size suggests that the largest MAA aggregate includes more than two molecules. The average cluster size is 4.51 for pure MAA. The cluster analysis of the binary system reinforces the point that the desired TNT–MAA interaction is not achieved in the binary system. An MD snapshot in Fig. 5 better illustrates this behaviour. | ||
| Pure MAA | 28 | 4.51 |
| Binary TNT/MAA | 26 | 4.41 |
Disruptive porogen influence
The computational task ahead is to find out whether and how different solvents would disrupt the tendency of MAA to form aggregates while maximizing the probability for TNT–MAA complexation in the pre-polymerization mixture. Table 4 summarizes the calculated KBI values for the TNT–MAA complex at different compositions for the binary porogen ACN![[thin space (1/6-em)]](https://www.rsc.org/images/entities/char_2009.gif) :
:![[thin space (1/6-em)]](https://www.rsc.org/images/entities/char_2009.gif) DMSO; the associated RDFs are not shown here for the sake of brevity but are available in the ESI† accompanying this work.
DMSO; the associated RDFs are not shown here for the sake of brevity but are available in the ESI† accompanying this work.
![[thin space (1/6-em)]](https://www.rsc.org/images/entities/char_2009.gif) :
:![[thin space (1/6-em)]](https://www.rsc.org/images/entities/char_2009.gif) DMSO
DMSO
ACN![[thin space (1/6-em)]](https://www.rsc.org/images/entities/char_2009.gif) : :![[thin space (1/6-em)]](https://www.rsc.org/images/entities/char_2009.gif) DMSO porogen composition DMSO porogen composition |
KBI [nm3] | RDF maximum |
|---|---|---|
| Details of KBI calculations can be found in the original work.28 | ||
0![[thin space (1/6-em)]](https://www.rsc.org/images/entities/char_2009.gif) : :![[thin space (1/6-em)]](https://www.rsc.org/images/entities/char_2009.gif) 100 100 |
0.0281 | 1.09 |
25![[thin space (1/6-em)]](https://www.rsc.org/images/entities/char_2009.gif) : :![[thin space (1/6-em)]](https://www.rsc.org/images/entities/char_2009.gif) 75 75 |
0.0184 | 1.10 |
50![[thin space (1/6-em)]](https://www.rsc.org/images/entities/char_2009.gif) : :![[thin space (1/6-em)]](https://www.rsc.org/images/entities/char_2009.gif) 50 50 |
0.0466 | 1.19 |
75![[thin space (1/6-em)]](https://www.rsc.org/images/entities/char_2009.gif) : :![[thin space (1/6-em)]](https://www.rsc.org/images/entities/char_2009.gif) 25 25 |
0.285 | 1.34 |
100![[thin space (1/6-em)]](https://www.rsc.org/images/entities/char_2009.gif) : :![[thin space (1/6-em)]](https://www.rsc.org/images/entities/char_2009.gif) 0 0 |
0.164 | 1.23 |
The average cluster size analysis around the MAA atoms on the above systems provides a more accurate representation of the MAA–MAA interactions, as can be seen in Table 5. The largest MAA clusters are formed in pure ACN hence it provides the least disruption. The cluster size decreases by 5.56% between pure ACN and the binary porogen with a molar composition of 75![[thin space (1/6-em)]](https://www.rsc.org/images/entities/char_2009.gif) :
:![[thin space (1/6-em)]](https://www.rsc.org/images/entities/char_2009.gif) 25. This decrease in MAA cluster size means that there are more available MAA molecules that can interact with the TNT molecules.
25. This decrease in MAA cluster size means that there are more available MAA molecules that can interact with the TNT molecules.
![[thin space (1/6-em)]](https://www.rsc.org/images/entities/char_2009.gif) :
:![[thin space (1/6-em)]](https://www.rsc.org/images/entities/char_2009.gif) DMSO
DMSO
ACN![[thin space (1/6-em)]](https://www.rsc.org/images/entities/char_2009.gif) : :![[thin space (1/6-em)]](https://www.rsc.org/images/entities/char_2009.gif) DMSO porogen composition DMSO porogen composition |
Average cluster size | Maximum cluster size |
|---|---|---|
0![[thin space (1/6-em)]](https://www.rsc.org/images/entities/char_2009.gif) : :![[thin space (1/6-em)]](https://www.rsc.org/images/entities/char_2009.gif) 100 100 |
2.19 | 7 |
25![[thin space (1/6-em)]](https://www.rsc.org/images/entities/char_2009.gif) : :![[thin space (1/6-em)]](https://www.rsc.org/images/entities/char_2009.gif) 75 75 |
2.20 | 7 |
50![[thin space (1/6-em)]](https://www.rsc.org/images/entities/char_2009.gif) : :![[thin space (1/6-em)]](https://www.rsc.org/images/entities/char_2009.gif) 50 50 |
2.28 | 10 |
75![[thin space (1/6-em)]](https://www.rsc.org/images/entities/char_2009.gif) : :![[thin space (1/6-em)]](https://www.rsc.org/images/entities/char_2009.gif) 25 25 |
2.38 | 10 |
100![[thin space (1/6-em)]](https://www.rsc.org/images/entities/char_2009.gif) : :![[thin space (1/6-em)]](https://www.rsc.org/images/entities/char_2009.gif) 0 0 |
2.52 | 13 |
TNT–MAA water influence
The interactions between water and MAA (FM) are relevant to the functionality of TNT–MIP in ground water TNT detection.An analogous RDF, KBI and cluster size analysis was performed on this ternary system. A considerable drop in MAA aggregation was found, due to hydrogen bonding. The MAA–MAA RDF intensity halved to 5.30, with respect to the pure MAA system. Likewise, the KBI decreased from 0.090 nm3 to 0.040 nm3. The maximum MAA cluster size decreased from 26 atoms to 16 atoms when water was added; meanwhile, the average cluster size decreased to 3.21. These results indicate that the MIP-based TNT detection sensitivity in water could be significantly reduced because of multiple and strong MAA–water interactions. Hence, water molecules could disguise the presence of TNT in ground water.
Conclusions
The main objective of this work was to explore the role of different solvents in the complexation of TNT and MAA, towards a more effective TNT–MIP sensor. Calculated KBI and MAA cluster size analysis has helped to quantify the impact that the porogen would have on the TNT–MAA complex. The KBI displays a clear relationship between the intensity of MAA–SOL interaction and disruption to MAA cluster size. Combining the results summarized in Tables 4 and 5, the ACN![[thin space (1/6-em)]](https://www.rsc.org/images/entities/char_2009.gif) :
:![[thin space (1/6-em)]](https://www.rsc.org/images/entities/char_2009.gif) DMSO binary porogen at 75
DMSO binary porogen at 75![[thin space (1/6-em)]](https://www.rsc.org/images/entities/char_2009.gif) :
:![[thin space (1/6-em)]](https://www.rsc.org/images/entities/char_2009.gif) 25 molar composition is suggested for the synthesis of a more efficient TNT–MIP. Regarding the TNT
25 molar composition is suggested for the synthesis of a more efficient TNT–MIP. Regarding the TNT![[thin space (1/6-em)]](https://www.rsc.org/images/entities/char_2009.gif) :
:![[thin space (1/6-em)]](https://www.rsc.org/images/entities/char_2009.gif) MAA
MAA![[thin space (1/6-em)]](https://www.rsc.org/images/entities/char_2009.gif) :
:![[thin space (1/6-em)]](https://www.rsc.org/images/entities/char_2009.gif) water analysis, a better FM than MAA should be selected for TNT detection in aqueous media; the MD methodology and analysis tool presented here are suitable for such a task.
water analysis, a better FM than MAA should be selected for TNT detection in aqueous media; the MD methodology and analysis tool presented here are suitable for such a task.
Conflicts of interest
There are no conflicts to declare.Acknowledgements
The authors acknowledge the many fruitful discussions of this subject with Prof. Lev Sarkisov from The University of Edinburgh. Granted access to Balena the High-Performance Computing facility at the University of Bath is also recognized.Notes and references
- EPA, Technical Fact Sheet – 2,4,6-Trinitrotoluene (TNT), 2014, p. 1, EPA 505-F-14-009 Search PubMed.
- H. Bao, T. Wei, X. Li, Z. Zhao, H. Cui and P. Zhang, Chin. Sci. Bull., 2012, 57, 2102 CrossRef CAS.
- S. Diltemiz, R. Keçili, A. Ersöz and R. Say, Sensors, 2017, 17, 454 CrossRef PubMed.
- R. Boysen, L. Schwarz, D. Nicolau and M. Hearn, J. Sep. Sci., 2017, 40, 314 CrossRef CAS PubMed.
- Z. Guo, A. Florea, M. Jiang, Y. Mei, W. Zhang, A. Zhang, R. Săndulescu and N. Jaffrezic-Renault, Coatings, 2016, 6, 42 CrossRef.
- V. Suryanarayanan, C. Wu and K. Ho, Electroanalysis, 2010, 22, 1795 CrossRef CAS.
- B. Sellergren, Molecularly Imprinted Polymers: Man-Made Mimics of Antibodies and Their Applications in Analytical Chemistry, First, Elsevier, 2001 Search PubMed.
- C. Herdes and L. Sarkisov, Langmuir, 2009, 25, 5352 CrossRef CAS PubMed.
- E. Dourado, C. Herdes, P. van Tassel and L. Sarkisov, Int. J. Mol. Sci., 2011, 12, 4781 CrossRef CAS PubMed.
- T. Jalink, T. Farrand and C. Herdes, Chem. Cent. J., 2016, 10, 66 CrossRef PubMed.
- I. Chianella, M. Lotierzo, S. Piletsky, I. Tothill, B. Chen, K. Karim and A. Turner, Anal. Chem., 2002, 74, 1288 CrossRef CAS PubMed.
- K. Karim, F. Breton, R. Rouillon, E. Piletska, A. Guerreiro, I. Chianella and S. Piletsky, Adv. Drug Delivery Rev., 2005, 57, 1795 CrossRef CAS PubMed.
- I. Chianella, K. Karim, E. Piletska, C. Preston and S. Piletsky, Anal. Chim. Acta, 2006, 559, 73 CrossRef CAS.
- D. Pavel and J. Lagowski, Polymer, 2005, 46, 7528 CrossRef CAS.
- D. Pavel, J. Lagowski and C. Lepage, Polymer, 2006, 47, 8389 CrossRef CAS.
- T. Curk, J. Dobnikar and D. Frenkel, Soft Matter, 2016, 12, 35 RSC.
- H. Zhou, L. Zeng, X. Chen and H. Hao, J. Forensic Sci. Med., 2015, 1, 109 CrossRef.
- N. Cennamo, G. D'Agostino, R. Galatus, L. Bibbò, M. Pesavento and L. Zeni, Sens. Actuators, B, 2013, 188, 221 CrossRef CAS.
- T. Alizadeh, M. Zare, M. Ganjali, P. Norouzi and B. Tavana, Biosens. Bioelectron., 2010, 25, 1166 CrossRef CAS PubMed.
- E. Holthoff, D. Stratis-Cullum and M. Hankus, Sensors, 2011, 11, 2700 CrossRef CAS PubMed.
- H. Zhao, X. Ma, Y. Li, R. Du, Z. Zhang, F. An and B. Gao, Desalin. Water Treat., 2015, 55, 279 Search PubMed.
- P. Cormack and A. Elorza, J. Chromatogr., B, 2004, 804, 173 CrossRef CAS PubMed.
- Y. Zhang, X. Qu, F. Wang, G. Wu, J. Li, H. Hong and C. Liu, RSC Adv., 2015, 5, 83619 RSC.
- B. Iacob, E. Bodoki and R. Oprean, Electrophoresis, 2014, 35, 2722 CrossRef CAS PubMed.
- M. Gholivand, M. Khodadadian and F. Ahmadi, Anal. Chim. Acta, 2010, 658, 225 CrossRef CAS PubMed.
- J. Saloni, P. Lipkowski, S. Dasary, Y. Anjaneyulu, H. Yu and G. Hill, Polymer, 2011, 52, 1206 CrossRef CAS.
- D. Frenkel and S. Berend, Understanding Molecular Simulation: From Algorithms To Applications, Second, Elsevier, 2002 Search PubMed.
- J. Kirkwood and F. Buff, J. Chem. Phys., 1951, 19, 774 CrossRef CAS.
- W. Jorgensen, D. Maxwell and J. Tirado-Rives, J. Am. Chem. Soc., 1996, 118, 11225 CrossRef CAS.
- H. Berendsen, J. Grigera and T. Straatsma, J. Phys. Chem., 1987, 91, 6269 CrossRef CAS.
- W. Jorgensen, J. Ulmschneider and J. Tirado-Rives, J. Phys. Chem. B, 2004, 108, 16264 CrossRef CAS.
- M. Udier-Blagovic, P. De Tirado, S. Pearlman and W. Jorgensen, J. Comput. Chem., 2004, 25, 1322 CrossRef CAS PubMed.
- N. Bhatnagar, G. Kamathb and J. Potoff, Phys. Chem. Chem. Phys., 2013, 15, 6467 RSC.
- D. Van Der Spoel, E. Lindahl, B. Hess, G. Groenhof, A. Mark and H. Berendsen, J. Comput. Chem., 2005, 26, 1701 CrossRef CAS PubMed.
- E. Lemmon, M. McLinden and D. Friend, Thermophysical properties of fluid systems, ed. P. Linstrom and W. Mallard, NIST Chemistry WebBook, NIST Standard Reference Database Number 69, National Institute of Standards and Technology, Gaithersburg, MD 20899, 2015, {http://webbook.nist.gov} (retrieved APRIL 18, 2017) Search PubMed.
- H. Liu, F. Mueller-Plathe and W. van Gunsteren, J. Am. Chem. Soc., 1995, 117, 4363 CrossRef CAS.
- J. Wang, J. Phys. Chem., 1965, 69, 4412 CrossRef CAS.
- H. Kovacs and A. Laaksonen, J. Am. Chem. Soc., 1991, 113, 5596 CrossRef CAS.
- E. Cebe, D. Kaltenmeier and H. Hertz, Z. Phys. Chem., 1984, 140, 181 CrossRef CAS.
- L. Dang and T. Chang, J. Chem. Phys., 1997, 106, 8149 CrossRef CAS.
- X. Grabuleda, C. Jaime and P. Kollman, J. Comput. Chem., 2000, 21, 901 CrossRef CAS.
- I. Vaisman and M. Berkowitz, J. Am. Chem. Soc., 1992, 114, 7889 CrossRef CAS.
- L. Shi, A. Hou, L. Chen and Z. Wang, Polym. Compos., 2015, 36, 1280 CrossRef CAS.
- C. Lazau, T. Lordache, A. Florea, C. Orha, C. Bandas, A. Radu, A. Sarbu and T. Rotariu, Appl. Surf. Sci., 2016, 384, 449 CrossRef CAS.
Footnotes |
| † Electronic supplementary information (ESI) available: GROMACS v5.1 – all topology files (.itp), quaternary NVT and NPT files (.mdp), selected final configuration files (.gro), and complete binary system analysis. See DOI: 10.1039/c7me00084g |
| ‡ Analysis for all binary systems can be found in the ESI accompanying this work. |
| This journal is © The Royal Society of Chemistry 2018 |

