
Application of cell-based bioassays to evaluate treatment efficacy of conventional and intensified treatment wetlands†
Jaime
Nivala‡
a,
Peta A.
Neale‡
 b,
Tobias
Haasis
c,
Stefanie
Kahl
d,
Maria
König
e,
Roland A.
Müller
a,
Thorsten
Reemtsma
d,
Rita
Schlichting
e and
Beate I.
Escher
*ce
b,
Tobias
Haasis
c,
Stefanie
Kahl
d,
Maria
König
e,
Roland A.
Müller
a,
Thorsten
Reemtsma
d,
Rita
Schlichting
e and
Beate I.
Escher
*ce
aUFZ – Helmholtz Centre for Environmental Research, Centre for Environmental Biotechnology, 04318 Leipzig, Germany
bAustralian Rivers Institute, Griffith School of Environment, Griffith University, Southport QLD 4222, Australia
cEberhard Karls University Tübingen, Environmental Toxicology, Center for Applied Geosciences, 72074 Tübingen, Germany
dUFZ – Helmholtz Centre for Environmental Research, Department of Analytical Chemistry, 04318 Leipzig, Germany
eUFZ – Helmholtz Centre for Environmental Research, Department Cell Toxicology, 04318 Leipzig, Germany. E-mail: beate.escher@ufz.de; Tel: +49 341 235 1244
First published on 14th November 2017
Abstract
Constructed wetlands are commonly used for wastewater treatment when centralized sewage treatment is not feasible. Many studies have focused on the removal of micropollutants by treatment wetlands, but little is known about how well they can remove biological activity. Here we studied the removal efficacy of conventional and intensified treatment wetland designs using both chemical analysis of conventional wastewater parameters and treatment indicator chemicals (caffeine, ibuprofen, naproxen, benzotriazole, diclofenac, acesulfame, carbamazepine) as well as a panel of in vitro bioassays indicative of different stages of cellular toxicity pathways, such as xenobiotic metabolism, receptor-mediated effect and adaptive stress responses. Water samples collected before and after seven treatment wetlands were compared against the adjacent municipal wastewater treatment plant. The intensified treatment wetlands generally removed micropollutants and biological activity to a greater extent than the conventional wastewater treatment plant, whereas the conventional horizontal subsurface flow wetland showed poor removal of all indicators. Carbamazepine was not well removed by any of the studied systems as expected from reported recalcitrance in aerobic environments. Estrogenic activity, which is a commonly used biological endpoint indicator for wastewater treatment, was removed very well by the intensified wetlands (97 to 99.5%) with similar or slightly lower removal efficacy for all other biological endpoints. The results highlight the importance of applying indicator bioassays complementary to indicator chemical analysis for monitoring treatment efficacy. The high removal efficacy of biological effects as a measure of total effect-scaled concentrations of chemicals provides further support to the use of intensified wetlands for wastewater treatment.
Water impactConstructed wetlands offer an alternative to conventional wastewater treatment, though few studies have assessed how well these systems remove biological activity. The current study found that intensified treatment wetlands were able to remove between 74–100% of biological activity, with 97–99.5% of estrogenicity removed. This study provides further evidence that treatment wetlands can contribute to the protection of local water cycles. |
1. Introduction
Treatment wetlands are one of many decentralized wastewater treatment technologies that can be used for water quality improvement in areas for which centralized sewage treatment is not an option. Further, treatment wetlands can also be applied as a polishing step after conventional wastewater treatment.1 Treatment wetlands are based on ecological and natural principles and offer many advantages over other decentralized wastewater treatment technologies. Classic designs are simple to operate, low-cost, and can be constructed out of local materials,2 leading to the widespread use of wetlands for water quality improvement around the world.Across the treatment wetland technology gradient from passive to intensified systems, there are trade-offs between system footprint and energy requirements. A decrease in footprint typically comes at a cost of increased electricity consumption and more complex design and operational requirements.3 However, intensified treatment wetlands are able to degrade pollutants present in wastewater 10- to 1000-fold faster than completely passive wetland designs.4
The first research on micropollutant removal by treatment wetlands started ten years ago in Europe5–7 and has gained a lot of momentum in recent years. Most studies on micropollutant removal in treatment wetlands focus on free water surface (FWS) and horizontal subsurface flow (HSSF) treatment wetland designs. A review by Verlicchi and Zambello8 reported variable treatment efficacy for wetlands used for primary, secondary, and tertiary treatment, but identified many individual micropollutants that are well-removed (>75%) in FWS and HSSF wetlands for secondary treatment of domestic wastewater. Many current studies are conducted on laboratory-scale systems under controlled conditions,9–12 sometimes using synthetic wastewater that does not contain the contaminants of concern at realistic concentrations.13 Recent studies investigating removal of micropollutants in full-scale treatment systems do exist, but reported only the performance of HSSF14,15 and FWS16–18 designs.
While most studies on wetland treatment focus on individual chemicals, wastewater contains a complex mixture of micropollutants, including pharmaceutical and personal care products (PPCP), food additives and industrial chemicals, as well as their transformation products.19 In a previous study on six treatment wetland on the same site, seven micropollutants were determined over a whole-year period as treatment indicators.20 These indicators were chosen to reflect the removal of micropollutants of different biodegradability, from easily degradable (caffeine) to persistent under oxic conditions (carbamazepine).20,21 The same set of indicators was also used in this study to monitor the performance of the treatment wetlands in removing micropollutants.
Chemical analysis alone does not provide any information about the potency of the mixture of detected chemicals and the (waste-) water itself. In vitro bioassays can be applied complementary to chemical analysis as they provide information about the effect of all active compounds in a sample. While bioassays have been applied widely to drinking water, surface water and wastewater22–24 and to assess the treatment efficacy of conventional wastewater treatment plants (WWTP) and advanced water treatment plants,25–27 there has been limited application to assess the treatment efficacy of constructed wetlands. Most of these studies only focussed on estrogenicity.28,29 In the most comprehensive study to date, Ávila et al.30 applied bioassays indicative of dioxin-like activity, estrogenicity and apical effects in whole organisms to evaluate the removal of spiked micropollutants in a hybrid constructed wetland, with approximately 70–100% removal of biological activity observed.
To ensure that most biological effects elicited by typical wastewater contaminants are detected during monitoring, it is important to assemble a bioanalytical test battery that covers different stages of cellular toxicity pathways, including xenobiotic metabolism, receptor-mediated effects, adaptive stress responses and cytotoxicity.31 Cellular toxicity pathways are an important stage in adverse outcome pathways, though an effect at the cellular level may not necessarily lead to higher order effects.32 Test batteries indicative of different stages of cellular toxicity pathways have been successfully applied to drinking water, surface water and wastewater.22,33,34
In the current study a bioanalytical test battery was applied to assess the ability of seven pilot-scale conventional and intensified wetland systems to remove biological activity. This was complemented with chemical analysis of seven indicator micropollutants, which are representative for a larger number of compounds and from high to low biodegradability,21 and conventional wastewater parameters. The treatment efficacy of the constructed wetlands was also compared to a conventional WWTP located adjacent to the wetlands that drew from the same raw municipal wastewater. Previous studies showed variable removal of micropollutants over different seasons,35,36 and in the precedent study on the same wetlands,20 the removal of nutrients, bulk organic matter and micropollutants also showed seasonal variability. Therefore, the bioanalytical assessment in the present study was conducted in summer (July) and autumn (November) to explore seasonal differences, which could be due to differences in plant growth and microbial activity.
The applied test battery included assays indicative of xenobiotic metabolism, receptor-mediated effects and adaptive stress responses. Two assays indicative of xenobiotic metabolism were included in the test battery, the AhR CALUX for activation of the aryl hydrocarbon receptor (AhR) and the PPARγ-bla for binding to the peroxisome proliferator-activated receptor gamma (PPARγ). A wide range of environmental chemicals and water samples has been shown to activate AhR and PPARγ.22,24,31,37 To evaluate hormonal activity, a suite of bioassays indicative of activation of the estrogen receptor (ER), androgen receptor (AR), glucocorticoid receptor (GR) and progesterone receptor (PR) were also included. Receptor-mediated effects are indicative of specific modes of action and have been widely applied to evaluate wastewater and recycled water treatment efficacy.1,38 As wastewater can contain a mixture of both hormone agonists and antagonists, inhibition of ER, AR, GR and PR were assessed in parallel. Finally, two assays indicative of adaptive stress responses were included, AREc32 for the oxidative stress response and NF-κB-bla for the NF-κB response. Adaptive stress response pathways help to re-establish homeostasis after damage to cells by stressors,39 with previous studies showing a range of water types can activate the oxidative stress response and the NF-κB response.33,40 Further, cell viability was assessed in parallel for all assays to ensure that cytotoxicity did not interfere with the observed effect. Through the use of the assembled test battery, the current study is the first to comprehensively evaluate the treatment efficacy of conventional and intensified wetlands based on biological activity.
2. Materials and methods
2.1. Sample collection
Water samples were collected from the wetland systems at the ecotechnology research facility at Langenreichenbach, located near Leipzig, Germany using a previously described sampling methodology based on grab sampling.20 Kahl et al.20 reported that grab sampling at this same research site with samples averaged over 12 samples taken at 2 h intervals showed negligible variation (4–9%) over one week in effluent concentrations from the H50p treatment system for selected micropollutants diclofenac, ibuprofen, and naproxen. Variations were higher within a day (up to 30%) or between consecutive days (up to 40%),20 but for this study where we mainly evaluated the suitability of bioassays for monitoring treatment efficacy, a grab sample will still be representative of treatment efficacy.Further information about the facility can be found in Nivala et al.41 The constructed wetlands included conventional and intensified designs. The baseline technology is a conventional horizontal flow wetland with 50 cm saturated depth (H50p). The intensified wetland systems tested include a saturated vertical flow wetland with aeration (VAp), a saturated horizontal flow wetland with aeration (HAp), and a reciprocating system (R). One two-stage wetland system was tested, which consisted of the vertical flow aerated wetland followed by an unsaturated sand filter (VAp + VSp). The intensified systems HM and HMc are duplicate horizontal flow aerated wetlands, but in HM aeration was shut off between 40 and 70% of the fractional distance along the direction of flow. Within the HM system, internal water samples were also collected at the locations where aeration was shut off (HM40) and turned back on (HM70). Further information about the studied wetlands can be found in Table 1. With the exception of the reciprocating system, R, all wetlands were planted with common reed (Phragmites australis). At the time the study began, all of the systems had been running in steady state for a number of years (see Table 1). The two-stage system VAp + VSp was put into operation in 2016, but the individual systems had been in operation for years prior to the start of the current study. The input for all wetlands was effluent from a septic tank, SEP (out), in which municipal wastewater received primary treatment. Samples were also collected from the influent and effluent of the adjacent municipal WWTP (16![[thin space (1/6-em)]](https://www.rsc.org/images/entities/char_2009.gif) 000 population equivalent; anaerobic and aerobic activated sludge treatment with biological and chemical phosphorus precipitation). The WWTP samples were named WWTP (in), and WWTP (out). Two sampling campaigns were conducted in order to capture seasonal differences, with samples collected on the 26th July and 8th November 2016. Two times two-litre grab samples were collected from each system for bioanalysis. The samples were filtered with glass fibre filters prior to enrichment using Chromabond HR-X solid phase extraction (SPE) cartridges. After extraction, the cartridges were eluted with 10 mL methanol followed by 10 mL ethylacetate and blown down under a gentle nitrogen stream, with the duplicates combined to one extract with a final enrichment factor of 1000. Water samples for micropollutant analysis were collected in 50 mL or 100 mL amber glass bottles. The sample collection procedure for conventional wastewater parameters is described in detail elsewhere.41
000 population equivalent; anaerobic and aerobic activated sludge treatment with biological and chemical phosphorus precipitation). The WWTP samples were named WWTP (in), and WWTP (out). Two sampling campaigns were conducted in order to capture seasonal differences, with samples collected on the 26th July and 8th November 2016. Two times two-litre grab samples were collected from each system for bioanalysis. The samples were filtered with glass fibre filters prior to enrichment using Chromabond HR-X solid phase extraction (SPE) cartridges. After extraction, the cartridges were eluted with 10 mL methanol followed by 10 mL ethylacetate and blown down under a gentle nitrogen stream, with the duplicates combined to one extract with a final enrichment factor of 1000. Water samples for micropollutant analysis were collected in 50 mL or 100 mL amber glass bottles. The sample collection procedure for conventional wastewater parameters is described in detail elsewhere.41
| Site ID | Design | System type | Design flow (L/d) | Area (m2) | Effective deptha (cm) | Operation start date |
|---|---|---|---|---|---|---|
| a Effective depth denotes depth of wetland system actively involved in treatment. b VSp operational since 2012, but only used in combination with VAp since 2016. | ||||||
| H50p | Conventional | Horizontal flow, planted | 200 | 5.6 | 50 | 2010 |
| VAp | Intensified | Vertical flow with aeration, planted | 576 | 6.2 | 85 | 2010 |
| VAp + VSp | Intensified, two-stage system | Vertical flow with aeration (saturated) followed by an unsaturated vertical flow, planted | 576 | 6.2 (each cell) | 85 | 2016b |
| HAp | Intensified | Horizontal flow with aeration, planted | 576 | 5.6 | 100 | 2010 |
| R | Intensified | Reciprocating | 1440 | 13.2 | 95 | 2011 |
| HMc | Intensified | Horizontal flow with aeration, planted | 576 | 5.6 | 90 | 2014 |
| HM | Intensified | Horizontal flow with no aeration from 40–70% fractional distance, planted | 576 | 5.6 | 100 | 2014 |
2.2. Chemical analysis
Seven common municipal wastewater-based micropollutants, acesulfame, benzotriazole, caffeine, carbamazepine, diclofenac, ibuprofen and naproxen, were analysed using high performance liquid chromatography tandem mass spectrometry (HPLC-MS/MS) using the method described by Kahl et al.20 Isotope-labelled internal standards of each analyte were used for quantification. In short, samples were directly injected, though only after dilution in the case of WWTP (in), SEP (out), H50p, after addition of the internal standards and filtration (syringe filters, regenerated cellulose membrane). The seven micropollutants served as indicator compounds, representing different degree of biodegradability under aerobic conditions. Further information on the compound choice and biodegradability can be found in Kahl et al.20 A range of conventional wastewater parameters, including electrical conductivity, dissolved oxygen, carbonaceous biochemical oxygen demand (CBOD5), total organic carbon (TOC), total nitrogen (TN), ammonium-nitrogen (NH4-N) and nitrate-nitrogen (NO3-N), were also analysed in the treatment wetland samples (ESI,† Table S1), with information about the analysis methods in Kahl et al.20Micropollutant removal was quantified with eqn (1) using influent and effluent concentrations (Cinfluent and Ceffluent, respectively). The influent to all treatment wetland systems was septic tank effluent, SEP (out). Removal was calculated using half of the analytical limit of detection (LOD) if Ceffluent was below the LOD. The LODs were taken from Kahl et al.20 and are listed also in the ESI,† Table S2.
 | (1) |
2.3. Bioanalysis
Eight in vitro bioassays covering 12 different endpoints were applied in the current study and are summarised in Table 2. The concentration-effect curves for the assays' positive reference compounds are shown in Fig. S1 of the ESI.† Detailed descriptions of the applied bioassays are available in König et al.33 and Neale et al.31 Cell viability was assessed in parallel to induction for all assays. Cell viability in AREc32 and AhR CALUX was measured using PrestoBlue, a cell permeable resazurin-based solution. For all other assays, the ToxBLAzer DualScreen Kit was used, which combines the ratiometric reporter gene readout of β-lactamase activity with a third fluorometric readout to estimate cytotoxicity. Live-cell analysis using an IncuCyte S3 live cell imaging system (Essen BioScience, Ann Arbor, Michigan, USA) was also applied to assess cell viability in the AhR CALUX assay. Phase contrast images were acquired 24 h after dosing (48 h after seeding). Quantitative analysis of cell confluency was performed using the IncuCyte S3 software. Confluency is a good surrogate for cell proliferation, if changes in cell morphology are minor. A comparison of the two techniques to determine cytotoxicity is provided Fig. S2 of the ESI,† with IncuCyte recommended for measuring cell viability in future studies.| Endpoint | Assay | Method reference | Positive reference compound | EC | Positive reference compound EC value |
|---|---|---|---|---|---|
| Activation of aryl hydrocarbon receptor (AhR) | AhR CALUX | Brennan et al.61 | 2,3,7,8-Tetrachlorodibenzo-p-dioxin (TCDD) | EC10 | (5.92 ± 0.16) × 10−13 M |
| Binding to peroxisome proliferator-activated receptor gamma (PPARγ) | PPARγ-bla | Neale et al.31 | Rosiglitazone | EC10 | (5.68 ± 0.37) × 10−10 M |
| Activation of estrogen receptor (ER) | ERα GeneBLAzer | König et al.33 | 17β-Estradiol | EC10 | (9.87 ± 0.60) × 10−12 M |
| Inhibition of estrogen receptor (ER) | ERα GeneBLAzer | König et al.33 | Tamoxifen | ECSR0.2 | (2.46 ± 0.18) × 10−5 M |
| Activation of androgen receptor (AR) | AR GeneBLAzer | König et al.33 | Metribolone (R1881) | EC10 | (4.10 ± 0.43) × 10−11 M |
| Inhibition of androgen receptor (AR) | AR GeneBLAzer | König et al.33 | Cyproterone acetate | ECSR0.2 | (2.45 ± 0.42) × 10−8 M |
| Activation of glucocorticoid receptor (GR) | GR GeneBLAzer | König et al.33 | Dexamethasone | EC10 | (2.08 ± 0.05) × 10−10 M |
| Inhibition of glucocorticoid receptor (GR) | GR GeneBLAzer | König et al.33 | Mifepristone(RU486) | ECSR0.2 | (3.98 ± 0.28) × 10−10 M |
| Activation of progesterone receptor (PR) | PR GeneBLAzer | König et al.33 | Promegestone | EC10 | (1.81 ± 0. 08) × 10−11 M |
| Inhibition of progesterone receptor (PR) | PR GeneBLAzer | König et al.33 | Mifepristone (RU486) | ECSR0.2 | (3.00 ± 0.45) × 10−10 M |
| Oxidative stress response | AREc32 | Escher et al.,46 Wang et al.62 | tert-Butylhydroquinone (tBHQ) | ECIR1.5 | (1.56 ± 0.03) × 10−6 M |
| NF-κB response | NF-κB-bla | König et al.33 | Tumor necrosis factor alpha (TNFα) | ECIR1.5 | 11.1 ± 0.21 ng L−1 |
2.4. Data evaluation
All bioassay data were evaluated using linear concentration-effect curves at the low-effect linear portion of the otherwise nonlinear concentration-effect curves. The effect concentration causing 10% effect (EC10) was determined for assays indicative of xenobiotic metabolism and receptor-mediated effects where a maximum effect could be reached, while an effect concentration causing an induction ratio of 1.5 (ECIR1.5) was derived for the adaptive stress response assays. To ensure the concentration-effect curves were linear, effects greater than 40% or induction ratios (IR) greater than 5, as well as concentrations causing more than 10% cytotoxicity, were excluded. For assays run in antagonist mode, the effect concentration causing a suppression ratio of 0.2 (ECSR0.2) was also derived from the linear portion of the concentration-effect curves excluding concentrations causing more than 1% cytotoxicity. Further information about the applied data evaluation can be found in Escher et al.22 and Neale et al.31 The EC values were expressed in units of relative enrichment factor (REF), which incorporates sample enrichment by SPE and dilution in the assay.42To translate the effect of a sample in a specific bioassay to the concentration of a reference compound that would elicit the same response, the EC values were converted to bioanalytical equivalent concentrations from bioanalysis (BEQbio). BEQbio was calculated using eqn (2) with the EC value of the sample and the corresponding EC value of the reference compound (ref).
 | (2) |
BEQbio before treatment (BEQbio, influent) and after treatment (BEQbio, effluent) were used to assess the removal efficacy of the studied wetlands, as well as the conventional WWTP (eqn (3)). Errors were calculated as described by König et al.33
 | (3) |
3. Results and discussion
3.1. Chemical analysis
A range of conventional wastewater parameters were assessed, with the results provided in Table S1.† Effluent water temperatures in the treatment wetlands ranged from 19.3–22.7 °C in July and from 9.6–11.0 °C in November. The organic load of the influent wastewater in July was higher than in November, which was marked by elevated CBOD5 and TOC concentrations in July (761 mg L−1 and 499 mg L−1, respectively) compared to November (304 mg L−1 and 242 mg L−1, respectively). Effluent CBOD5 concentrations from the treatment wetlands were under 10 mg L−1 for all systems in July except for H50p, which exhibited an effluent concentration of 59 mg L−1. Effluent CBOD5 concentrations from the treatment wetlands in November were less than 2 mg L−1, except for H50p, which was 30 mg L−1. The redox potential in the effluent from each wetland system increased compared to the wetland influent (SEP (out)). The positive redox values in the effluent of the intensified wetlands (+64.1 to +256 mV) indicated aerobic conditions, while in H50p, reducing conditions persisted (−184 mV in July; −208 mV in November). The ammonium-nitrogen (NH4-N) and total nitrogen (TN) concentrations in the wetland influent were 83 mg L−1 and 97 mg L−1, respectively, in July and 62 mg L−1 and 72 mg L−1, respectively, in November. As a result of the oxidizing conditions in the intensified wetlands (VAp, VAp + VSp, HAp, R, HMc and HM), NH4-N was also well removed, with effluent NH4-N concentrations of 1.4 mg L−1 or lower, regardless of water temperature. The moderately aerobic conditions observed in VAp and R, as evidenced by dissolved oxygen concentrations in July (VAp: 5.5 mg L−1; R: 2.0 mg L−1) and November (VAp: 8.1 mg L−1; R: 5.2 mg L−1), resulted in low effluent TN concentrations (July, VAp: 27 mg L−1; R: 12 mg L−1; November, VAp: 33 mg L−1; R: 22 mg L−1) compared to the other wetlands. The horizontal flow aerated wetlands HAp and HMc exhibited effluent TN concentrations ranging from 40–51 mg L−1. The conventional horizontal flow wetland H50p did not exhibit notable removal of TN or NH4-N but efficiently removed nitrate, due to the lack of oxidising conditions, which is consistent with previous studies on this treatment system.20,43As expected from their widespread use, all seven indicator micropollutants were detected in the outlet of the septic tank feeding the constructed wetlands, as well as the influent to the WWTP in the μg L−1 range (Fig. 1 and ESI,† Table S2). The food additives caffeine and acesulfame were found at the highest concentrations in the inlet to the WWTP and the outlet of the septic tank. Both caffeine and acesulfame have previously been detected in wastewater influent in Germany in the μg L−1 concentration range.44,45 Despite the high concentration of caffeine in the water feeding the wetlands, it was rarely detected in the treated effluent (ESI,† Table S2) due to its high biodegradability under all redox conditions.
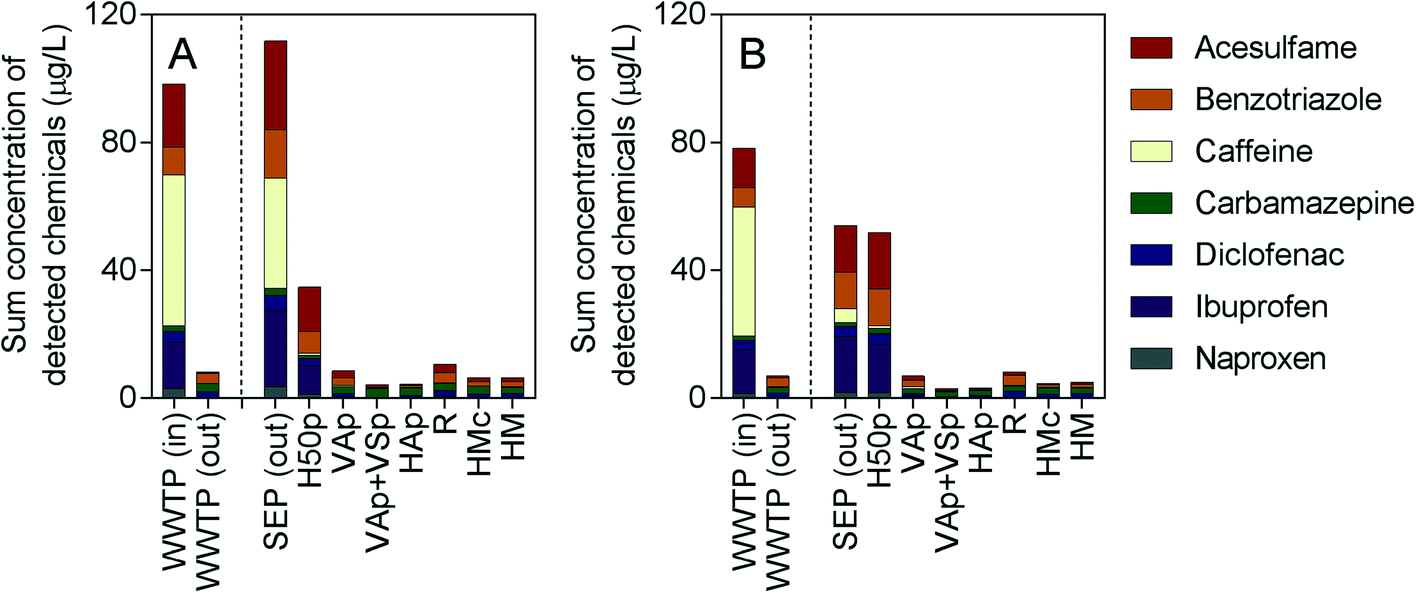 | ||
| Fig. 1 Sum of detected chemicals in units of μg L−1 in A) July and B) November 2016. SEP (out) denotes the influent to the treatment wetlands. Measured concentrations are also provided in Table S2 of the ESI.† | ||
Similarly, the concentrations of pharmaceuticals ibuprofen and naproxen, which are readily to moderately biodegradable under aerobic conditions, were also often below the LOD after treatment (ESI,† Table S2). In contrast, the corrosion inhibitor benzotriazole and pharmaceuticals carbamazepine and diclofenac were detected in the effluent of all wetland systems, as well as in the effluent of the conventional WWTP (ESI,† Table S2). This corresponded well with the reported negligible to low biodegradability of these compounds.21
3.2. Bioanalysis
EC values in units of REF are provided in Table S3,† with the concentration-effect curves shown in Fig. S3 to S14.† BEQbio values in units of ng L−1 are provided in Table 3, though it should be noted that it was not possible to derive BEQbio for inhibition of ER, inhibition of GR and activation of PR as either no effect was observed up to the maximum REF or cytotoxicity masked the effect. All samples were active in the assays indicative of activation of AhR, binding to PPARγ, oxidative stress response and NF-κB response, which fits with previous observations in samples of raw and treated wastewater.22,46 A wide range of chemicals are active in assays indicative of xenobiotic metabolism and adaptive stress responses, with Martin et al.37 showing that 52% of 320 environmental chemicals induced the Nrf2 ARE reporter gene, with 46% and 17% of the studied chemicals activating PPARγ and AhR, respectively. The NF-κB response was the most responsive assay in the current study, with effects in SEP (out) and H50p observed after 50 times dilution (REF 0.02). Wastewater effluent has previously been shown to activate the NF-κB response at low REF,40 though the causative chemicals are currently unknown, with only 3% of chemicals in the US EPA ToxCast database inducing a response.47| Activation of AhR | Binding to PPARγ | Activation of ER | Activation of AR | Inhibition of AR | Activation of GR | Inhibition of PR | Oxidative stress response | NF-κB response | ||
|---|---|---|---|---|---|---|---|---|---|---|
| NB: All samples were cytotoxic or had no effect in ERα GeneBLAzer (antagonist mode), GR GeneBLAzer (antagonist mode) and PR GeneBLAzer (agonist mode). | ||||||||||
| WWTP (in) | July | (2.53 ± 0.12) × 10−1 | (7.19 ± 0.87) × 102 | (2.35 ± 0.17) × 101 | (2.38 ± 0.27) × 101 | Cytotoxic | Cytotoxic | Cytotoxic | (9.23 ± 0.46) × 105 | (2.22 ± 0.14) × 102 |
| November | (2.70 ± 0.11) × 10−1 | (9.36 ± 0.77) × 102 | (1.05 ± 0.01) × 101 | (1.42 ± 0.18) × 101 | Cytotoxic | Cytotoxic | Cytotoxic | (8.66 ± 0.38) × 105 | (3.09 ± 0.11) × 101 | |
| WWTP (out) | July | (1.18 ± 0.05) × 10−1 | (8.31 ± 0.66) × 101 | (4.20 ± 0.29) × 10−1 | Cytotoxic | Cytotoxic | (1.71 ± 0.06) × 101 | Cytotoxic | (1.37 ± 0.04) × 105 | (3.42 ± 0.15) × 101 |
| November | (1.30 ± 0.05) × 10−1 | (1.34 ± 0.14) × 102 | (7.05 ± 0.52) × 10−1 | Cytotoxic | Cytotoxic | (1.94 ± 0.09) × 101 | Cytotoxic | (1.69 ± 0.04) × 105 | (1.21 ± 0.08) × 102 | |
| SEP (out) | July | (8.32 ± 0.50) × 10−1 | (5.77 ± 0.58) × 102 | (3.12 ± 0.22) × 101 | Cytotoxic | (3.35 ± 0.72) × 104 | Cytotoxic | Cytotoxic | (1.07 ± 0.03) × 106 | (5.62 ± 0.27) × 102 |
| November | (4.44 ± 0.18) × 10−1 | (7.65 ± 0.62) × 102 | (1.97 ± 0.05) × 101 | Cytotoxic | (2.81 ± 0.63) × 104 | Cytotoxic | Cytotoxic | (8.48 ± 0.30) × 105 | (5.10 ± 0.30) × 102 | |
| H50p | July | (2.93 ± 0.13) × 10−1 | (4.61 ± 0.42) × 102 | (2.75 ± 0.21) × 101 | Cytotoxic | Cytotoxic | Cytotoxic | Cytotoxic | (4.95 ± 0.15) × 105 | (5.63 ± 0.23) × 102 |
| November | (1.65 ± 0.11) × 10−1 | (5.91 ± 0.81) × 102 | (1.15 ± 0.08) × 101 | Cytotoxic | Cytotoxic | Cytotoxic | (7.46 ± 1.25) × 101 | (4.07 ± 0.12) × 105 | (7.37 ± 0.38) × 102 | |
| VAp | July | (2.13 ± 0.10) × 10−1 | (7.58 ± 0.58) × 101 | (6.52 ± 0.44) × 10−1 | Cytotoxic | (1.07 ± 0.29) × 104 | (1.88 ± 0.06) × 101 | Cytotoxic | (1.47 ± 0.04) × 105 | (4.00 ± 0.21) × 101 |
| November | (1.02 ± 0.05) × 10−1 | (6.54 ± 0.55) × 101 | (4.61 ± 0.30) × 10−1 | >50 | (4.67 ± 2.38) × 103 | (1.17 ± 0.04) × 101 | (5.93 ± 1.07) × 100 | (1.19 ± 0.03) × 105 | (4.15 ± 0.22) × 101 | |
| VAp + VSp | July | (2.08 ± 0.10) × 10−1 | (3.65 ± 0.28) × 101 | (1.41 ± 0.09) × 10−1 | >50 | (1.58 ± 0.44) × 103 | (4.58 ± 0.14) × 100 | (5.86 ± 0.92) × 100 | (8.87 ± 0.28) × 104 | (2.49 ± 0.08) × 101 |
| November | (7.72 ± 0.35) × 10−2 | (3.54 ± 0.32) × 101 | (1.48 ± 0.10) × 10−1 | >50 | (1.97 ± 0.50) × 103 | (1.99 ± 0.08) × 100 | (4.62 ± 0.74) × 100 | (5.31 ± 0.17) × 104 | (6.13 ± 0.26) × 100 | |
| HAp | July | (1.25 ± 0.07) × 10−1 | (5.14 ± 0.40) × 101 | (2.08 ± 0.15) × 10−1 | Cytotoxic | (5.00 ± 1.46) × 103 | (7.95 ± 0.55) × 100 | Cytotoxic | (9.09 ± 0.26) × 104 | (2.22 ± 0.08) × 101 |
| November | (7.62 ± 0.30) × 10−2 | (6.24 ± 0.58) × 101 | (2.19 ± 0.15) × 10−1 | >50 | (1.14 ± 0.36) × 103 | Cytotoxic | (4.79 ± 0.81) × 100 | (7.87 ± 0.25) × 104 | (1.87 ± 0.09) × 101 | |
| R | July | (1.41 ± 0.05) × 10−1 | (7.62 ± 0.60) × 101 | (6.84 ± 0.45) × 10−1 | Cytotoxic | (1.31 ± 0.32) × 103 | (1.74 ± 0.06) × 101 | Cytotoxic | (1.08 ± 0.04) × 105 | (5.53 ± 0.30) × 101 |
| November | (1.00 ± 0.04) × 10−1 | (9.91 ± 0.77) × 101 | (5.63 ± 0.39) × 10−1 | >50 | (6.59 ± 1.30) × 102 | (1.79 ± 0.05) × 101 | (7.07 ± 1.10) × 100 | (8.70 ± 0.26) × 104 | (3.80 ± 0.41) × 101 | |
| HMc | July | (1.10 ± 0.05) × 10−1 | (1.31 ± 0.10) × 102 | (3.76 ± 0.28) × 10−1 | Cytotoxic | Cytotoxic | Cytotoxic | Cytotoxic | (1.04 ± 0.03) × 105 | (1.51 ± 0.07) × 101 |
| November | (6.99 ± 0.30) × 10−2 | (1.13 ± 0.09) × 102 | Cytotoxic | Cytotoxic | Cytotoxic | Cytotoxic | (1.02 ± 0.18) × 101 | (6.13 ± 0.18) × 104 | (1.40 ± 0.09) × 101 | |
| HM | July | (1.16 ± 0.06) × 10−1 | (9.52 ± 0.71) × 101 | (2.99 ± 0.22) × 10−1 | Cytotoxic | Cytotoxic | (8.97 ± 0.55) × 100 | Cytotoxic | (9.06 ± 0.28) × 104 | (2.48 ± 0.09) × 101 |
| November | (8.37 ± 0.35) × 10−2 | (1.42 ± 0.10) × 102 | (5.16 ± 0.43) × 10−1 | Cytotoxic | Cytotoxic | (6.63 ± 0.33) × 100 | Cytotoxic | (3.82 ± 0.17) × 104 | (1.35 ± 0.10) × 101 | |
| HM40 | July | (1.79 ± 0.07) × 10−1 | (2.10 ± 0.16) × 102 | Cytotoxic | Cytotoxic | Cytotoxic | (2.11 ± 0.11) × 101 | Cytotoxic | (2.42 ± 0.11) × 105 | (3.48 ± 0.12) × 101 |
| November | (1.25 ± 0.05) × 10−1 | (3.42 ± 0.28) × 102 | Cytotoxic | Cytotoxic | Cytotoxic | Cytotoxic | (1.40 ± 0.26) × 101 | (8.82 ± 0.73) × 104 | (1.06 ± 0.04) × 101 | |
| HM70 | July | (9.62 ± 0.47) × 10−2 | (1.36 ± 0.10) × 102 | Cytotoxic | Cytotoxic | Cytotoxic | Cytotoxic | Cytotoxic | (8.15 ± 0.31) × 104 | (2.71 ± 0.17) × 101 |
| November | (7.60 ± 0.37) × 10−2 | (1.67 ± 0.14) × 102 | Cytotoxic | Cytotoxic | Cytotoxic | Cytotoxic | (2.17 ± 0.54) × 101 | (5.55 ± 0.21) × 104 | (1.91 ± 0.08) × 101 | |
A suite of assays indicative of activation and inhibition of hormonal activity were also applied, though many of the influent and effluent samples were very cytotoxic, leaving a small window for detection of the effect. Activation of ER was the most responsive, followed by activation of GR, which fits with previous observations from wastewater and surface water.1,22 It should be noted that activation of GR could only be quantified in the effluent from the intensified wetlands, with cytotoxicity masking the effect in WWTP (in), SEP (out) and H50p. In contrast, activation of AR could only be detected in the influent to the WWTP. While SEP (out) had no agonistic or antagonistic activity on the AR (or activity was masked by cytotoxicity), the effluent from several of the intensified wetlands showed antagonistic effects on AR. Generally, androgenic activity is more common in wastewater, while anti-androgenic activity is more frequently detected in environmental waters.22 However, other studies have found anti-androgenic activity in wastewater effluent48 and many environmental estrogenic compounds can also act as anti-androgenic compounds.49 None of the samples caused inhibition of ER or GR at non-cytotoxic concentrations, while weak inhibition of PR was detected in the effluent of the intensified wetlands in November.
3.3. How well did the studied wetlands reduce the chemical concentration and biological activity?
The treatment efficacy of the conventional WWTP and pilot-scale constructed wetlands was assessed using both indicator chemicals and bioanalysis. The intensified wetlands generally showed greater removal of the indicator micropollutants compared to the conventional wetland design H50p, with micropollutant removal in the intensified wetlands similar to or better than the conventional WWTP (Table 4, Fig. S15†). The lack of oxygen in H50p meant that anoxic, nitrate-reducing conditions dominated and removal efficacy was lower, which agrees with findings of the preceding study20 and other studies that found less degradation of PPCPs in wetland sediment under anaerobic conditions compared to aerobic conditions.50 Biodegradation is expected to be a more important removal mechanism than sorption to sediment/soil or plants, as the majority of the indicator micropollutants are polar or even charged (diclofenac, ibuprofen, naproxen) and have octanol–water partition coefficients (logKow) of their neutral species of less than 4 indicating low hydrophobicity and high mobility in aquatic environments (Table S2†).
| WWTP | H50p | VAp | VAp + VSp | HAp | R | HMc | HM | ||
|---|---|---|---|---|---|---|---|---|---|
| Caffeine | July | >99% | 99% | 99% | >99% | >99% | >99% | >99% | >99% |
| November | >99% | 80% | 90% | >96% | >96% | 94% | 93% | >96% | |
| Ibuprofen | July | >94% | 61% | >97% | >97% | >97% | >97% | >97% | >97% |
| November | >94% | 13% | >95% | >95% | >95% | >95% | >95% | >95% | |
| Naproxen | July | 98% | 69% | 94% | >98% | >98% | 93% | >98% | 98% |
| November | >95% | 17% | 94% | >97% | >97% | 94% | >97% | >97% | |
| Benzotriazole | July | 64% | 55% | 84% | 97% | 96% | 79% | 90% | 89% |
| November | 54% | 0% | 81% | 98% | 97% | 72% | 93% | 90% | |
| Diclofenac | July | 44% | 57% | 79% | 96% | 85% | 60% | 74% | 74% |
| November | 44% | −14% | 72% | 88% | 76% | 36% | 62% | 56% | |
| Acesulfame | July | 97% | 50% | 92% | 97% | 98% | 91% | 96% | 96% |
| November | 95% | −21% | 91% | 96% | 98% | 93% | 98% | 96% | |
| Carbamazepine | July | −47% | 48% | −4% | −27% | −16% | 4% | −11% | 3% |
| November | −25% | −31% | −28% | −31% | −36% | −20% | −55% | −41% |
The concentration of ibuprofen was reduced to below the LOD after treatment in all intensified wetlands, while only 61 and 13% was removed by H50p in July and November, respectively. Ibuprofen has previously been shown to be well removed by aerobic degradation processes,30 explaining the high removal in the intensified systems.
Carbamazepine was poorly removed in the conventional WWTP and all wetland systems except H50p in the July sampling, where removal was 48% (Table 4). Carbamazepine was previously reported to be poorly removed in a range of constructed wetland types and conventional WWTP due its recalcitrant nature.35,36,51 The limited removal observed in H50p, although only in July, could be due to reductive transformation processes enabled under anoxic nitrate-reducing conditions.20,52
Acesulfame was removed by more than 90% with exception of H50p (Table 4). This is consistent with previous findings in these systems,20 as well as in several WWTPs and sand filtration of surface water.53
The intensified wetlands were also unable to remove diclofenac effectively, with the exception of VAp + VSp and HAp in July (96% and 85% removal, respectively). Diclofenac removal by WWTPs can be highly variable, and the influence of operational conditions is not yet fully understood.21,54 However, results of a previous study on these wetlands suggested that diclofenac removal in treatment wetlands was most effective when high dissolved oxygen concentrations were present in conjunction with low concentrations of organic carbon.20 This is a plausible explanation for why diclofenac was most efficiently removed in the two-stage system VAp + VSp. The change in season from summer (effluent water temperatures of the wetland systems ranging from 19.3–21.3 °C) to autumn (effluent water temperatures of the wetland systems ranging from 9.6–11.0 °C) had little effect on the removal of the indicator micropollutants in the intensified systems, though it did influence the removal efficacy of H50p, with decreasing removal of all compounds compared to July (Fig. S15†). Increased removal in warmer months has also been observed previously35 and can be related to increased microbial activity in warmer conditions.
Removal of biological activity could only be assessed for five of the studied endpoints, activation of AhR, binding to PPARγ, activation of ER, oxidative stress response and NF-κB response, as cytotoxicity masked induction in the WWTP (in) and SEP (out) samples for the other assays. Similar to the indicator micropollutants, the ability of intensified systems to remove biological activity was comparable to or greater than the removal efficacy of the conventional WWTP for all assays, while the conventional system H50p had the lowest removal efficacy (Fig. 2, Table S4†).
 | ||
| Fig. 2 Removal of BEQbio (%) after treatment in A) July and B) November for assays indicative of activation of AhR, binding to PPARγ, activation of ER, oxidative stress response and NF-κB response. * removal could not be calculated for HMc due to cytotoxicity. The associated data are given in the ESI, Table S4.† Error bars were calculated using error propagation from errors derived by concentration-effect curve modeling. | ||
In all six intensified wetlands no influence of the two sampling seasons summer (July) and late autumn (November) on removal of biological activity was observed for any biological endpoint. In contrast to the indicator micropollutants, the removal efficacy of H50p was comparable between the two sampling events, suggesting that the difference in temperature and plant growth did not have a significant impact on the removal of compounds causing biological effects. Some of the active compounds may be more hydrophobic, potentially making sorption a more relevant removal process, with seasonality less likely to have an effect. Estrogenic activity was very well removed by the intensified wetlands, with 97 to 99.5% reduction in BEQbio after treatment. Several studies have also found good removal of estrogenic activity in wetlands treating municipal wastewater28 and agricultural wastewater.55
The smallest reduction in BEQbio was observed for compounds that activated AhR, with between 74 to 87% reduction for the intensified systems. However, it should be noted that this was considerably better than removal by the conventional WWTP, where BEQbio for activation of AhR was only reduced by around 50%. Similarly, between 46 to 69% of AhR activity was removed in a water reclamation plant after activated carbon filtration and ozonation.56 Ávila et al.30 applied an AhR yeast assay to assess the ability of a hybrid constructed wetland to remove dioxin-like activity in wastewater spiked with micropollutants and found complete removal of activity after vertical flow and horizontal flow wetlands, though activity increased again after treatment in the FWS wetland. Since the AhR is a very promiscuous receptor that binds a diversity of chemicals,57 it is not possible to explain what types of chemicals were dominating the effect removal and what types of chemicals caused the differences between the WWTP and the wetlands. However one feature that AhR ligands have in common is that they are typically fairly large, neutral and hydrophobic chemicals, which contrasts the physicochemical properties of the indicator chemicals that were included in chemical analysis.
Few studies have applied bioassays to assess the treatment efficacy of constructed wetlands and most focussed on estrogenicity. Therefore, it was not possible to compare the results for the other assays in similar wetland systems because to our knowledge no such experiments were previously conducted. However, Bain et al.1 found between 69 to 100% reduction in PPARγ activity in three WWTPs, with the greatest removal found for a WWTP which included a constructed wetland for excess nutrient removal as the final step in the treatment train. Between 77 to 95% of PPARγ activity was removed by the intensified wetlands in the current study, with the two-stage VAp + VSp being the most effective system.
Further, the reduction in BEQbio for the oxidative stress response was considerably greater in the intensified wetlands (86 to 96%) than previously reported for a conventional WWTP (40% reduction).58 The NF-κB assay has not previously been applied to assess WWTP efficacy, but over 90% reduction in BEQbio was observed in all intensified wetlands.
To explore the effect of aeration on removal, the removal of BEQbio was compared for identical intensive horizontal flow systems, HM and HMc, with aeration turned off from 40 to 70% fractional distance in HM (Fig. 3). Over 90% of BEQbio for the NF-κB response was removed prior to aeration being shut off, with further treatment having little impact on the biological activity. Further, the majority of biological activity was removed within 40% distance in direction of flow for activation of AhR, binding to PPARγ and oxidative stress response, with some additional decrease in effect in the zone that was slightly less aerobic but not fully anoxic, i.e. from HM40 to HM70. If removal was calculated between HM40 and HM70, it was 46% (July) and 39% (Nov) for AhR, and the step from HM70 to HM did not lead to any additional removal. For PPARγ the incremental relative removal between HM40 and HM70 was 35% (July) and 51% (Nov), and the step from HM70 to the HM removed 30% (July) and 15% (Nov). If removal was calculated for each step separately for AREc32, the removal between HM40 and HM70 was 66% (July) and 37% (Nov), and the step from HM70 to HM removed no effect (July) and 31% (Nov).
 | ||
| Fig. 3 Removal of BEQbio (%) along the flow path in HM for assays indicative of activation of AhR, binding to PPARγ, activation of ER, oxidative stress response and NF-κB response (eqn (3)). Samples collected in July indicated by closed symbols and solid lines; samples collected in November indicated by open symbols and dashed lines. Error bars were calculated using error propagation. | ||
This fits with previous findings by Ávila et al.30 that the majority of the biological activity in a hybrid wetland system was removed by aerobic treatment processes. Overall, there was little difference in the absolute removal efficacy of HM and HMc (Fig. 2), suggesting that the change in aeration did not significantly alter removal of biological activity. While the indicator micropollutants were not analysed in the HM40 and HM70 samples, comparison of the micropollutant concentrations in the effluent of HM and HMc also shows little difference (Fig. 1).
Overall, the indicator micropollutants and bioanalysis both show that the studied intensified wetlands have a similar or greater capacity to reduce pollutant load and biological activity as the conventional WWTP. Further, conventional horizontal treatment wetlands under conditions of high organic loading and with low dissolved oxygen concentrations did neither efficiently remove biological activity nor the indicator micropollutants eliminable via oxidative pathways.
3.4. Does wetland treated effluent pose a risk to the receiving environment?
To evaluate the potential risks to the receiving environment, the chemical concentrations in the treated effluent were compared with proposed environmental quality standards (EQS). Of the seven indicator micropollutants, proposed average annual EQS were available for five chemicals.59 All wetland treatment processes reduced the concentration of naproxen below the proposed EQS of 1.7 μg L−1, while none of the measured benzotriazole concentrations, even in the wastewater influent, exceeded the proposed EQS of 19 μg L−1. In contrast, the concentration of carbamazepine was higher than the proposed EQS of 2.0 μg L−1 after treatment in July, with the exception of conventional WWTP and H50p, which typically had the poorest removal of the other indicator micropollutants and biological activity. Further, none of the treatments reduced the concentration of diclofenac below the proposed EQS of 0.05 μg L−1, which is lower than the LOD in this study (0.12 μg L−1). The proposed EQS for ibuprofen, 0.01 μg L−1, was also lower than the LOD in the current study (0.81 μg L−1). While the poor removal of carbamazepine as well as diclofenac by all treatment processes may potentially be problematic, it should be noted that further dilution of the treated effluent in the freshwater environment is expected, with processes such as photodegradation, sorption or (bio-) transformation in the subsurface likely to reduce the concentrations of diclofenac and carbamazepine even further.21,36,50Benchmarking the bioanalytical results is more difficult as effect-based trigger values for surface water have not been derived for the studied assays. As the effect in ERα GeneBLAzer was expressed in 17β-estradiol equivalent concentrations (EEQ), the results can be compared with the proposed European Union 17β-estradiol EQS of 0.4 ng L−1, though this only represents a single chemical and does not take into account the mixture effects. With the exception of H50p, all studied wetlands reduced the effluent concentrations to between 0.14–0.68 ng L−1 EEQ, with treatment by HAp and VAp + VSp reducing the effluent concentration to below 0.4 ng L−1 EEQ in both July and November. Further, Jarošová et al.60 derived safe concentrations of estrogenic equivalents (EEQ-SSE) for municipal effluents using a range of in vitro bioassays. While ERα GeneBLAzer was not included in the study, the EEQ in the current study were in the range of proposed short-term exposure EEQ-SSE (0.5 to 2 ng L−1 EEQ), with only effluent from HAp and VAp + VSp in the range of the long-term exposure EEQ-SSE (0.1 to 0.4 ng L−1 EEQ). Work is currently ongoing to derive effect-based trigger values for a wider range of endpoints relevant for environmental waters.
4. Conclusions
In general, the removal efficacy of the biological effects aligned well with the removal efficacy of the well-degradable indicator chemicals but not with recalcitrant indicator chemicals such as carbamazepine. Using a comprehensive battery of bioassays, this study shows for the first time that intensified wetlands can remove biological activity to a greater extent than conventional wastewater treatment. In contrast, the conventional horizontal flow wetland H50p performed much poorer, which was also confirmed by chemical analysis and was consistent with earlier chemical analysis of seven polar indicator chemicals.20 Estrogenicity is commonly used as a biological endpoint indicator for wastewater treatment, and all intensified wetlands were able to remove estrogenic activity very well (97 to 99.5%). While improved removal of indicator micropollutants was observed for H50p in July, there was no difference in removal of biological activity with season. This suggests that the indicator micropollutants, which were selected based on their biodegradability, cannot be used to predict the removal of overall biological effects, emphasising the importance of applying bioanalysis complementary to chemical analysis.Here we evaluated a wide range of bioassays but for future monitoring studies and investigations of temporal effects as well as different treatment conditions we propose a set of indicator bioassays as treatment performance indicators. Suitable for this purpose of surveillance monitoring in future studies would be a test battery that comprises bioassays for activation of AhR, activation of ER and the oxidative stress response because they yield different pictures of removal and they cover three different stages of the cellular toxicity pathway. In addition, and similar to what is proposed for surface water quality monitoring,31 one could add one or more bioassays with whole organisms, such as the fish embryo test or an algal toxicity assay, to assure that all bioactive chemicals are captured by the bioassays.
Future studies on treatment wetland systems with the battery of indicator bioassays and indicator chemicals should include frequent and regular sampling on full-scale systems over the course of at least one year in order to encompass stochastic variability of influent and effluent wastewater, as well as any seasonal variations in removal of biological effects. A more extensive internal sampling in saturated treatment wetland systems along the flow path could also help to optimise the design of future treatment wetland systems.
Conflicts of interest
There are no conflicts to declare.Acknowledgements
This work was supported in part by funding from the German Ministry of Education and Research (BMBF) within the context of the SMART-MOVE Project: Management of Highly Variable Water Resources in Semi-Arid Regions (FKZ: 02WM1355B). J. Nivala acknowledges the Helmholtz Centre for Environmental Research (UFZ) Integrated Projects Urban Transformations and Water Scarcity. The authors are particularly grateful to Katy Bernhard for her support in operation and sampling of the facility at Langenreichenbach and to Gabriele Strenge for support in indicator chemical analysis. Grit Weichert, Johannes Boog, Thomas Aubron, Carola Bönisch, and Karsten Marien are acknowledged for analytical support. Volker Dreher and his team (AZV Heidelbach) are acknowledged for support at the Langenreichenbach wastewater treatment plant. Christin Kühnert and Lisa Glauch are thanked for bioassay experiments. We thank Rita Triebskorn for co-supervision of the Bachelor thesis of T. Haasis and helpful discussions.References
- P. A. Bain, M. Williams and A. Kumar, Environ. Toxicol. Chem., 2014, 33, 2297–2307 CrossRef CAS PubMed.
- R. H. Kadlec and S. D. Wallace, Treatment Wetlands, CRC Press, Boca Raton, Florida, 2nd edn, 2009 Search PubMed.
- D. Austin and J. Nivala, Ecol. Eng., 2009, 35, 184–192 CrossRef.
- J. Nivala, PhD, Aarhus University, 2012 Search PubMed.
- V. Matamoros, J. Puigagut, J. García and J. M. Bayona, Chemosphere, 2007, 69, 1374–1380 CrossRef CAS PubMed.
- V. Matamoros, A. Caselles-Osorio, J. García and J. M. Bayona, Sci. Total Environ., 2008, 394, 171–176 CrossRef CAS PubMed.
- A. Dordio, J. Teimao, I. Ramalho, A. Carvalho and A. Candeias, Sci. Total Environ., 2007, 380, 237–246 CrossRef CAS PubMed.
- P. Verlicchi and E. Zambello, Sci. Total Environ., 2014, 470-471, 1281–1306 CrossRef CAS PubMed.
- H. Auvinen, I. Havran, L. Hubau, L. Vanseveren, W. Gebhardt, V. Linnemann, D. Van Oirschot, G. Du Laing and D. P. L. Rousseau, Ecol. Eng., 2017, 100, 157–164 CrossRef.
- T. Lv, Y. Zhang, L. Zhang, P. N. Carvalho, C. A. Arias and H. Brix, Water Res., 2016, 91, 126–136 CrossRef CAS PubMed.
- L. Zhang, T. Lv, Y. Zhang, O. R. Stein, C. A. Arias, H. Brix and P. N. Carvalho, Sci. Total Environ., 2017, 609, 38–45 CrossRef CAS PubMed.
- Z. Chen, Y. Chen, J. Vymazal, L. Kule and M. Kozeluh, Sci. Total Environ., 2017, 577, 386–394 CrossRef CAS PubMed.
- A. M. Gorito, A. R. Ribeiro, C. M. R. Almeida and A. M. T. Silva, Environ. Pollut., 2017, 227, 428–443 CrossRef CAS PubMed.
- J. Vymazal, T. Dvořáková Březinová, M. Koželuh and L. Kule, Ecol. Eng., 2017, 98, 354–364 CrossRef.
- V. Matamoros, Y. Rodríguez and J. M. Bayona, Ecol. Eng., 2017, 99, 222–227 CrossRef.
- V. Matamoros, J. Garcia and J. M. Bayona, Water Res., 2008, 42, 653–660 CrossRef CAS PubMed.
- E. Llorens, V. Matamoros, V. Domingo, J. M. Bayona and J. Garcia, Sci. Total Environ., 2009, 407, 2517–2524 CrossRef CAS PubMed.
- M. Breitholtz, M. Naslund, D. Strae, H. Borg, R. Grabic and J. Fick, Ecotoxicol. Environ. Saf., 2012, 78, 63–71 CrossRef CAS PubMed.
- R. Loos, R. Carvalho, D. C. Antonio, S. Cornero, G. Locoro, S. Tavazzi, B. Paracchini, M. Ghiani, T. Lettieri, L. Blaha, B. Jarosova, S. Voorspoels, K. Servaes, P. Haglund, J. Fick, R. H. Lindberg, D. Schwesig and B. M. Gawlik, Water Res., 2013, 47, 6475–6487 CrossRef CAS PubMed.
- S. Kahl, J. Nivala, M. van Afferden, R. A. Müller and T. Reemtsma, Water Res., 2017, 125, 490–500 CrossRef CAS PubMed.
- M. Jekel, W. Dott, A. Bergmann, U. Dunnbier, R. Gnirss, B. Haist-Gulde, G. Hamscher, M. Letzel, T. Licha, S. Lyko, U. Miehe, F. Sacher, M. Scheurer, C. K. Schmidt, T. Reemtsma and A. S. Ruhl, Chemosphere, 2015, 125, 155–167 CrossRef CAS PubMed.
- B. I. Escher, M. Allinson, R. Altenburger, P. A. Bain, P. Balaguer, W. Busch, J. Crago, N. D. Denslow, E. Dopp, K. Hilscherova, A. R. Humpage, A. Kumar, M. Grimaldi, B. S. Jayasinghe, B. Jarosova, A. Jia, S. Makarov, K. A. Maruya, A. Medvedev, A. C. Mehinto, J. E. Mendez, A. Poulsen, E. Prochazka, J. Richard, A. Schifferli, D. Schlenk, S. Scholz, F. Shiraish, S. Snyder, G. Y. Su, J. Y. M. Tang, B. van der Burg, S. C. van der Linden, I. Werner, S. D. Westerheide, C. K. C. Wong, M. Yang, B. H. Y. Yeung, X. W. Zhang and F. D. L. Leusch, Environ. Sci. Technol., 2014, 48, 1940–1956 CrossRef CAS PubMed.
- M. L. Jugan, L. Oziol, M. Bimbot, V. Huteau, S. Tamisier-Karolak, J. P. Blondeau and Y. Levi, Sci. Total Environ., 2009, 407, 3579–3587 CrossRef CAS PubMed.
- A. L. Schroeder, G. T. Ankley, K. A. Houck and D. L. Villeneuve, Environ. Toxicol. Chem., 2016, 35, 513–525 CrossRef CAS PubMed.
- B. I. Escher, N. Bramaz and C. Ort, J. Environ. Monit., 2009, 11, 1836–1846 RSC.
- B. I. Escher, M. Lawrence, M. Macova, J. F. Mueller, Y. Poussade, C. Robillot, A. Roux and W. Gernjak, Environ. Sci. Technol., 2011, 45, 5387–5394 CrossRef CAS PubMed.
- M. Macova, B. I. Escher, J. Reungoat, S. Carswell, K. L. Chue, J. Keller and J. F. Mueller, Water Res., 2010, 44, 477–492 CrossRef CAS PubMed.
- H. L. Song, X. L. Yang, K. Nakano, M. Nomura, O. Nishimura and X. N. Li, Int. J. Environ. Anal. Chem., 2011, 91, 600–614 CrossRef CAS.
- L. Xie, Y. Sapozhnikova, O. Bawardi and D. Schlenk, Arch. Environ. Contam. Toxicol., 2004, 48, 81–86 CrossRef PubMed.
- C. Ávila, V. Matamoros, C. Reyes-Contreras, B. Pina, M. Casado, L. Mita, C. Rivetti, C. Barata, J. Garcia and J. M. Bayona, Sci. Total Environ., 2014, 470, 1272–1280 CrossRef PubMed.
- P. A. Neale, R. Altenburger, S. Aït-Aïssa, F. Brion, W. Busch, G. de Aragão Umbuzeiro, M. S. Denison, D. Du Pasquier, K. Hilscherová, H. Hollert, D. A. Morales, J. Novák, R. Schlichting, T.-B. Seiler, H. Serra, Y. Shao, A. J. Tindall, K. E. Tollefsen, T. D. Williams and B. I. Escher, Water Res., 2017, 123, 734–750 CrossRef CAS PubMed.
- G. T. Ankley, R. S. Bennett, R. J. Erickson, D. J. Hoff, M. W. Hornung, R. D. Johnson, D. R. Mount, J. W. Nichols, C. L. Russom, P. K. Schmieder, J. A. Serrrano, J. E. Tietge and D. L. Villeneuve, Environ. Toxicol. Chem., 2010, 29, 730–741 CrossRef CAS PubMed.
- M. König, B. I. Escher, P. A. Neale, M. Krauss, K. Hilscherova, J. Novak, I. Teodorovic, T. Schulze, S. Seidensticker, M. A. K. Hashmi, J. Ahlheim and W. Brack, Environ. Pollut., 2017, 220, 1220–1230 CrossRef PubMed.
- P. A. Neale, S. Ait-Aissa, W. Brack, N. Creusot, M. S. Denison, B. Deutschmann, K. Hilscherova, H. Hollert, M. Krauss, J. Novak, T. Schulze, T. B. Seiler, H. Serra, Y. Shao and B. I. Escher, Environ. Sci. Technol., 2015, 49, 14614–14624 CrossRef CAS PubMed.
- M. Hijosa-Valsero, V. Matamoros, R. Sidrach-Cardona, J. Martin-Villacorta, E. Becares and J. M. Bayona, Water Res., 2010, 44, 3669–3678 CrossRef CAS PubMed.
- S. Ruhmland, A. Wick, T. A. Ternes and M. Barjenbruch, Ecol. Eng., 2015, 80, 125–139 CrossRef.
- M. T. Martin, D. J. Dix, R. S. Judson, R. J. Kavlock, D. M. Reif, A. M. Richard, D. M. Rotroff, S. Romanov, A. Medvedev, N. Poltoratskaya, M. Gambarian, M. Moeser, S. S. Makarov and K. A. Houck, Chem. Res. Toxicol., 2010, 23, 578–590 CrossRef CAS PubMed.
- F. D. L. Leusch, S. J. Khan, S. Laingam, E. Prochazka, S. Froscio, T. Trinh, H. F. Chapman and A. Humpage, Water Res., 2014, 49, 300–315 CrossRef CAS PubMed.
- S. O. Simmons, C. Y. Fan and R. Ramabhadran, Toxicol. Sci., 2009, 111, 202–225 CrossRef CAS PubMed.
- P. A. Neale, N. A. Munz, S. Ait-Aissa, R. Altenburger, F. Brion, W. Busch, B. I. Escher, K. Hilscherova, C. Kienle, J. Novak, T. B. Seiler, Y. Shao, C. Stamm and J. Hollender, Sci. Total Environ., 2017, 576, 785–795 CrossRef CAS PubMed.
- J. Nivala, T. Headley, S. Wallace, K. Bernhard, H. Brix, M. van Afferden and R. A. Muller, Ecol. Eng., 2013, 61, 527–543 CrossRef.
- B. I. Escher and F. D. L. Leusch, Bioanalytical tools in water quality assessment, IWA Publishing, London, 2012 Search PubMed.
- J. Nivala, S. Wallace, T. Headley, K. Kassa, H. Brix, M. van Afferden and R. Muller, Ecol. Eng., 2013, 61, 544–554 CrossRef.
- M. Scheurer, H. J. Brauch and F. T. Lange, Anal. Bioanal. Chem., 2009, 394, 1585–1594 CrossRef CAS PubMed.
- T. A. Ternes, M. Bonerz, N. Herrmann, B. Teiser and H. R. Andersen, Chemosphere, 2007, 66, 894–904 CrossRef CAS PubMed.
- B. I. Escher, M. Dutt, E. Maylin, J. Y. M. Tang, S. Toze, C. R. Wolf and M. Lang, J. Environ. Monit., 2012, 14, 2877–2885 RSC.
- US EPA, Interactive Chemical Safety for Sustainability (iCSS) Dashboard v2, http://actor.epa.gov/dashboard/, Accessed 7th Aug 2017.
- K. F. Rao, N. Li, M. Ma and Z. J. Wang, Front. Environ. Sci. Eng., 2014, 8, 69–78 CrossRef CAS.
- P. Sohoni and J. P. Sumpter, J. Endocrinol., 1998, 158, 327–339 CrossRef CAS PubMed.
- J. L. Conkle, J. Gan and M. A. Anderson, J. Soils Sediments, 2012, 12, 1164–1173 CrossRef CAS.
- V. Matamoros, C. Arias, H. Brix and J. M. Bayona, Environ. Sci. Technol., 2007, 41, 8171–8177 CrossRef CAS PubMed.
- A. König, C. Weidauer, B. Seiwert, T. Reemtsma, T. Unger and M. Jekel, Water Res., 2016, 101, 272–280 CrossRef PubMed.
- S. Castronovo, A. Wick, M. Scheurer, K. Nödler, M. Schulz and T. A. Ternes, Water Res., 2017, 110, 342–353 CrossRef CAS PubMed.
- Y. J. Zhang, S. U. Geissen and C. Gal, Chemosphere, 2008, 73, 1151–1161 CrossRef CAS PubMed.
- N. W. Shappell, L. O. Billey, D. Forbes, T. A. Matheny, M. E. Poach, G. B. Reddy and P. G. Hunt, Environ. Sci. Technol., 2007, 41, 444–450 CrossRef CAS PubMed.
- J. Reungoat, M. Macova, B. I. Escher, S. Carswell, J. F. Mueller and J. Keller, Water Res., 2010, 44, 625–637 CrossRef CAS PubMed.
- M. S. Denison and S. R. Nagy, Annu. Rev. Pharmacol. Toxicol., 2003, 43, 309–334 CrossRef CAS PubMed.
- J. Y. M. Tang, F. Busetti, J. W. A. Charrois and B. I. Escher, Water Res., 2014, 60, 289–299 CrossRef CAS PubMed.
- Oekotoxzentrum, Proposals for Acute and Chronic Quality Standards, http://www.ecotoxcentre.ch/expert-service/quality-standards/proposals-for-acute-and-chronic-quality-standards/, accessed 4th August 2017).
- B. Jarošová, L. Bláha, J. P. Giesy and K. Hilscherová, Environ. Int., 2014, 64, 98–109 CrossRef PubMed.
- J. C. Brennan, G. C. He, T. Tsutsumi, J. Zhao, E. Wirth, M. H. Fulton and M. S. Denison, Environ. Sci. Technol., 2015, 49, 11903–11912 CrossRef CAS PubMed.
- X. J. Wang, J. D. Hayes and C. R. Wolf, Cancer Res., 2006, 66, 10983–10994 CrossRef CAS PubMed.
Footnotes |
| † Electronic supplementary information (ESI) available. See DOI: 10.1039/c7ew00341b |
| ‡ Both authors contributed equally to this MS. |
| This journal is © The Royal Society of Chemistry 2018 |