High thermoelectric performance of α-MgAgSb for power generation
Zihang
Liu
 ab,
Jun
Mao
bc,
Jiehe
Sui
*a and
Zhifeng
Ren
 *b
*b
aState Key Laboratory of Advanced Welding and Joining, Harbin Institute of Technology, Harbin 150001, China. E-mail: suijiehe@hit.edu.cn
bDepartment of Physics and TcSUH, University of Houston, Houston, Texas 77204, USA. E-mail: zren@uh.edu
cDepartment of Mechanical Engineering, University of Houston, Houston, Texas 77204, USA
First published on 18th October 2017
Abstract
Solid-state thermoelectric devices enable the conversion of waste heat and solar energy into electricity, providing an alternative route for energy harvesting to tackle the challenges of energy sustainability. α-MgAgSb-based materials have recently gained popular attention as a new promising p-type candidate for low-temperature (between room temperature and 550 K) applications. A high figure of merit (ZT) of 1.2–1.4 at 550 K was achieved, along with experimental demonstration of a record high conversion efficiency of ∼8.5% under a cold- and hot-side temperature difference of 225 K, which holds the realistic prospect for power generation. In this review, we summarize the recent progress in both material-level understanding and device-level measurement of the α-MgAgSb system. First, the phase transitions and common fabrication methods are briefly introduced. Then, the origin of the “phonon glass electron crystal” behavior of α-MgAgSb is thoroughly elucidated with regard to some critical factors, such as the crystal structure, lattice dynamic properties, defect chemistry, microstructure, and band structure. Afterwards, the effective strategies to further enhance the ZT are illustrated, including optimizing the carrier concentration and intrinsic defect engineering. In addition, other feasible methods in theory are also presented. Finally, the conversion efficiency on a single-leg device is presented. In the outlook section, the currently unsolved questions as well as future directions and challenges for this material system are discussed.
Broader contextFor broader real applications in low-grade waste heat recovery or solar energy harvesting, promising thermoelectric materials should possess some critical attributes, including a high average ZT (for high conversion efficiency), a high average PF (for a large output power density), superior mechanical properties, and good thermal stability (for reliable long-term service) as well as non-toxic and earth-abundant matrix elements (for a low cost of raw materials). Since 2012, α-MgAgSb-based materials have received intensive interest as a promising p-type candidate for low to medium temperature power generation. A record high conversion efficiency of 8.5% for a single leg was experimentally demonstrated at an operating temperature difference of 225 K. In this perspective, we summarize the recent progress in both a material-level understanding and device-level measurement of the α-MgAgSb system, including phase transition and the fabrication method, the “phonon glass electron crystal” (PGEC) behavior, current strategies to enhance the thermoelectric performance, and the mechanical properties as well as device fabrication and efficiency measurements. Finally, the currently unsolved questions as well as future directions and challenges are also pointed out. |
1. Introduction
The International Energy Agency (IEA) has predicted a 37% increase in global energy demand by 2040, while the Paris Agreement on climate change aims to keep the world average temperature “well below” 2 K above preindustrial levels, with this target coming into effect on November, 2016.1,2 In the context of the accelerated global energy demand and increasing pressure to reduce greenhouse-gas emissions, the efficient utilization of clean and renewable energy has attracted extensive interest over the last decade,3 including wind power,4 solar energy,5 hydropower, and biofuels.6,7 Meanwhile, in 2016 more than half (∼66.4%) of the primary energy was ultimately rejected to the environment throughout the United States,8 resulting in various potential heat sources. Thermoelectric power generation (TEG) is capable of directly converting waste heat into electricity based on the Seebeck effect and would play a vital role in future energy harvesting.9,10 The solar thermoelectric generator (STEG) is also an attractive candidate for converting solar energy into electricity,11,12 which has achieved a high system efficiency of 7.4% as demonstrated very recently by Kraemer et al.13 Thermoelectric devices, with unique advantages of no moving parts, no pollutants, light weight, high reliability, and simplicity, have long been used for powering the spacecrafts used in most NASA deep-space missions in the form of the radioisotope thermoelectric generator (RTG).14–16 However, TEG falls short of realizing the hopes and expectations placed upon it in a wide range of applications in commercial markets, primarily due to its relatively low conversion efficiency in thermoelectric devices compared with conventional heat engines. The conversion efficiency is dominated by the Carnot efficiency and the material's dimensionless thermoelectric figure of merit (ZT), ZT = (S2σ/(κlat + κele))T, where S, σ, κlat, κele, and T are the Seebeck coefficient, the electrical conductivity, the lattice thermal conductivity, the electronic thermal conductivity, and the absolute temperature, respectively. Since the fundamental theory of the thermoelectric effect was first established by Ioffe in the 1950s,17 pursuing a higher ZT has been a key topic for the thermoelectric community. Due to the intertwined or even contradictory fundamental parameters,18,19 a ZT above unity was originally regarded as a benchmark for bulk thermoelectric materials.17,20,21 However, over the past two decades, band structure engineering and microstructure engineering have been theoretically proposed and experimentally demonstrated as effective methods to enhance the power factor (PF = S2σ) and suppress κlat for traditional thermoelectric materials,22–37 respectively. Simultaneously, the new concept of the “phonon glass electron crystal” (PGEC), proposed by Slack in 1995, has changed the thinking about thermoelectric materials research and led to the design of new high performance materials,14 especially cage-like compounds38–41 and superionic conductors.42–46 Interested readers are encouraged to refer to some excellent review articles that also cover electron and phonon transport,18,19,47–51 band structure engineering,52,53 nanostructuring,54–56 panoscopic approach,57–59 thermoelectric power generators,60–62 and specific material systems, such as Bi2Te3,63,64 PbTe,65 Zn4Sb3,66 clathrates,41 Zintl phase,67,68 half-Heusler,69,70 oxide,71,72 and others.73–76In fact, remarkable progress in enhancing ZT has been achieved over the last decade; consequently promoting the active consideration of thermoelectric devices for waste heat recovery in industry and/or automobiles.15,77Fig. 1(a) and (b) show the temperature-dependent ZT of the state-of-the-art n-type and p-type bulk thermoelectric materials,24,27,78–90 respectively. It seems to be a record-breaking time for thermoelectric materials to achieve peak ZT values. In real applications, however, a high peak ZT does not guarantee a high conversion efficiency for power generation. Conventionally, the peak ZT, relating to the theoretical efficiency, is the only target for the thermoelectric community. However, in practical applications, on a materials level, the average ZT determines the efficiency, and a high PF is equally important to a high average ZT, or even more important when the heat source is unlimited or free,91,92 because a high PF leads to a large output power density for given working boundary conditions. The mechanical strength of thermoelectric materials should be good enough to realize a high performance, otherwise the manufacturing will be difficult and reliable operation of the TEG devices will be almost impossible. In addition, the toxicity, abundance, and price of the constituent raw materials are also critical factors for facilitating widespread applications. For module and system assembly, a low contact resistance, simple fabrication and assembling procedure, cost-effectiveness, and good reliability are distinguishing attributes that require special attention.
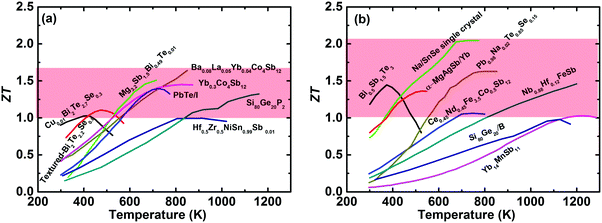 | ||
| Fig. 1 (a) and (b) Temperature-dependent ZT of the state of the art of bulk advanced n-type and p-type thermoelectric materials,27,78–90 respectively. | ||
It is well known that Bi–Sb–Te alloys are unique promising p-type thermoelectric materials for applications around room temperature,24,63,93,94 but the strong bipolar effect severely degrades their performance above 373 K.63 Furthermore, tellurium (Te) is an extremely scarce element in the earth's crust, and its earth abundance (0.001 ppm) is even much lower than that of gold (Au) ∼0.004 ppm.95 Therefore, the search for a better alternative without Te operating at higher temperature is necessary and important in thermoelectric material research. Several new p-type Te-free thermoelectric materials with a relatively high ZT have been discovered in the last decade, such as Zn4Sb3,96–98 AgSbSe2,99–101 BiCuSeO,102–104 Cu12Sb4Sb13,105,106 and SnSe (single crystal)-based materials.88,107,108 Among these, Na-doped SnSe single crystal (b axis) has shown a high room temperature PF (∼40 μW cm−1 K−2) and a high ZT (∼0.7) due to the combination of multiple electronic valence bands and high anharmonic bonding.88 This seems to suggest it would be a good candidate for power generation. However, the very poor mechanical properties of the layered structure prevent its practical applications. Other compounds show relatively low PFs and maximum values below 573 K of only around 15 μW cm−1 K−2.98,100,103,106 Thus, it is still imperative to discover more really promising candidates for low-temperature power generation.
Recently, α-MgAgSb has been demonstrated as a promising p-type candidate for power generation below 550 K.109–120 α-MgAgSb shows the typical degenerate semiconductor behavior and satisfies the PGEC criteria, and consequently it has received intensive attention since 2012.109–116,118–126 It has a high average ZT over the whole measured temperature range, coupled with a relatively high PF and good mechanical properties.111,118 Moreover, a record high conversion efficiency of 8.5% for a single leg was experimentally demonstrated at an operating temperature difference of 225 K in combination with a simple fabrication process.111 In this review, we first introduce the phase transition and fabrication methods. Then, the origin of the PGEC behavior of the pristine compound is discussed and current strategies to further enhance the TE performance are presented. Finally, the single-leg device fabrication and conversion efficiency measurements are highlighted.
2. Phase transition and fabrication method
As first reported by Kirkham et al.,109 MgAgSb has complicated phase transitions from the room-temperature α phase to the intermediate-temperature β phase and finally to the high-temperature γ phase. α-MgAgSb and β-MgAgSb have a tetragonal distorted structure, while γ-MgAgSb has a cubic half-Heusler structure. The main difference in the three MgAgSb structures lies in the filling pattern of the Ag atom in the Mg–Sb cubes.109 α-MgAgSb can be described as a distorted Mg–Sb rocksalt sublattice rotated by 45° along the c axis (Fig. 2a). With increasing the temperature, a tendency of increasing structural symmetry can be observed. β-MgAgSb exhibits a similar structure with the Cu2Sb compound, where each Ag and Mg atom replaces one of the two Cu atoms (Fig. 2b). However, the actual composition largely deviates from the nominal stoichiometric ratio, probably containing a high concentration of Ag and Sb vacancies.127 Based on the maximum entropy method (MEM) analysis and experimental results, γ-MgAgSb tends to have the MgAgAs structure (Fig. 2c),127 rather than the first proposed MgCuSb structure.109 γ-MgAgSb has a highly disordered structure, where the Sb sublattice forms an anion framework with the mixed sites of Mg and Ag as well as vacancies, but it will continuously decompose at high temperatures.127 Due to the fact that α-MgAgSb has shown promising low-temperature thermoelectric performance, in the following parts we only discuss its related details, spanning from a material-level understanding to device-efficiency measurements.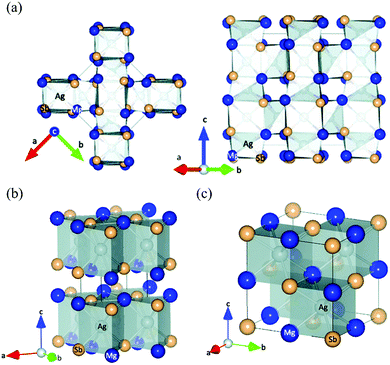 | ||
| Fig. 2 (a) Crystal structure of the room-temperature α-MgAgSb phase, looking along the (left) 〈001〉 and (right) 〈110〉 directions; (b) and (c) crystal structure of the β-MgAgSb phase and the high-temperature γ-MgAgSb phase, respectively. All the figures are drawn to include atoms outside the unit cell in order to emphasize the distorted rocksalt lattice of Mg and Sb atoms, with Mg shown in dark blue, Sb in light tan, and Ag in silver inside the polyhedra.109 Reproduced with permission from ref. 109. Copyright 2012 American Physical Society. | ||
Since α-MgAgSb undergoes complicated phase transitions, it is a big challenge to obtain the pure phase using the traditional method. Kirkham et al. first tried to prepare α-MgAgSb using a vacuum-melting and hot-pressing method.109 However, the high content of secondary phases, namely Sb and Ag3Sb, could be detected in their specimens (Fig. 3a). Ying et al. applied a long-time annealing process that could reduce the content of the impurity phases to a mass fraction around 2% (Fig. 3b).114 Meanwhile, the maximum ZT could be enhanced somewhat from 0.56 at 423 K to 0.83 at 525 K.109,114 Zhao et al. employed a simple and novel two-step ball milling method in combination with a quick hot-pressing process, which allowed them to finely tune the composition from MgAgSb to MgAg0.97Sb0.99 and to successfully fabricate nanostructured α-MgAgSb without any detectable impurity phases within the detection limit of XRD analysis (Fig. 3c).110 The corresponding maximum ZT was around 1.2 at 548 K (Fig. 3d),110 which is much higher than other results,109,114 which could be attributed to the typical PGEC features.
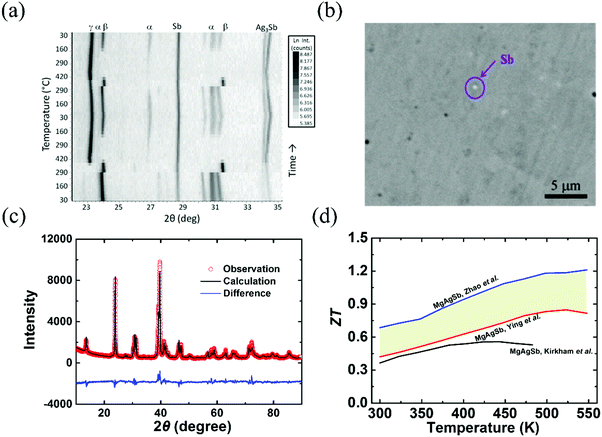 | ||
| Fig. 3 (a) Non-ambient X-ray diffraction (XRD) data collected on MgAgSb over two cycles of heating and cooling between 300 K and 693 K (Kirkham et al.).109 Reproduced with permission from ref. 109. Copyright 2012 American Physical Society. (b) Back scattering electron image of the α-MgAgSb0.99In0.01 sample (Ying et al.).114 Reproduced with permission from ref. 114. Copyright 2015 American Chemical Society. (c) XRD pattern with the corresponding Rietveld refinement of the hot-pressed nanostructured α-MgAg0.97Sb0.99 alloy (Zhao et al.),118 Reproduced with permission from ref. 118. Copyright 2017 Elsevier B.V. (d) Comparison of the ZT-dependent temperature for the above-mentioned three samples.109,110,114 | ||
3. “Phonon glass electron crystal” behavior
In 1957, Ioffe first defined the quantity “Z” to evaluate the thermoelectric performance.17 Meanwhile, there was a shift in thermoelectric research from metals to narrow-gap semiconductors at that time.17,21,128–130 Promising thermoelectric materials should possess good electronic properties and also low thermal conductivity, following the PGEC design concept.14,131 At the microscale level, this means that the phonon's mean free path should be as small as possible and the electron's mean free path should be as large as possible. As expected, highly degenerative semiconductors can be designed to enable the efficient transmission of charge carriers (high PF), while largely impeding the flow of phonons by the lattice or defects (low κlat). Fig. 4 presents the PF dependence of κlat at room temperature for advanced thermoelectric materials.29,42,82,85,88,90,91,98,102,132–139 It seems that materials with a high (or low) PF usually exhibit a high (or low) κlat. Clearly, α-MgAgSb showed a relatively high PF in combination with a low κlat. In the next section, we describe its PGEC behavior and discuss the corresponding origin.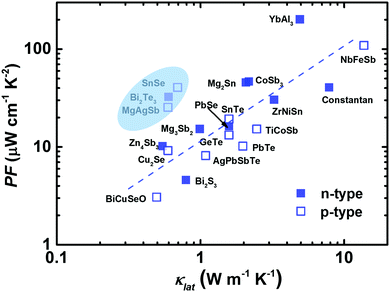 | ||
| Fig. 4 The lattice thermal conductivity κlatversus the power factor PF for the state of the art of bulk advanced n-type (solid blue square) and p-type (open blue square) thermoelectric materials.29,42,82,85,88,90,91,98,102,132–139 | ||
3.1 Low lattice thermal conductivity-phonon glass
An in-depth understanding of the phonon transport behavior is considered to be a prerequisite for developing high thermoelectric performance materials. In fact, Slack's proposal (PGEC) originally focused on the “glass-like” thermal conductivity,14 which was soon realized in filled skutterudites and intermetallic clathrates with rattling atoms in the host framework.39,40 In addition, some noncaged compounds, such as Zn4Sb3,96,97 CdSb, and α-MgAgSb,110,140 also exhibit the PGEC behavior with low κlat. Generally, a low κlat is strongly associated with intrinsic features of a crystal's structure, microstructural defects, or lattice dynamic properties. Next, we discuss the microscopic origin of the low κlat of α-MgAgSb in regard to the above-mentioned critical aspects. | (1) |
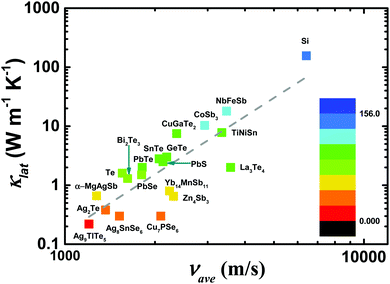 | ||
| Fig. 5 The average sound velocity νaveversus the lattice thermal conductivity κlat conductivity for typical thermoelectric materials.87,121,145–155 | ||
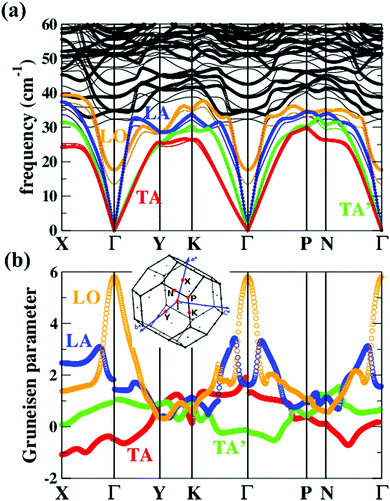 | ||
| Fig. 6 (a) Phonon dispersions and (b) the corresponding Grüneisen dispersions of MgAgSb. The thick lines and thin lines in the top panel represent the phonon dispersions at the DFT equilibrium volume and the expansion cell (+4%), respectively. The red, green, blue, and orange lines highlight the TA, TA′, LA, and LO phonon branches, respectively. The inset is the first Brillouin zones of MgAgSb with the high-symmetry points (red points) considered in our current calculations.120 Reproduced with permission from ref. 120. Copyright 2017 Elsevier B.V. | ||
Except for the low-lying acoustic branches, one extremely anomalous longitudinal optical (LO) branch (orange) can be also observed in Fig. 6. The boundary frequency of the LO branch at the Γ point is extremely low (∼17 cm−1), lower than most of the thermoelectric materials.107,156 The existence of a low-lying LO branch can be also reflected by the Einstein modes fitting the low-temperature heat capacity.126 Except for this abnormal LO branch, the other optical branches also have low frequencies, which is related with the multicenter bonding interactions caused by the lattice distortion.140,158 The Mg–Ag–Sb forms a close-packed three-center bonding scheme in α-MgAgSb (Fig. 7a) and the charge density difference of α-MgAgSb shows that the maximum charge density accumulation of the three-center bond is located within the triangle (Fig. 7b), in contrast with two-center bonding and the non-interacting Mg–Sb in the half-Heusler γ-MgAgSb (Fig. 7c and d).126
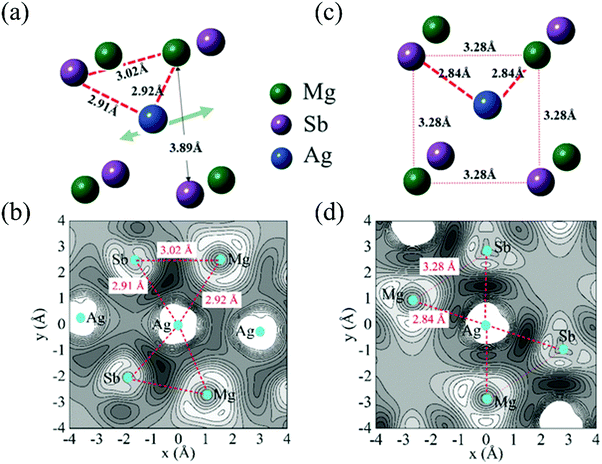 | ||
| Fig. 7 (a) and (b) The structural unit and related charge density differences for α-MgAgSb, respectively; (c) and (d) the structural unit and related charge density differences for γ-MgAgSb, respectively.126 Reproduced with permission from ref. 126. Copyright 2017 Wiley-VCH. | ||
Umklapp scattering, known as the U-process, dominates the phonon MFP of solids at high temperature, where the Grüneisen parameter γ is the decisive factor for the anharmonic scattering strength. Both the LA and LO branches possess much higher Grüneisen parameters, compared with those of the two TA branches (Fig. 6b). Specifically, the maximum Grüneisen parameter of the LO branch around the Γ point is extraordinarily high at ∼5.8. The average corresponding Grüneisen parameters (![[small gamma, Greek, macron]](https://www.rsc.org/images/entities/i_char_e0c4.gif) ) of the three acoustic branches were calculated based on
) of the three acoustic branches were calculated based on  . The
. The ![[small gamma, Greek, macron]](https://www.rsc.org/images/entities/i_char_e0c4.gif) of the LA branch is about 1.9, surpassing that of the TA (∼0.8) and TA′ (∼0.6) branches by a factor of 2. Besides, the sudden change of Grüneisen parameters as well as phonon dispersion around the Γ point for the LA and LO branches demonstrate the “avoided-crossing” interaction, which was also observed in PbTe and Cu3SbSe3.159,160 It was reported that the strong anharmonic coupling between the transverse optical (TO) and longitudinal acoustic (LA) branches play a pronounced role in the low κlat in PbTe, as found using a combination of inelastic neutron scattering measurements and first-principles computation.159 Tian et al. further demonstrated that the contributions of optical phonons remained about 25% for PbSe and 22% for PbTe over the whole temperature range (300–700 K).156 However, given the complex crystal structure of α-MgAgSb, it is rather difficult to quantitatively calculate the contribution of this LO branch.
of the LA branch is about 1.9, surpassing that of the TA (∼0.8) and TA′ (∼0.6) branches by a factor of 2. Besides, the sudden change of Grüneisen parameters as well as phonon dispersion around the Γ point for the LA and LO branches demonstrate the “avoided-crossing” interaction, which was also observed in PbTe and Cu3SbSe3.159,160 It was reported that the strong anharmonic coupling between the transverse optical (TO) and longitudinal acoustic (LA) branches play a pronounced role in the low κlat in PbTe, as found using a combination of inelastic neutron scattering measurements and first-principles computation.159 Tian et al. further demonstrated that the contributions of optical phonons remained about 25% for PbSe and 22% for PbTe over the whole temperature range (300–700 K).156 However, given the complex crystal structure of α-MgAgSb, it is rather difficult to quantitatively calculate the contribution of this LO branch.
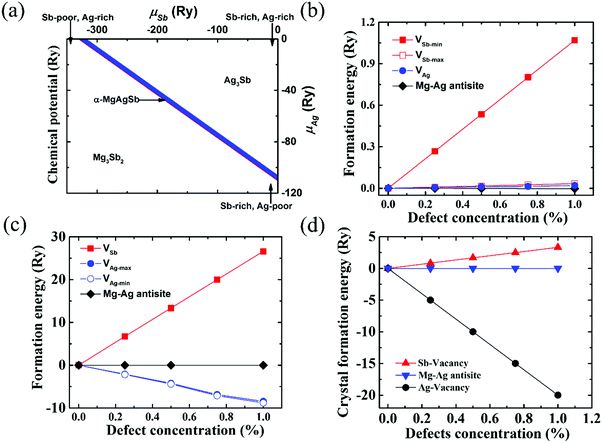 | ||
| Fig. 8 (a) Calculated range of the chemical potentials of Ag and Sb (μAg and μSb) in α-MgAgSb, namely the stability area of the Mg–Ag–Sb systems in the two-dimensional (μAg, μSb) diagram; (b) defect formation energies in the Ag-rich and Sb-poor environments. VAg represents the formation energies of a Ag vacancy with different concentrations; VSb-max and VSb-min represent the formation energies of a Sb vacancy with different concentrations for the maximum and minimum μSb, respectively; (c) defect formation energies in the Ag-poor and Sb-rich environments. VAg-max and VAg-min represent the formation energies of a Ag vacancy with different concentrations for the maximum and minimum μAg, respectively; VSb represents the formation energies of a Sb vacancy with different concentrations; (d) crystal formation enthalpy of α-MgAgSb with different defect types and concentrations.115 Reproduced with permission from ref. 115. Copyright 2016 Royal Society of Chemistry. | ||
There are three types of Ag atoms in α-MgAgSb: Ag1 atoms on the corners of the lattice, Ag2 atoms on the lattice edges of the c′ axis, and Ag3 atoms on the lattice edges of the a′ and b′ axes, where a′, b′, and c′ are the unit cell lattice parameters of the tetragonal sublattice (Fig. 9a). Recently, Mi et al. used the Rietveld refinement in high-resolution synchrotron radiation powder X-ray diffraction and revealed the much larger atomic displacement parameters (ADPs) of the Ag1 atoms at the 4a position compared with that of the other atoms (Fig. 9b), which indicated a possible strong atomic disorder of Ag atoms in α-MgAgSb.127 The formation of Ag vacancies is primarily related to the weak Ag–X chemical bonding. Vacancies cause a larger mass difference and strain fluctuation than normal doping or substituting, which is more effective for scattering phonons with a short wavelength, which thereby largely reduces κlat, as already demonstrated in various systems.165–170 Therefore, a certain concentration of Ag vacancies in the crystal is also responsible for the intrinsically low κlat of α-MgAgSb.
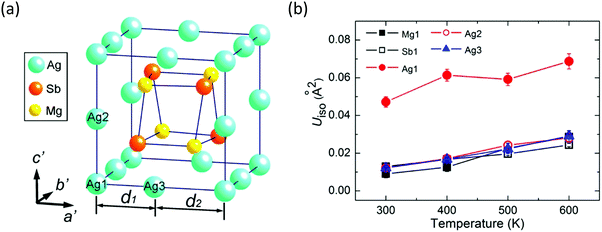 | ||
| Fig. 9 (a) Tetragonal sublattice showing a Mg4Sb4 distorted hexahedron located in the cage formed by the Ag atoms; (b) temperature dependence of isotropic atomic displacement parameters ADPs (Uiso) for different atoms of α-MgAgSb.127 Reproduced with permission from ref. 127. Copyright 2017 American Chemical Society. | ||
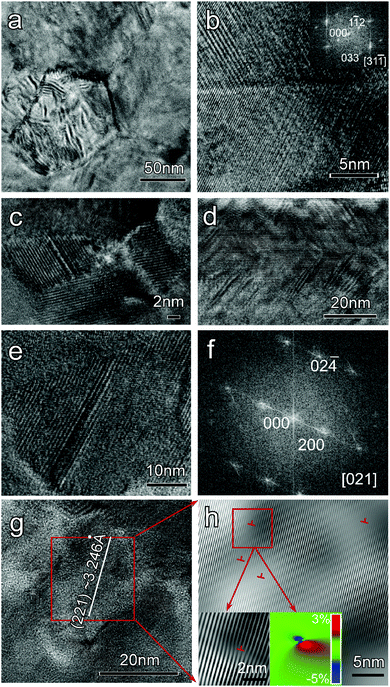 | ||
| Fig. 10 Typical microstructures for nanostructured α-MgAgSb. (a) Medium magnification TEM image showing the mesoscale grains; (b) high-magnification TEM image of the grain boundary showing good crystallization; the inset corresponds to the fast Fourier transformation (FFT) image along the C zone axis direction; (c) high-magnification TEM image showing nanoinclusions; (d) high-magnification TEM image showing high density stacking faults; (e) high-magnification TEM image showing the specific morphology of a stacking fault; (f) FFT image along the [021] direction; (g) high-magnification TEM image showing a large quantity of dislocations inside the grain; (h) corresponding inverse FFT (IFFT) images showing a high density of dislocations with the enlarged dislocations and GPA analysis images as insets.117 Reproduced with permission from ref. 117. Copyright 2016 Wiley-VCH. | ||
Microstructural defects with different dimensions are targeted to scatter phonons with a comparable size.173,174 Generally, the effective scattering rate τeff−1 can be evaluated by Matthiessen's rule:  , where τI−1 represents the relaxation times of a specified type of defect. Grain boundaries have a phonon scattering rate given by: τGB−1 ∼ ω0, independent of the phonon frequency, which has a stronger interaction with low-frequency phonons. Nanoprecipitates can scatter phonons in a wider range of frequencies, based on τNP−1 ∼ ω0 + ω4. The dislocations are displayed as the scattering centers targets for mid-frequency phonons, where the phonon scattering rate arising from the dislocation core and the strain field are given by τDC−1 ∼ ω3 and τDS−1 ∼ ω, respectively. Combined with the above-mentioned Ag vacancies, which are preferable to scatter phonons with high frequencies with τPD−1 ∼ ω4, this hierarchical microstructure could further suppress the thermal conductivity of α-MgAgSb in comparison with the perfect crystal due to scattering of the broad-frequency phonons. Due to the fact that a high density of boundaries and interfaces as well as defects could effectively block phonon transport (much lower lattice thermal conductivity) with little deterioration of the charge carrier mobility (comparable mobility), nanostructured α-MgAgSb has a much higher ZT (1.2 at 550 K) than that of α-MgAgSb with coarse grains (0.8 at 550 K).114,119
3.2 High power factor-electron crystal
In thermoelectric science, it is relatively easy to identify low thermal conductivity materials according to some effective material selection guidelines, such as a heavy atomic mass, complex unit cell, weak chemical bonding, anharmonic bonding.175,176 In contrast, it is difficult to discover high power factor materials due to a lack of intuitively valid strategies.For a given scattering mechanism and optimal carrier concentration, the weighted mobility U = μ(m*/m0)3/2 determines the maximum power factor, where μ is the carrier mobility, m* is the total density-of-states effective mass, and m0 is the free electron mass.9 In the classical approximation, however, there is a negative correlation between the carrier mobility and effective mass for common scattering mechanisms; for example, for ionized impurity scattering μ ∝ (m*)−1/2 and acoustic phonon scattering μ ∝ (mb*)−3/2(mI*)−1, where mb* is the density-of-states effective mass for each pocket and mI* is the inertial mass of the carriers along the conducting direction (mI* is equal to mb* for an isotropic band). Thus, it is imperative to rationally balance μ and m* to design high PF materials. Generally, heavy (light) carriers diffuse with low (high) velocities, but α-MgAgSb exhibits a large m* coupled with a high μ. Next, we discuss the effect of those two decisive parameters on the electrical transport properties.
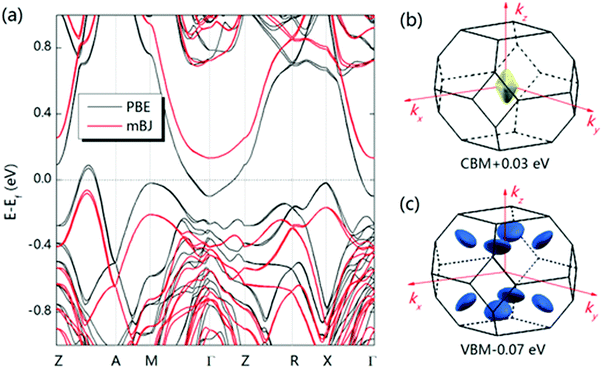
A large m* could be a consequence of either a high band degeneracy Nv or a heavy mb* via m* = Nv2/3mb*. Here, it should be mentioned that the initial results show the valence band maximum (VBM) of α-MgAgSb locating at point X, which results in a low Nv of ∼2.114,115,124,125 Subsequent work pointed out a high Nv of 8 for the VBM located between Z and A (Fig. 11a).122,163,164,177Fig. 11b and c show the Fermi surface near the conduction band minimum (CBM) and valence band maximum (VBM),177 respectively. Clearly, there is only one electron pocket, whereas the number of hole pockets is eight. In fact, Nv is usually below 4 for the majority of thermoelectric materials and a high Nv is a general sign of a high PF for advanced thermoelectric materials,52e.g., 6 for Bi0.4Sb1.6Te3,182 6 for Mg2Si0.3Sn0.7,28 6 for n-type Mg3Sb2,183 8 for p-type MFeSb (M = V, Nb),184 12 or more for p-type PbTe0.85Se0.15,27 and 12 or more for n-type YbxCo4Sb12.32
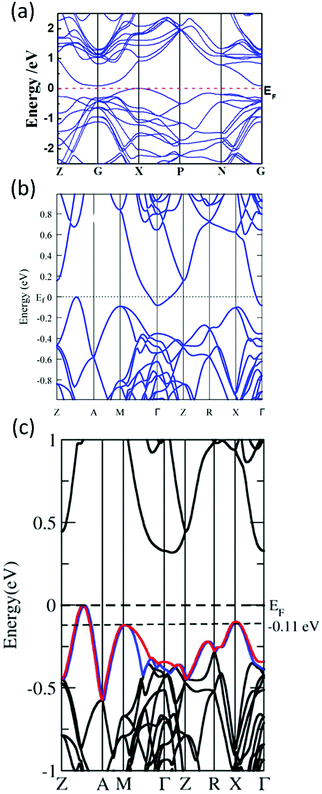 | ||
| Fig. 12 (a)–(c) Calculated band structure for α-MgAgSb by using the LDA functional implemented in VASP (Ying et al.),114 GGA-PBE functional implemented in VASP (Miao et al.)122 and TB-mBJ functional implemented in WIEN2k (Feng et al.),162 respectively. Reproduced with permission from ref. 114. Copyright 2015 Wiley-VCH, ref. 122. Copyright 2015 American Chemical Society and ref. 162. Copyright 2017 Nature Publishing Group. | ||
Generally, the mobility is hardly affected by the high Nv in semiconductors if the intervalley scattering is negligible. Considering the high Nv = 8 for α-MgAgSb, a relatively heavy band mb* = 0.6m0 can be obtained, which is much lower than that of half-Heusler alloys with strong d–d and (s, p-hybridized)–d interactions.157 Since the mobility is inversely proportional to the inertial mass mI* according to μ = τe/mI*, where τ is the relaxation time and e is the electron charge, a lower mb* results in a higher mobility for α-MgAgSb in comparison with half-Heusler alloys.157
4. Strategies to enhance thermoelectric performance
4.1 Optimizing carrier concentration to increase power factor
As previously discussed, α-MgAgSb has a large m* that requires a high optimal carrier concentration nopt to achieve good electrical transport properties due to the relationship of nopt ∝ (m*T)3/2.52 The calculated room-temperature nopt is about 9 × 1019 cm−3 based on the single parabolic band model with acoustic phonon scattering as the dominant carrier scattering mechanism. However, pristine α-MgAgSb has a relatively low carrier concentration n of around 2.7 × 1019 cm−3 at room temperature. Thus, various dopants have been utilized to increase the carrier concentration and then to enhance the power factor, including alkali metals (Li and Na) and divalent metals (Ca and Yb) doping on the Mg site, as well as by tuning the Sb content.112,116,119,120 In addition, doping on the Sb site has also been studied to compare the role of doping at cation and anion sites on the carrier transport behavior.119 It should be mentioned that the doping effect of isoelectronic elements is possibly caused by the change in the bandgap or intrinsic defect formation energy.186,187 In this section, we summarize the electrical transport properties and discuss the principles behind doping.It is obvious that Li is the most effective dopant to supply holes, compared with other dopants (Fig. 13a).112,113,116,117,119,120 The maximum carrier concentration in Li-doping is around 1.2 × 1020 cm−3, more than 5 times higher than that of the pristine α-MgAgSb. This may be caused by the small difference in ionic radius between Li (60 pm) and Mg (66 pm). Fig. 13b–d show the electrical transport properties for the optimum composition for different dopants.112,113,116,117,119,120 Due to the increased carrier concentration upon doping, the electrical resistivity is decreased somewhat (Fig. 13b). As expected, the Li-doped sample has the lowest electrical resistivity, around 1.3 × 10⁻⁵ Ω m at room temperature. In addition, the electrical resistivity of all the samples fitted the temperature dependence of T3/2 before the intrinsic excitation, indicating that the carrier transport mechanism is mainly dominated by acoustic phonon scattering in the low-temperature range. Concurrently, the decreased electrical resistivity also leads to a decreased Seebeck coefficient (Fig. 13c). In addition, a strong bipolar effect leads to the appearance of a peak Seebeck coefficient below 400 K owing to the very small band gap or semimetal characteristics. Finally, the power factor could be enhanced by about 20–30% over the entire temperature range upon doping, and the highest almost constant PF of ∼25 μW cm−1 K−2 from 300 to 548 K could be achieved by Li-doping (Fig. 13d). Theoretically, Miao et al. and Sheng et al. predicted that the power factor could be enhanced via hole-doping using first-principles simulations and the Boltzmann transport theory within the constant relaxation time approximation.122,124 The experimental results for tuning the carrier concentration to enhance the power factor were consistent with the aforementioned prediction. Since doping on the Sb site shows some different but interesting behaviors, herein we separately discuss the corresponding underlying mechanism.
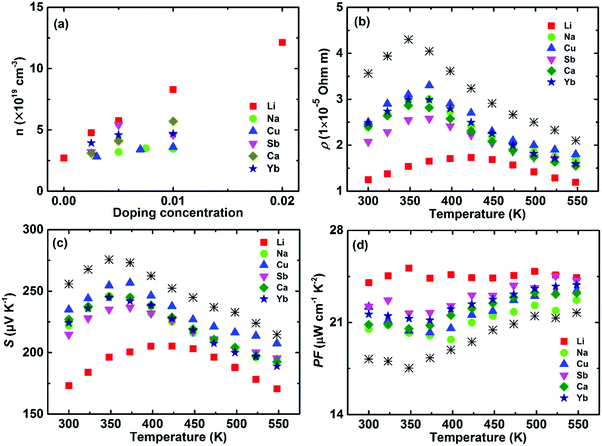 | ||
| Fig. 13 Thermoelectric properties of α-MgAgSb-based materials, including Li-, Na-, Cu-, Ca-, and Yb-doping as well as tuning the Sb content. (a) Doping-concentration-dependent carrier concentration; temperature-dependent (b) electrical resistivity ρ, (c) Seebeck coefficient S and (d) power factor PF for the above-mentioned optimized composition.112,113,117,119,120 | ||
In order to quantitatively clarify the effect of the carrier concentration and doping site on the electrical transport properties, theoretical calculations were performed based on the single parabolic band model with acoustic phonon scattering (Fig. 14).119 Here the solid and open symbols represent the room-temperature experimental data, including Li-, Ca-, and Yb-doping at the Mg site as well as As-, Bi-, Sn-, and Pb-doping at the Sb site.119,120Fig. 14a shows that the carrier mobility reduction by doping at the Mg site matches well with the theoretical model. In contrast, dopants at the Sb site give rise to a lower carrier mobility. Therefore, doping at the Mg site could realize a lower electrical resistivity, compared with doping at the Sb site (Fig. 14b). All the experimental data (Seebeck coefficient vs. carrier concentration) fall nearly on the calculated Pisarenko plot with m* = 2.4m0 (Fig. 14c). This illustrates that the doping can be described in the framework of a rigid band model that only changes the Fermi energy and tunes the carrier concentration. Therefore, the band structure is almost unchanged upon doping and the doping site is irrelevant. Finally, the power factor of doping at the Mg site is basically in accordance with the theoretical model, but obviously higher than that from doping at the Sb site (Fig. 14d).
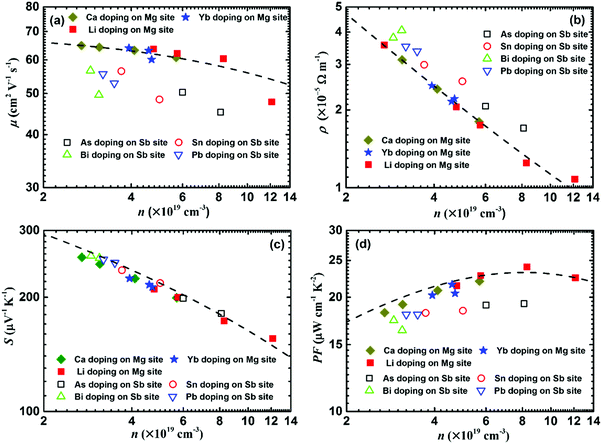 | ||
| Fig. 14 Carrier-concentration-dependent electrical transport properties of α-MgAgSb-based materials, including the dopants Li, Ca, Yb, As, Bi, Sn, and Pb. (a) Carrier mobility μ, (b) electrical resistivity ρ, (c) Seebeck coefficient S, and (d) power factor PF. The dashed lines are calculated based on the single parabolic band model with the acoustic phonon scattering mechanism.117,119,120 | ||
The critical difference in the carrier transport behavior of doping at the Mg site and Sb site can be attributed to the introduced perturbation to the valence band when doping at the Sb site, which is somehow analogous to low-temperature Anderson localization.188 In general, the valence band maximum is mainly dominated by anion atomic orbitals, while the conduction band minimum is mainly dominated by cation atomic orbitals.189 Due to the fact that the high total DOS of the heavy valence band is predominantly decided by the p orbital of Sb,114 doping at the Sb site would introduce perturbation to the valence band, while doping at the Mg site will have less extra influence on the valence band. Therefore, doping at the site that has less influence on the charge-conducting band should be a critical doping principle in the thermoelectric field.
Except for tuning the carrier concentration upon doping, the associated point defect scattering could generate additional phonon scattering and reduce the lattice thermal conductivity κlat due to the mass fluctuation and surrounding strain field fluctuation based on the Rayleigh-type scattering mechanism.141,190,191 The calculated phonon mean free path l of α-MgAgSb was around 0.53 nm, indicating that phonon scattering by point defects is an effective strategy to further reduce κlat for α-MgAgSb. Yb-doping plays a more effective role in suppressing κlat, compared with other doping (Fig. 15a).117,119,120 Due to the enhanced power factor and significantly suppressed κlat, Yb-doping exhibited a higher ZT over the whole measured temperature range.117,119,120 Specifically, the average ZT was improved from 1.0 for pristine α-MgAgSb to 1.1 (Li-doping),117 1.1 (Ca-doping),119 and 1.2 (Yb-doping) (Fig. 15b).120
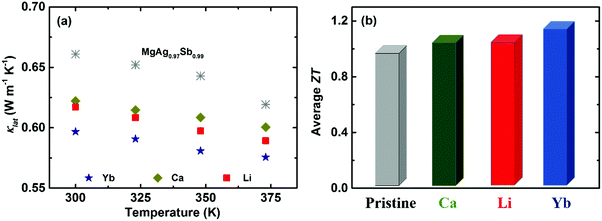 | ||
| Fig. 15 (a) Temperature-dependent lattice thermal conductivity κlat and (b) average ZT from 300 K to 548 K for Li-, Ca-, and Yb-doped α-MgAgSb.117,119,120 | ||
4.2 Intrinsic Ag vacancy engineering to suppress lattice thermal conductivity
Intrinsic point defects engineering to optimize the thermoelectric performance has been reported in some thermoelectric systems, e.g., (Bi, Sb)2(Te, Se)3192 and Mg2(Si, Sn).193 Previous calculations have demonstrated that a Ag vacancy is the dominant intrinsic point defect in α-MgAgSb. Controlling the hot-press temperature could manipulate the Ag vacancy concentration due to the recovery effect, which is generally assumed as the thermal relaxation process to counter the native defects or donor-like effect in semiconductors.64,115 It is noted that earlier researchers were mainly concerned about the consolidation aspect for powder metallurgy technology,9 but a few reports focused on the manipulation of intrinsic lattice defects for semiconductors.194–196Fig. 16a shows that the carrier concentration decreases from 4 × 1019 cm−3 to 2.7 × 1019 cm−3 and then increases up to 4.1 × 1019 cm−3 by simply varying the hot-press temperature.115 The reduction in the carrier concentration is mainly related to the recovery effect under the hot-press process while the increment is caused by the appearance of a second phase when hot pressed at 593 K and 613 K. The carrier mobility monotonically increases with hot-pressing temperature as a result of a weaker scattering of charge carrier from Ag vacancies and a sharp grain growth related with the phase transformation (Fig. 16a). The power factor decreases somewhat with increasing the hot-pressing temperature from 533 K to 573 K, while a higher temperature-independent power factor could be achieved at a higher hot-press temperature owing to the concurrent increased carrier concentration and mobility (Fig. 16b).
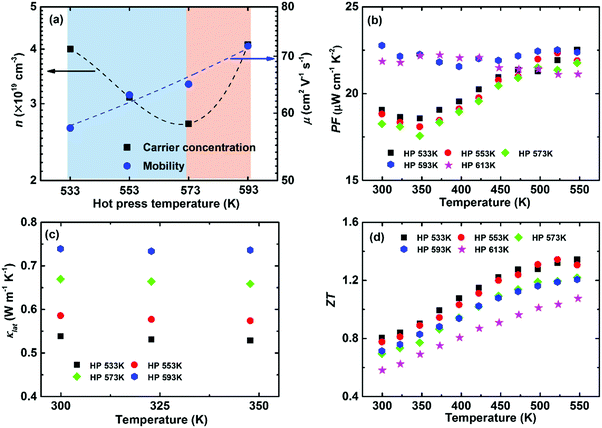 | ||
| Fig. 16 Thermoelectric properties of α-MgAgSb hot-pressed at different temperatures. (a) Doping-concentration-dependent carrier concentration and mobility; temperature-dependent (b) power factor PF, (c) lattice thermal conductivity κlat and (d) ZT.115 Reproduced with permission from ref. 115. Copyright 2016 Royal Society of Chemistry. | ||
Controlling Ag vacancies has a more profound effect on the phonon transport process, whereby κL gradually decreases with the decreased hot temperature (Fig. 16c). For example, the room-temperature κlat decreases from 0.66 W m−1 K−1 (573 K) to 0.54 W m−1 K−1 (533 K) due to the increased Ag vacancy concentration, which is even lower than that of Yb-doping (∼0.59 W m−1 K−1).120 Since a vacancy would cause a larger mass difference and strain fluctuation than normal doping or substituting, it would maximize the mass and strain fluctuations. Thus, a vacancy could more effectively scatter the phonons with high frequencies, enabling a significant suppression of κlat. Benefiting from the sharply reduced κlat, a high peak ZT of ∼1.3 and an average ZT of ∼1.1 could be realized when hot pressed at 533 K (Fig. 16d).
4.3 Other feasible approaches in theory
Miao et al. performed theoretical calculations for the volume dependence of S and PF for α-MgAgSb along both the xx and zz directions using first-principles simulations and Boltzmann transport theory within the constant relaxation time approximation.122 A volume compression of 2% resulted in an increment of S of about 25% along both directions at the optimal chemical potential. Meanwhile, it enhanced the value of PF/τ around 10% at the chemical potential of −0.1 eV, where τ is the relaxation time. In the same way, they also reported that the thermoelectric properties of α-MgAgSb could be dramatically improved with the applied hydrostatic pressure, which was attributed to the pressure-induced semimetal-to-semiconductor transition.Recently, Tan et al. pointed out that band engineering may improve the thermoelectric performance of α-MgAgSb.177 Based on a careful analysis of the Fermi surface, they showed that the number of degenerate valleys in α-MgAgSb could be largely enhanced by tuning the Mg-s or Ag-d orbitals, e.g., Mg1−xZnxAgSb and MgAg1−xPdxSb, and finally a high ZT of 2.0 was predicted, which would be interesting if it could be experimentally demonstrated. Similarly, Feng et al. reported that control of the Ag–Mg antisite defects could significantly increase the thermoelectric performance of α-MgAgSb by increasing the number of band valleys near the Fermi level.163
5. Mechanical properties
Since thermoelectric materials usually work under a cyclic temperature gradient, sometimes even under severe mechanical vibration, poor mechanical properties could lead to crack generation and consequently a deterioration in performance under thermal stress.15,60 A material's mechanical robustness should be good enough to realize a high thermoelectric performance as well as reliable operation. Besides, poor mechanical properties increase the difficulty of the machining, manufacturing, and assembling processes. Fig. 17 shows the mechanical properties of nanostructured α-MgAgSb in comparison with other promising p-type thermoelectric materials working at a low to medium temperature range.94,118,197–207 Because of the global weak bonding of α-MgAgSb, its Young's modulus is about 55.0 GPa, comparable with BiSbTe and II–VI (II = Pb or Sn, VI = Te or Se) compounds,197–200 but much lower than that of p-type nanostructured filled skutterudite (Fig. 17a).204 In contrast, the hardness (3.3 GPa), compressive strength (389.6 MPa), and fracture toughness (1.1 MPa m1/2) of α-MgAgSb are almost comparable with that of p-type skutterudite (Fig. 17b–d),203,204 which is possibly related with the boundaries and interfaces hardening and toughening effect,208–211 benefiting from the multiscale microstructure of nanostructured α-MgAgSb. In real applications, the relatively good mechanical properties of nanostructured α-MgAgSb could enable the realization of a high theoretical conversion efficiency for devices.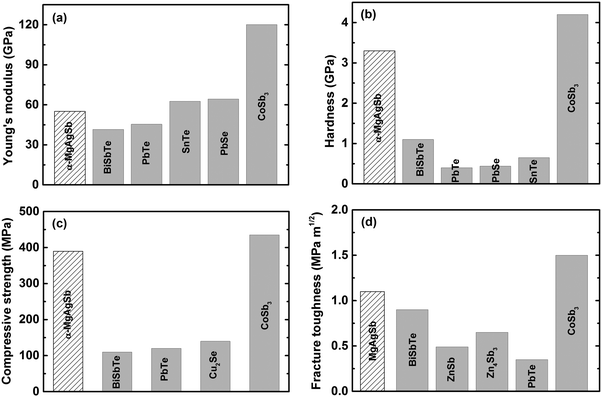 | ||
| Fig. 17 Comparison of the mechanical properties of nanostructured α-MgAgSb with other promising p-type thermoelectric materials working at a low to medium temperature range. (a) Young's modulus, (b) hardness, (c) compressive strength and (d) fracture toughness.118 Reproduced with permission from ref. 118. Copyright 2017 Elsevier B.V. | ||
6. Single-leg device fabrication and conversion efficiency
In real applications, good electrical and thermal contacts are necessary for a thermoelectric module to realize its expected efficiency potential. Generally, a metallized contact layer is designed between thermoelectric materials and interconnects to act as an elemental diffusion barrier.60,61 Conventional methods to fabricate the contact layer primarily conclude with sputtering or electroplating/chemical vapor deposition methods.61 However, sputtering is not a promising scalable method for mass production due to its both costly and time-consuming features, especially for high operating temperatures that need relatively thick contact layers.60,61 The electrochemical deposition process sometimes can result in a weak bonding strength.60 Kraemer et al. adopts a simple one-step hot-press technique to fabricate the single α-MgAgSb leg with a silver pad on the top and bottom surfaces with low resistance and high mechanical strength (Fig. 18a),111 which eliminates the typically required sample metallization process. The sample for the efficiency measurements was about 3 mm × 3 mm × 5 mm, with silver contact pads between 0.25 and 0.35 mm thick (Fig. 18b). A clean and well-defined interface between the α-MgAgSb-based compound and the Ag contact pad could be clearly observed after the fabrication process (Fig. 18c). The contact resistance below 10 μΩ cm2 was measured by a home-made scanning voltage probe with a typical current of 0.1 A (Fig. 18d). The reasons for choosing a silver contact were threefold: first, silver has a high electrical and thermal conductivity and is also easy to solder because of its softness; Second, the thermal expansion coefficient of silver (19.5 × 10⁻⁶ K−1) is well-matched with that of α-MgAgSb (20 × 10−6 K−1),111 which could avoid the severe interface stress; Third, silver is one of the component elements that can reduce elemental diffusion due to a smaller concentration gradient. All these attributes contribute to obtaining a mechanically strong and thermally stable bond with low electrical interface resistance.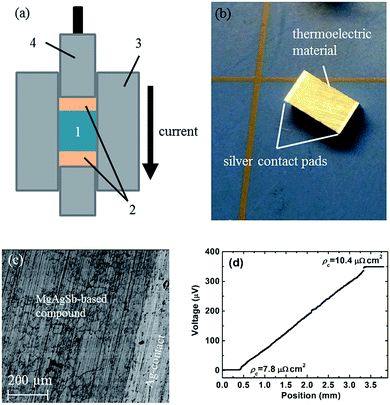 | ||
| Fig. 18 Thermoelectric sample fabrication with electrical contact pads using a hot-press technique. (a) Thermoelectric material powder (1) is sandwiched between electrical contact pad materials (2) inside the graphite die (3) of the hot-press. While a graphite piston (4) applies pressure, the current flowing through the piston, die, and materials increases the hot-press temperature; (b) α-MgAgSb sample as fabricated with a three-step process (ball milling, hot-pressing, cutting) with silver contact pads with a thickness of 0.25–0.35 mm on each end; (c) SEM pictures showing a clean and well-defined interface between α-MgAgSb and the silver contact pad; (d) the measured contact resistance between α-MgAgSb and the silver contact pad.111 Reproduced with permission from ref. 111. Copyright 2015 Royal Society of Chemistry. | ||
The measured single thermoelectric leg was soldered with its electrical contact pads in between a hot junction copper heater assembly and a cold junction copper electrode (Fig. 19a). The heated radiation shields were designed to minimize the parasitic heat losses from the heater. However, the detailed design principles and measurement methods are beyond the scope of this review and so are not covered further.111 The measured single-leg thermoelectric conversion efficiency reached 8.5% operating between 293 K and 518 K (Fig. 19b). At a high operating temperature above 425 K, the conversion efficiency of the α-MgAgSb leg obviously outperformed the reference sample, which was a p-type Bi2Te3-based material. The high conversion efficiency was also demonstrated with a power output of 46.2 mW (power density ∼5.14 kW m−2) at a current of 1.48 A (current density ∼16.4 A cm−2).111 At the imposed temperature difference of 225 K, the efficiency of the α-MgAgSb leg was significantly higher than the previously reported efficiency, including Bi2Te3, skutterudite, PbTe, half-Heusler alloys, the Zintl system, and segmented legs (PbTe/Bi2Te3, and skutterudite/Bi2Te3) (Fig. 19c).87,138,212–221 An efficiency exceeding 10% could be expected at a temperature difference of 548 K, which was only reported at almost twice the temperature difference with the segmented legs. The demonstration of a high conversion efficiency of ∼8.5% at a much lower operating temperature difference of 225 K in combination with a simple fabrication process highlighted the promising prospects for the large-scale deployment of α-MgAgSb thermoelectric devices for low-temperature applications.
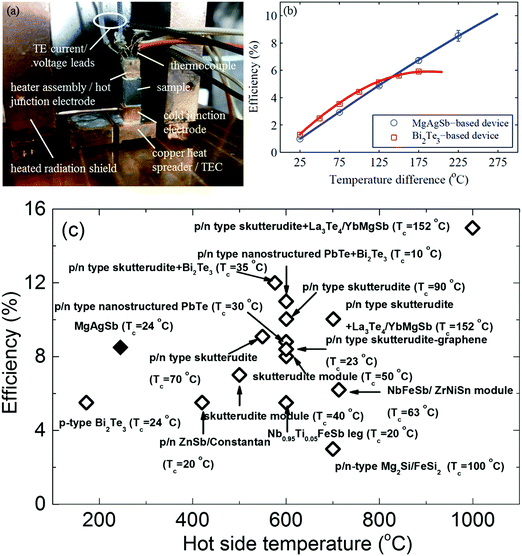 | ||
| Fig. 19 (a) Fabricated single thermoelectric leg device with the sample soldered to the copper heater assembly (also acting as the hot-junction electrode) and the copper cold junction electrode. The device is soldered onto a thermoelectric cooler (TEC), which is mounted onto a liquid-cooled cold plate and surrounded by a heated radiation shield;111 (b) efficiency results of a single thermoelectric leg device based on the α-MgAgSb sample (blue circles) compared to a device based on a commercial p-type-doped bismuth telluride sample (red squares). Solid lines correspond to the simulation results obtained with the iterative method based on the temperature-dependent material properties extracted from the average measured material properties;111 (c) efficiency comparison between the α-MgAgSb samples (solid diamond) with the reported maximum thermoelectric device efficiencies (open diamond) as a function of the hot-junction temperature.87,138,194–203 Reproduced with permission from ref. 111. Copyright 2015 Royal Society of Chemistry. | ||
7. Summary and outlook
In this prospective, we mainly discussed the phase transition, synthesis method, thermoelectric properties, and effective strategies to enhance ZT, as well as the efficiency measurements of α-MgAgSb. In particular, the origins of the “phonon glass electron crystal” behaviors, including the unique crystal and structural features, beneficial lattice dynamics properties, and band structure as well as the multiscale microstructure, were emphasized, which led to a combination of a relatively high power factor and intrinsically low lattice thermal conductivity. As a result, a record high conversion efficiency of ∼8.5% for a single leg at a much lower operating temperature difference of 225 K was achieved, which highlighted the promising prospects for low-temperature power generation. However, since research on the α-MgAgSb-based materials is still at an early stage, more and more attention should be paid to this promising system. Some currently unsolved questions as well as future directions and challenges are summarized in the following:(1) At the material level: first, the strong bipolar effect seems to be beneficial for the thermoelectric performance, which contradicts the conventional knowledge; so what is the underlying reason for this interesting behavior? Second, does band engineering to increase the number of degenerate valleys and thus to enhance ZT really work in this system? Third, how about the long-term thermal stability of the multiscale microstructure and the thermoelectric properties of nanostructured α-MgAgSb?
(2) At the device level: first, it may be possible to further decrease the contact resistance by optimizing the fabrication process or by designing a new contact layer because the current contact resistance of ∼10 μΩ cm2 is still too high, and should be reduced to less than 1 μΩ cm2. Second, in terms of real applications, since it is highly beneficial to fabricate a pair of n-type and p-type thermoelectric materials based on one parent compound, how to develop the n-type α-MgAgSb becomes an imperative task. If not, it is necessary to discover and design the n-type counterpart of α-MgAgSb with comparable thermoelectric and mechanical properties. Under such conditions, the high conversion efficiency of thermoelectric devices for power generation could be highly promising, which should speed up their real applications for energy harvesting.
Conflicts of interest
There are no conflicts to declare.Acknowledgements
This work was supported by the U.S. Department of Energy under award number DE-SC0010831, and was also supported by the National Natural Science Foundation of China (no. 51471061, 51622101 and 51771065). We thank Dr Gang Chen, Dr Wei Cai, Dr Huiyuan Geng, Dr Yumei Wang, Dr Yongsheng Zhang, Dr Huaizhou Zhao, Dr Jing Shuai, Dr Daniel Kraemer and Dr Weihong Gao for the plentiful discussions and fruitful collaborations.References
- R. Mohtadi and S.-I. Orimo, Nat. Rev. Mater., 2016, 2, 16091 CrossRef
.
- D. Gielen, Nat. Mater., 2016, 15, 117–120 CrossRef CAS PubMed
.
- S. Chu and A. Majumdar, Nature, 2012, 488, 294–303 CrossRef CAS PubMed
.
- H. R. Zhao, Q. W. Wu, S. J. Hu, H. H. Xu and C. N. Rasmussen, Appl. Energy, 2015, 137, 545–553 CrossRef
.
- N. Kannan and D. Vakeesan, Renewable Sustainable Energy Rev., 2016, 62, 1092–1105 CrossRef
.
- D. K. Okot, Renewable Sustainable Energy Rev., 2013, 26, 515–520 CrossRef
.
- R. A. Voloshin, M. V. Rodionova, S. K. Zharmukhamedov, T. N. Veziroglu and S. I. Allakhverdiev, Int. J. Hydrogen Energy, 2016, 41, 17257–17273 CrossRef CAS
.
- Energy Flow Charts, http://https://flowcharts.llnl.gov/commodities/energy, 2017.
-
H. J. Goldsmid, Introduction to thermoelectricity, Springer Science & Business Media, New York, 2009 Search PubMed
.
- M. Zebarjadi, K. Esfarjani, M. S. Dresselhaus, Z. F. Ren and G. Chen, Energy Environ. Sci., 2012, 5, 5147–5162 Search PubMed
.
- D. Kraemer, B. Poudel, H.-P. Feng, J. C. Caylor, B. Yu, X. Yan, Y. Ma, X. W. Wang, D. Z. Wang, A. Muto, K. McEnaney, M. Chiesa, Z. F. Ren and G. Chen, Nat. Mater., 2011, 10, 532–538 CrossRef CAS PubMed
.
- L. L. Baranowski, G. J. Snyder and E. S. Toberer, Energy Environ. Sci., 2012, 5, 9055–9067 CAS
.
- D. Kraemer, Q. Jie, K. McEnaney, F. Cao, W. S. Liu, L. A. Weinstein, J. Loomis, Z. F. Ren and G. Chen, Nat. Energy, 2016, 1, 16153 CrossRef CAS
.
-
D. M. Rowe, CRC handbook of thermoelectrics, CRC press, New York, 1995 Search PubMed
.
- J. H. Yang and T. Caillat, MRS Bull., 2006, 31, 224–229 CrossRef CAS
.
- W. S. Liu, J. Z. Hu, S. M. Zhang, M. J. Deng, C. G. Han and Y. Liu, Mater. Today Phys., 2017, 1, 50–60 CrossRef
.
- A. F. Ioffe, Phys. Today, 1957, 12, 42 CrossRef
.
- G. J. Snyder and E. S. Toberer, Nat. Mater., 2008, 7, 105–114 CrossRef CAS PubMed
.
- T. J. Zhu, Y. T. Liu, C. G. Fu, J. P. Heremans, J. G. Snyder and X. B. Zhao, Adv. Mater., 2017, 29, 1605884 CrossRef PubMed
.
- C. H. Champness, P. T. Chiang and P. Parekh, Can. J. Phys., 1965, 43, 653–669 CrossRef CAS
.
- H. J. Goldsmid and R. W. Douglas, Br. J. Appl. Phys., 1954, 5, 386 CrossRef
.
- T. Koga, X. Sun, S. B. Cronin and M. S. Dresselhaus, MRS Online Proc. Libr., 1998, 73, 2950–2952 CAS
.
- K. F. Hsu, S. Loo, F. Guo, W. Chen, J. S. Dyck, C. Uher, T. Hogan, E. K. Polychroniadis and M. G. Kanatzidis, Science, 2004, 303, 818–821 CrossRef CAS PubMed
.
- B. Poudel, Q. Hao, Y. Ma, Y. C. Lan, A. Minnich, B. Yu, X. Yan, D. Z. Wang, A. Muto, D. Vashaee, X. Y. Chen, J. M. Liu, M. S. Dresselhaus, G. Chen and Z. F. Ren, Science, 2008, 320, 634–638 CrossRef CAS PubMed
.
- Q. Zhang, J. He, T. Zhu, S. Zhang, X. Zhao and T. M. Tritt, Appl. Phys. Lett., 2008, 93, 102109 CrossRef
.
- D. L. Medlin and G. J. Snyder, Curr. Opin. Colloid Interface Sci., 2009, 14, 226–235 CrossRef CAS
.
- Y. Z. Pei, X. Y. Shi, A. LaLonde, H. Wang, L. Chen and G. J. Snyder, Nature, 2011, 473, 66–69 CrossRef CAS PubMed
.
- W. Liu, X. J. Tan, K. Yin, H. J. Liu, X. F. Tang, J. Shi, Q. J. Zhang and C. Uher, Phys. Rev. Lett., 2012, 108, 166601 CrossRef PubMed
.
- K. Biswas, J. Q. He, I. D. Blum, C.-I. Wu, T. P. Hogan, D. N. Seidman, V. P. Dravid and M. G. Kanatzidis, Nature, 2012, 489, 414–418 CrossRef CAS PubMed
.
- Q. Zhang, F. Cao, W. Liu, K. Lukas, B. Yu, S. Chen, C. Opeil, D. Broido, G. Chen and Z. Ren, J. Am. Chem. Soc., 2012, 134, 10031–10038 CrossRef CAS PubMed
.
- G. J. Tan, L. D. Zhao, F. Y. Shi, J. W. Doak, S.-H. Lo, H. Sun, C. Wolverton, V. P. Dravid, C. Uher and M. G. Kanatzidis, J. Am. Chem. Soc., 2014, 136, 7006–7017 CrossRef CAS PubMed
.
- Y. L. Tang, Z. M. Gibbs, L. A. Agapito, G. D. Li, H.-S. Kim, M. B. Nardelli, S. Curtarolo and G. J. Snyder, Nat. Mater., 2015, 14, 1223–1228 CrossRef CAS PubMed
.
- S. I. Kim, K. H. Lee, H. A. Mun, H. S. Kim, S. W. Hwang, J. W. Roh, D. J. Yang, W. H. Shin, X. S. Li, Y. H. Lee, G. J. Snyder and S. W. Kim, Science, 2015, 348, 109–114 CrossRef CAS PubMed
.
- J. W. Zhang, L. R. Song, G. K. H. Madsen, K. F. F. Fischer, W. Q. Zhang, X. Shi and B. B. Iversen, Nat. Commun., 2016, 7, 10892 CrossRef CAS PubMed
.
- R. He, H. T. Zhu, J. Y. Sun, J. Mao, H. Reith, S. Chen, G. Schierning, K. Nielsch and Z. F. Ren, Mater. Today Phys., 2017, 1, 24–30 CrossRef
.
- J. W. Zhang, R. H. Liu, N. Cheng, Y. B. Zhang, J. H. Yang, C. Uher, X. Shi, L. D. Chen and W. Q. Zhang, Adv. Mater., 2014, 26, 3848–3853 CrossRef CAS PubMed
.
- J. Shuai, J. Mao, S. W. Song, Q. Y. Zhang, G. Chen and Z. F. Ren, Mater. Today Phys., 2017, 1, 74–95 CrossRef
.
- B. C. Sales, D. Mandrus and R. K. Williams, Science, 1996, 272, 1325 CAS
.
- G. S. Nolas, G. A. Slack and S. B. Schujman, Semicond. Semimetals, 2001, 69, 255–300 CAS
.
- G. S. Nolas, D. T. Morelli and T. M. Tritt, Annu.
Rev. Mater. Res., 2003, 29, 89–116 CrossRef
.
- T. Takabatake, K. Suekuni, T. Nakayama and E. Kaneshita, Rev. Mod. Phys., 2014, 86, 669–716 CrossRef CAS
.
- H. L. Liu, X. Shi, F. F. Xu, L. L. Zhang, W. Q. Zhang, L. D. Chen, Q. Li, C. Uher, T. Day and G. J. Snyder, Nat. Mater., 2012, 11, 422–425 CrossRef CAS PubMed
.
- A. A. Olvera, N. A. Moroz, P. Sahoo, P. Ren, T. P. Bailey, A. A. Page, C. Uher and P. F. P. Poudeu, Energy Environ. Sci., 2017, 10, 1668–1676 CAS
.
- S. D. Kang, J.-H. Pöhls, U. Aydemir, P. F. Qiu, C. C. Stoumpos, R. Hanus, M. A. White, X. Shi, L. D. Chen, M. G. Kanatzidis and G. J. Snyder, Mater. Today Phys., 2017, 1, 7–13 CrossRef
.
- R. Nunna, P. F. Qiu, M. J. Yin, H. Y. Chen, R. Hanus, Q. F. Song, T. S. Zhang, M.-Y. Chou, M. T. Agne, J. Q. He, G. J. Snyder, X. Shi and L. D. Chen, Energy Environ. Sci., 2017, 10, 1928–1935 CAS
.
- K. P. Zhao, P. F. Qiu, Q. F. Song, A. B. Blichfeld, E. Eikeland, D. Ren, B. H. Ge, B. B. Iversen, X. Shi and L. D. Chen, Mater. Today Phys., 2017, 1, 14–23 CrossRef
.
- Z. T. Tian, S. Lee and G. Chen, J. Heat Transfer, 2013, 135, 061605 CrossRef
.
- E. S. Toberer, A. Zevalkink and G. J. Snyder, J. Mater. Chem., 2011, 21, 15843–15852 RSC
.
- B. L. Liao and G. Chen, MRS Bull., 2015, 40, 746–752 CrossRef
.
- J. Yang, L. L. Xi, W. J. Qiu, L. H. Wu, X. Shi, L. D. Chen, J. H. Yang, W. Q. Zhang, C. Uher and D. J. Singh, npj Comput. Mater., 2016, 2, 15015 CrossRef CAS
.
- K. Vandaele, S. J. Watzman, B. Flebus, A. Prakash, Y. H. Zheng, S. R. Boona and J. P. Heremans, Mater. Today Phys., 2017, 1, 39–49 CrossRef
.
- Y. Z. Pei, H. Wang and G. J. Snyder, Adv. Mater., 2012, 24, 6125–6135 CrossRef CAS PubMed
.
- A. M. Dehkordi, M. Zebarjadi, J. He and T. M. Tritt, Mater. Sci. Eng., R, 2015, 97, 1–22 CrossRef
.
- A. J. Minnich, M. S. Dresselhaus, Z. F. Ren and G. Chen, Energy Environ. Sci., 2009, 2, 466–479 CAS
.
- Y. C. Lan, A. J. Minnich, G. Chen and Z. F. Ren, Adv. Funct. Mater., 2010, 20, 357–376 CrossRef CAS
.
- J. F. Li, W. S. Liu, L. D. Zhao and M. Zhou, NPG Asia Mater., 2010, 2, 152–158 CrossRef
.
- J. He, M. G. Kanatzidis and V. P. Dravid, Mater. Today, 2013, 16, 166–176 CrossRef CAS
.
- L. D. Zhao, V. P. Dravid and M. G. Kanatzidis, Energy Environ. Sci., 2014, 7, 251–268 CAS
.
- M. G. Kanatzidis, MRS Bull., 2015, 40, 687–695 CrossRef
.
- W. S. Liu, Q. Jie, H. S. Kim and Z. F. Ren, Acta Mater., 2015, 87, 357–376 CrossRef CAS
.
- Q. H. Zhang, X. Y. Huang, S. Q. Bai, X. Shi, C. Uher and L. D. Chen, Adv. Eng. Mater., 2016, 18, 194–213 CrossRef CAS
.
- H. S. Kim, W. S. Liu and Z. F. Ren, Energy Environ. Sci., 2017, 10, 69–85 Search PubMed
.
- H. J. Goldsmid, Materials, 2014, 7, 2577–2592 CrossRef CAS PubMed
.
- T. J. Zhu, L. P. Hu, X. B. Zhao and J. He, Adv. Sci., 2016, 3, 1600004 CrossRef PubMed
.
- A. D. LaLonde, Y. Z. Pei, H. Wang and G. J. Snyder, Mater. Today, 2011, 14, 526–532 CrossRef CAS
.
- B. B. Iversen, J. Mater. Chem., 2010, 20, 10778–10787 RSC
.
- S. M. Kauzlarich, S. R. Brown and G. J. Snyder, Dalton Trans., 2007, 2099–2107 RSC
.
- E. S. Toberer, A. F. May and G. J. Snyder, Chem. Mater., 2009, 22, 624–634 CrossRef
.
- S. Chen and Z. F. Ren, Mater. Today, 2013, 16, 387–395 CrossRef CAS
.
- T. J. Zhu, C. G. Fu, H. H. Xie, Y. T. Liu and X. B. Zhao, Adv. Energy Mater., 2015, 5, 1500588 CrossRef
.
- S. Walia, S. Balendhran, H. Nili, S. Zhuiykov, G. Rosengarten, Q. H. Wang, M. Bhaskaran, S. Sriram, M. S. Strano and K. Kalantar-zadeh, Prog. Mater. Sci., 2013, 58, 1443–1489 CrossRef CAS
.
- L. D. Zhao, J. He, D. Berardan, Y. Lin, J. F. Li, C. W. Nan and N. Dragoe, Energy Environ. Sci., 2014, 7, 2900–2924 CAS
.
- W. S. Liu, X. Yan, G. Chen and Z. F. Ren, Nano Energy, 2012, 1, 42–56 CrossRef CAS
.
- X. Shi, L. Chen and C. Uher, Int. Mater. Rev., 2016, 61, 379–415 CrossRef CAS
.
- G. J. Tan, L. D. Zhao and M. G. Kanatzidis, Chem. Rev., 2016, 116, 12123–12149 CrossRef CAS PubMed
.
- X. L. Su, P. Wei, H. Li, W. Liu, Y. G. Yan, P. Li, C. Q. Su, C. J. Xie, W. Y. Zhao, P. C. Zhai, Q. J. Zhang, X. F. Tang and C. Uher, Adv. Mater., 2017, 29, 1602013 CrossRef PubMed
.
- H. T. Ma, L. H. Yin, X. P. Shen, W. Lu, Y. X. Sun, Y. F. Zhang and N. Deng, Appl. Energy, 2016, 169, 177–186 CrossRef
.
- S. R. Brown, S. M. Kauzlarich, F. Gascoin and G. J. Snyder, Chem. Mater., 2006, 18, 1873–1877 CrossRef CAS
.
- X. W. Wang, H. Lee, Y. C. Lan, G. H. Zhu, G. Joshi, D. Z. Wang, J. Yang, A. J. Muto, M. Y. Tang, J. Klatsky, S. Song, M. S. Dresselhaus, G. Chen and Z. F. Ren, Appl. Phys. Lett., 2008, 93, 193121 CrossRef
.
- G. Joshi, H. Lee, Y. C. Lan, X. W. Wang, G. H. Zhu, D. Z. Wang, R. W. Gould, D. C. Cuff, M. Y. Tang and M. S. Dresselhaus, Nano Lett., 2008, 8, 4670–4674 CrossRef CAS PubMed
.
- X. Yan, B. Poudel, Y. Ma, W. S. Liu, G. Joshi, H. Wang, Y. C. Lan, D. Z. Wang, G. Chen and Z. F. Ren, Nano Lett., 2010, 10, 3373–3378 CrossRef CAS PubMed
.
- W. S. Liu, Q. Y. Zhang, Y. C. Lan, S. Chen, X. Yan, Q. Zhang, H. Wang, D. Z. Wang, G. Chen and Z. F. Ren, Adv. Energy Mater., 2011, 1, 577–587 CrossRef CAS
.
- X. Shi, J. Yang, J. R. Salvador, M. F. Chi, J. Y. Cho, H. Wang, S. Q. Bai, J. H. Yang, W. Q. Zhang and L. D. Chen, J. Am. Chem. Soc., 2011, 133, 7837 CrossRef CAS PubMed
.
- A. D. LaLonde, Y. Z. Pei and G. J. Snyder, Energy Environ. Sci., 2011, 4, 2090–2096 CAS
.
- S. Chen, K. C. Lukas, W. S. Liu, C. P. Opeil, G. Chen and Z. F. Ren, Adv. Energy Mater., 2013, 3, 1210–1214 CrossRef CAS
.
- Q. Jie, H. Z. Wang, W. S. Liu, H. Wang, G. Chen and Z. F. Ren, Phys. Chem. Chem. Phys., 2013, 15, 6809–6816 RSC
.
- C. G. Fu, S. Q. Bai, Y. T. Liu, Y. S. Tang, L. D. Chen, X. B. Zhao and T. J. Zhu, Nat. Commun., 2015, 6, 8144 CrossRef PubMed
.
- L. D. Zhao, G. J. Tan, S. Q. Hao, J. Q. He, Y. L. Pei, H. Chi, H. Wang, S. K. Gong, H. B. Xu, V. P. Dravid, C. Uher, G. J. Snyder, C. Wolverton and M. G. Kanatzidis, Science, 2016, 351, 141–144 CrossRef CAS PubMed
.
- J. Shuai, J. Mao, S. W. Song, Q. Zhu, J. F. Sun, Y. M. Wang, R. He, J. W. Zhou, G. Chen, D. J. Singh and Z. F. Ren, Energy Environ. Sci., 2017, 10, 799–807 CAS
.
- X. F. Meng, Z. H. Liu, B. Cui, D. D. Qin, H. Y. Geng, W. Cai, L. W. Fu, J. Q. He, Z. F. Ren and J. H. Sui, Adv. Energy Mater., 2017, 7, 1602582 CrossRef
.
- W. S. Liu, H. S. Kim, S. Chen, Q. Jie, B. Lv, M. L. Yao, Z. S. Ren, C. P. Opeil, S. Wilson, C.-W. Chu and Z. F. Ren, Proc. Natl. Acad. Sci. U. S. A., 2015, 112, 3269–3274 CrossRef CAS PubMed
.
- W. S. Liu, H. S. Kim, Q. Jie and Z. F. Ren, Scr. Mater., 2016, 111, 3–9 CrossRef CAS
.
- L.-P. Hu, T.-J. Zhu, Y.-G. Wang, H.-H. Xie, Z.-J. Xu and X.-B. Zhao, NPG Asia Mater., 2014, 6, e88 CrossRef CAS
.
- Y. Zheng, Q. Zhang, X. L. Su, H. Y. Xie, S. C. Shu, T. L. Chen, G. J. Tan, Y. G. Yan, X. F. Tang and C. Uher, Adv. Energy Mater., 2015, 5, 1401391 CrossRef
.
-
J. Emsley, Nature's building blocks: an AZ guide to the elements, Oxford University Press, New York, 2011 Search PubMed
.
- T. Caillat, J. P. Fleurial and A. Borshchevsky, J. Phys. Chem. Solids, 1997, 58, 1119–1125 CrossRef CAS
.
- G. J. Snyder, M. Christensen, E. Nishibori, T. Caillat and B. B. Iversen, Nat. Mater., 2004, 3, 458–463 CrossRef CAS PubMed
.
- S. Y. Wang, X. J. Tan, G. J. Tan, X. Y. She, W. Liu, H. Li, H. J. Liu and X. F. Tang, J. Mater. Chem., 2012, 22, 13977–13985 RSC
.
- S. N. Guin, A. Chatterjee, D. S. Negi, R. Datta and K. Biswas, Energy Environ. Sci., 2013, 6, 2603–2608 CAS
.
- Z. H. Liu, J. Shuai, H. Y. Geng, J. Mao, Y. Feng, X. Zhao, X. F. Meng, R. He, W. Cai and J. H. Sui, ACS Appl. Mater. Interfaces, 2015, 7, 23047–23055 CAS
.
- S. T. Cai, Z. H. Liu, J. Y. Sun, R. Li, W. D. Fei and J. H. Sui, Dalton Trans., 2015, 44, 1046–1051 RSC
.
- J. Li, J. H. Sui, Y. L. Pei, C. Barreteau, D. Berardan, N. Dragoe, W. Cai, J. Q. He and L. D. Zhao, Energy Environ. Sci., 2012, 5, 8543–8547 CAS
.
- J. H. Sui, J. Li, J. Q. He, Y. L. Pei, D. Berardan, H. J. Wu, N. Dragoe, W. Cai and L. D. Zhao, Energy Environ. Sci., 2013, 6, 2916–2920 CAS
.
- Y. Liu, L.-D. Zhao, Y. C. Zhu, Y. C. Liu, F. Li, M. J. Yu, D. B. Liu, W. Xu, Y. H. Lin and C. W. Nan, Adv. Energy Mater., 2016, 6, 1502423 CrossRef
.
- X. Lu, D. T. Morelli, Y. Xia, F. Zhou, V. Ozolins, H. Chi, X. Y. Zhou and C. Uher, Adv. Energy Mater., 2013, 3, 342–348 CrossRef CAS
.
- X. Lu, D. T. Morelli, Y. Xia and V. Ozolins, Chem. Mater., 2015, 27, 408–413 CrossRef CAS
.
- L. D. Zhao, S.-H. Lo, Y. S. Zhang, H. Sun, G. J. Tan, C. Uher, C. Wolverton, V. P. Dravid and M. G. Kanatzidis, Nature, 2014, 508, 373–377 CrossRef CAS PubMed
.
- K. L. Peng, X. Lu, H. Zhan, S. Hui, X. D. Tang, G. W. Wang, J. Dai, C. Uher, G. Y. Wang and X. Y. Zhou, Energy Environ. Sci., 2016, 9, 454–460 CAS
.
- M. J. Kirkham, A. M. dos Santos, C. J. Rawn, E. Lara-Curzio, J. W. Sharp and A. J. Thompson, Phys. Rev. B: Condens. Matter Mater. Phys., 2012, 85, 144120 CrossRef
.
- H. Z. Zhao, J. H. Sui, Z. J. Tang, Y. C. Lan, Q. Jie, D. Kraemer, K. McEnaney, A. Guloy, G. Chen and Z. F. Ren, Nano Energy, 2014, 7, 97–103 CrossRef CAS
.
- D. Kraemer, J. H. Sui, K. McEnaney, H. Z. Zhao, Q. Jie, Z. F. Ren and G. Chen, Energy Environ. Sci., 2015, 8, 1299–1308 CAS
.
- J. Shuai, H. S. Kim, Y. C. Lan, S. Chen, Y. Liu, H. Z. Zhao, J. H. Sui and Z. F. Ren, Nano Energy, 2015, 11, 640–646 CrossRef CAS
.
- J. H. Sui, J. Shuai, Y. C. Lan, Y. Liu, R. He, D. Z. Wang, Q. Jie and Z. F. Ren, Acta Mater., 2015, 87, 266–272 CrossRef CAS
.
- P. J. Ying, X. H. Liu, C. G. Fu, X. Q. Yue, H. H. Xie, X. B. Zhao, W. Q. Zhang and T. J. Zhu, Chem. Mater., 2015, 27, 909–913 CrossRef CAS
.
- Z. H. Liu, H. Y. Geng, J. Mao, S. Jing, R. He, C. Wang, W. Cai, J. H. Sui and Z. F. Ren, J. Mater. Chem. A, 2016, 4, 16834–16840 CAS
.
- Z. H. Liu, J. Shuai, J. Mao, Y. M. Wang, Z. Y. Wang, W. Cai, J. H. Sui and Z. F. Ren, Acta Mater., 2016, 102, 17–23 CrossRef CAS
.
- Z. H. Liu, Y. M. Wang, J. Mao, H. Y. Geng, J. Shuai, Y. X. Wang, R. He, W. Cai, J. H. Sui and Z. F. Ren, Adv. Energy Mater., 2016, 6, 1502269 CrossRef
.
- Z. H. Liu, W. H. Gao, X. F. Meng, X. B. Li, J. Mao, Y. M. Wang, J. Shuai, W. Cai, Z. F. Ren and J. H. Sui, Scr. Mater., 2017, 127, 72–75 CrossRef CAS
.
- Z. H. Liu, Y. M. Wang, W. H. Gao, J. Mao, H. Y. Geng, J. Shuai, W. Cai, J. H. Sui and Z. F. Ren, Nano Energy, 2017, 31, 194–200 CrossRef CAS
.
- Z. H. Liu, Y. S. Zhang, J. Mao, W. H. Gao, Y. M. Wang, J. Shuai, W. Cai, J. H. Sui and Z. F. Ren, Acta Mater., 2017, 128, 227–234 CrossRef CAS
.
- D. D. Li, H. Z. Zhao, S. M. Li, B. P. Wei, J. Shuai, C. L. Shi, X. K. Xi, P. J. Sun, S. Meng, L. Gu, Z. F. Ren and X. L. Chen, Adv. Funct. Mater., 2015, 25, 6478–6488 CrossRef CAS
.
- N. H. Miao and P. Ghosez, J. Phys. Chem. C, 2015, 119, 14017–14022 CAS
.
- N. H. Miao, J. Zhou, B. S. Sa, B. Xu and Z. M. Sun, Appl. Phys. Lett., 2016, 108, 213902 CrossRef
.
- C. Y. Sheng, H. J. Liu, D. D. Fan, L. Cheng, J. Zhang, J. Wei, J. H. Liang, P. H. Jiang and J. Shi, J. Appl. Phys., 2016, 119, 195101 CrossRef
.
- J. F. Wang, X. N. Fu, X. D. Zhang, J. T. Wang, X. D. Li and Z. Y. Jiang, Chin. Phys. B, 2016, 25, 086302 CrossRef
.
- P. J. Ying, X. Li, Y. C. Wang, J. Yang, C. G. Fu, W. Q. Zhang, X. B. Zhao and T. J. Zhu, Adv. Funct. Mater., 2017, 27, 1604145 CrossRef
.
- J. L. Mi, P. J. Ying, M. Sist, H. Reardon, P. Zhang, T. J. Zhu, X. B. Zhao and B. B. Iversen, Chem. Mater., 2017, 29, 6378–6388 CrossRef CAS
.
- R. G. Morris, R. D. Redin and G. C. Danielson, Phys. Rev., 1958, 109, 1909–1915 CrossRef CAS
.
- R. Bowers, R. W. Ure, J. E. Bauerle and A. J. Cornish, J. Appl. Phys., 1959, 30, 930–934 CrossRef
.
- D. A. Wright, Int. Mater. Rev., 1970, 147–160 CrossRef CAS
.
- M. Beekman, D. T. Morelli and G. S. Nolas, Nat. Mater., 2015, 14, 1182–1185 CrossRef CAS PubMed
.
- Z. H. Liu, Y. L. Pei, H. Y. Geng, J. C. Zhou, X. F. Meng, W. Cai, W. S. Liu and J. H. Sui, Nano Energy, 2015, 13, 554–562 CrossRef CAS
.
- M. Zhou, J. F. Li and T. Kita, J. Am. Chem. Soc., 2008, 130, 4527–4532 CrossRef CAS PubMed
.
- L. D. Zhao, X. Zhang, H. J. Wu, G. J. Tan, Y. L. Pei, Y. Xiao, C. Chang, D. Wu, H. Chi, L. Zheng, S. K. Gong, C. Uher, J. Q. He and M. G. Kanatzidis, J. Am. Chem. Soc., 2016, 138, 2366 CrossRef CAS PubMed
.
- Q. Y. Zhang, H. Wang, W. S. Liu, H. Z. Wang, B. Yu, Q. Zhang, Z. T. Tian, G. Ni, S. Lee, K. Esfarjani, G. Chen and Z. F. Ren, Energy Environ. Sci., 2012, 5, 5246–5251 CAS
.
- X. Yan, W. S. Liu, H. Wang, S. Chen, J. Shiomi, K. Esfarjani, H. Z. Wang, D. Z. Wang, G. Chen and Z. F. Ren, Energy Environ. Sci., 2012, 5, 7543–7548 CAS
.
- J. Mao, Y. M. Wang, H. S. Kim, Z. H. Liu, U. Saparamadu, F. Tian, K. Dahal, J. Y. Sun, S. Chen and W. S. Liu, Nano Energy, 2015, 17, 279–289 CrossRef CAS
.
- R. He, D. Kraemer, J. Mao, L. P. Zeng, Q. Jie, Y. C. Lan, C. H. Li, J. Shuai, H. S. Kim, Y. Liu, D. Broido, C.-W. Chu, G. Chen and Z. F. Ren, Proc. Natl. Acad. Sci. U. S. A., 2016, 113, 13576–13581 CrossRef CAS PubMed
.
- D. Q. He, W. Y. Zhao, X. Mu, H. Y. Zhou and Q. J. Zhang, J. Electron. Mater., 2015, 44, 1919–1925 CrossRef CAS
.
- S. Y. Wang, J. Yang, L. H. Wu, P. Wei, J. Yang, W. Q. Zhang and Y. Grin, Chem. Mater., 2015, 27, 1071–1081 CrossRef CAS
.
- J. Yang, G. Meisner and L. Chen, Appl. Phys. Lett., 2004, 85, 1140 CrossRef CAS
.
- C. G. Fu, H. H. Xie, T. J. Zhu, J. Xie and X. B. Zhao, J. Appl. Phys., 2012, 112, 66 Search PubMed
.
- T. H. Yi, C. A. Cox, E. S. Toberer, G. J. Snyder and S. M. Kauzlarich, Chem. Mater., 2010, 22, 935–941 CrossRef CAS
.
-
T. M. Tritt, Thermal conductivity: theory, properties, and applications, Springer Science & Business Media, New York, 2005 Search PubMed
.
- W. Li, S. Q. Lin, B. H. Ge, J. Yang, W. Q. Zhang and Y. Z. Pei, Adv. Sci., 2016, 3, 1600196 CrossRef PubMed
.
- K. Kurosaki, A. Kosuga, H. Muta, M. Uno and S. Yamanaka, Appl. Phys. Lett., 2005, 87, 061919 CrossRef
.
- Y. Z. Pei, N. A. Heinz and G. J. Snyder, J. Mater. Chem., 2011, 21, 18256–18260 RSC
.
-
O. Madelung, Semiconductors: Data Handbook, Springer Berlin Heidelberg, New York, 2004 Search PubMed
.
- S. Q. Lin, L. Wen, Z. W. Chen, J. W. Shen, B. H. Ge and Y. Z. Pei, Nat. Commun., 2016, 7, 10287 CrossRef CAS PubMed
.
- H. Wang, E. Schechtel, Y. Z. Pei and G. J. Snyder, Adv. Energy Mater., 2013, 3, 488–495 CrossRef CAS
.
- J. W. Shen, Z. W. Chen, L. L. Zheng, W. Li and Y. Z. Pei, J. Mater. Chem. C, 2016, 4, 209–214 RSC
.
- X. Shi, S. Q. Bai, L. L. Xi, J. Yang, W. Zhang, L. D. Chen and J. H. Yang, J. Mater. Res., 2011, 26, 1745–1754 CrossRef CAS
.
- S. Bhattacharya, M. J. Skove, M. Russell, T. M. Tritt, Y. Xia, V. Ponnambalam, S. J. Poon and N. Thadhani, Phys. Rev. B: Condens. Matter Mater. Phys., 2008, 77, 998–1002 Search PubMed
.
- A. F. May, J.-P. Fleurial and G. J. Snyder, Phys. Rev. B: Condens. Matter Mater. Phys., 2008, 78, 125205 CrossRef
.
- S. K. Bux, R. G. Blair, P. K. Gogna, H. Lee, G. Chen, M. S. Dresselhaus, R. B. Kaner and J. P. Fleurial, Adv. Funct. Mater., 2009, 19, 2445–2452 CrossRef CAS
.
- Z. T. Tian, J. Garg, K. Esfarjani, T. Shiga, J. Shiomi and G. Chen, Phys. Rev. B: Condens. Matter Mater. Phys., 2012, 85, 184303 CrossRef
.
- W. G. Zeier, J. Schmitt, G. Hautier, U. Aydemir, Z. M. Gibbs, C. Felser and G. J. Snyder, Nat. Rev. Mater., 2016, 16032 CrossRef CAS
.
- A. Fischer, E. W. Scheidt, W. Scherer, D. E. Benson, Y. Wu, D. Eklöf and U. Häussermann, Phys. Rev. B: Condens. Matter Mater. Phys., 2015, 91, 224309 CrossRef
.
- O. Delaire, J. Ma, K. Marty, A. F. May, M. A. McGuire, M. H. Du, D. J. Singh, A. Podlesnyak, G. Ehlers, M. Lumsden and B. C. Sales, Nat. Mater., 2011, 10, 614–619 CrossRef CAS PubMed
.
- Y. S. Zhang, E. Skoug, J. Cain, V. Ozoliņš, D. Morelli and C. Wolverton, Phys. Rev. B: Condens. Matter Mater. Phys., 2012, 85, 054306 CrossRef
.
- T. Dasgupta, C. Stiewe, R. Hassdorf, A. J. Zhou, L. Boettcher and E. Mueller, Phys. Rev. B: Condens. Matter
Mater. Phys., 2011, 83, 235207 CrossRef
.
- X. H. Liu, L. L. Xi, W. J. Qiu, J. Yang, T. J. Zhu, X. B. Zhao and W. Q. Zhang, Adv. Electron. Mater., 2015, 2, 1500284 CrossRef
.
- Z. Z. Feng, J. H. Zhang, Y. L. Yan, G. B. Zhang, C. Wang, C. X. Peng, F. Z. Ren, Y. X. Wang and Z. X. Cheng, Sci. Rep., 2017, 7, 2572 CrossRef PubMed
.
- Z. Y. Pang, X. W. Zhang and C. Wang, Curr. Appl. Phys., 2017, 17, 1279–1287 CrossRef
.
- K. Kurosaki, H. Matsumoto, A. Charoenphakdee, S. Yamanaka, M. Ishimaru and Y. Hirotsu, Appl. Phys. Lett., 2008, 93, 12101 CrossRef
.
- O. Delaire, A. F. May, M. A. McGuire, W. D. Porter, M. S. Lucas, M. B. Stone, D. L. Abernathy, V. A. Ravi, S. A. Firdosy and G. J. Snyder, Phys. Rev. B: Condens. Matter Mater. Phys., 2009, 80, 184302 CrossRef
.
- C. Yu, M. L. Scullin, M. Huijben, R. Ramesh and A. Majumdar, Appl. Phys. Lett., 2008, 92, 191911 CrossRef
.
- W. Li, S. Q. Lin, X. Y. Zhang, Z. W. Chen, X. F. Xu and Y. Z. Pei, Chem. Mater., 2016, 28, 6227–6232 CrossRef CAS
.
- Y. Z. Pei and D. T. Morelli, Appl. Phys. Lett., 2009, 94, 122112 CrossRef
.
- G. J. Tan, W. G. Zeier, F. Y. Shi, P. L. Wang, G. J. Snyder, V. P. Dravid and M. G. Kanatzidis, Chem. Mater., 2015, 27, 7801–7811 CrossRef CAS
.
- M. Hÿtch, E. Snoeck and R. Kilaas, Ultramicroscopy, 1998, 74, 131–146 CrossRef
.
- J. Q. He, J. R. Sootsman, S. N. Girard, J. C. Zheng, J. G. Wen, Y. M. Zhu, M. G. Kanatzidis and V. P. Dravid, J. Am. Chem. Soc., 2010, 132, 8669–8675 CrossRef CAS PubMed
.
- P. G. Klemens, Proc. Phys. Soc., London, Sect. A, 1955, 68, 1113 CrossRef
.
- J. Callaway, Phys. Rev., 1959, 113, 1046 CrossRef CAS
.
- X. Zhang and L. D. Zhao, J. Materiomics, 2015, 1, 92–105 CrossRef
.
- D. R. Clarke, Surf. Coat. Technol., 2003, 163, 67–74 CrossRef
.
- X. J. Tan, L. Wang, H. Z. Shao, S. Yue, J. T. Xu, G. Q. Liu, H. C. Jiang and J. Jiang, Adv. Energy Mater., 2017, 1700076 CrossRef
.
- J. Mao, H. S. Kim, J. Shuai, Z. H. Liu, R. He, U. Saparamadu, F. Tian, W. S. Liu and Z. F. Ren, Acta Mater., 2016, 103, 633–642 CrossRef CAS
.
- J. Mao, Y. M. Wang, B. H. Ge, Q. Jie, Z. H. Liu, U. Saparamadu, W. S. Liu and Z. F. Ren, Phys. Chem. Chem. Phys., 2016, 18, 20726–20737 RSC
.
- S. Y. Wang, J. R. Salvador, J. Yang, P. Wei, B. Duan and J. H. Yang, NPG Asia Mater., 2016, 8, e825 Search PubMed
.
- H. H. Xie, H. Wang, Y. Z. Pei, C. G. Fu, X. H. Liu, G. J. Snyder, X. B. Zhao and T. J. Zhu, Adv. Funct. Mater., 2013, 23, 5123–5130 CrossRef CAS
.
-
H. Goldsmid, Thermoelectric refrigeration, Springer, New York, 2013 Search PubMed
.
- J. w. Zhang, L. r. Song, S. H. Pedersen, H. Yin, L. T. Hung and B. B. Iversen, Nat. Commun., 2017, 8, 13901 CrossRef CAS PubMed
.
- C. G. Fu, T. J. Zhu, Y. Z. Pei, H. H. Xie, H. Wang, G. J. Snyder, Y. Liu, Y. T. Liu and X. B. Zhao, Adv. Energy Mater., 2014, 4, 1400600 CrossRef
.
- H. Xiao, J. Tahir-Kheli and W. A. Goddard, J. Phys. Chem. Lett., 2011, 2, 212–217 CrossRef CAS
.
- J. Wang, X.-C. Liu, S.-Q. Xia and X.-T. Tao, J. Am. Chem. Soc., 2013, 135, 11840–11848 CrossRef CAS PubMed
.
- G. S. Pomrehn, A. Zevalkink, W. G. Zeier, A. van de Walle and G. J. Snyder, Angew. Chem., Int. Ed., 2014, 53, 3422–3426 CrossRef CAS PubMed
.
- R. Abouchacra, D. J. Thouless and P. W. Anderson, J. Phys. C, 2002, 96, 1734 Search PubMed
.
-
A. F. Ioffe, Semiconductor thermoelements, and thermoelectric cooling, Infosearch, Ltd, 1957 Search PubMed
.
- J. Callaway and H. C. von Baeyer, Phys. Rev., 1960, 120, 1149 CrossRef CAS
.
- B. Abeles, Phys. Rev., 1963, 131, 1906 CrossRef
.
- L. P. Hu, T. J. Zhu, X. H. Liu and X. B. Zhao, Adv. Funct. Mater., 2014, 24, 5211–5218 CrossRef CAS
.
- G. Y. Jiang, J. He, T. J. Zhu, C. G. Fu, X. H. Liu, L. P. Hu and X. B. Zhao, Adv. Funct. Mater., 2014, 24, 3776–3781 CrossRef CAS
.
- L. P. Hu, H. L. Gao, X. H. Liu, H. H. Xie, J. J. Shen, T. J. Zhu and X. B. Zhao, J. Mater. Chem., 2012, 22, 16484–16490 RSC
.
- L. Chen, S. Gao, X. Zeng, A. M. Dehkordi, T. M. Tritt and S. J. Poon, Appl. Phys. Lett., 2015, 107, 041902 CrossRef
.
- Y. Pan and J. F. Li, NPG Asia Mater., 2016, 8, e275 CrossRef CAS
.
- G. Li, K. Gadelrab, T. Souier, P. L. Potapov, G. Chen and M. Chiesa, Nanotechnology, 2012, 23, 065703 CrossRef CAS PubMed
.
- B. Li, P. Xie, S. Y. Zhang and D. Q. Liu, J. Mater. Sci., 2011, 46, 4000–4004 CrossRef CAS
.
- R. D. Schmidt, E. D. Case, J. E. Ni, R. M. Trejo, E. Lara-Curzio, R. J. Korkosz and M. G. Kanatzidis, J. Mater. Sci., 2013, 48, 8244–8258 CrossRef CAS
.
- R. D. Schmidt, E. D. Case, L.-D. Zhao and M. G. Kanatzidis, J. Mater. Sci., 2015, 50, 1770–1782 CrossRef CAS
.
- Y. Gelbstein, G. Gotesman, Y. Lishzinker, Z. Dashevsky and M. Dariel, Scr. Mater., 2008, 58, 251–254 CrossRef CAS
.
- K. Tyagi, B. Gahtori, S. Bathula, M. Jayasimhadri, S. Sharma, N. K. Singh, D. Haranath, A. Srivastava and A. Dhar, Solid State Commun., 2015, 207, 21–25 CrossRef CAS
.
- G. Rogl and P. Rogl, Sci. Adv. Mater., 2011, 3, 517–538 CrossRef CAS
.
- T. Dahal, S. Gahlawat, Q. Jie, K. Dahal, Y. Lan, K. White and Z. Ren, J. Appl. Phys., 2015, 117, 055101 CrossRef
.
- F. Tseng, S. Li, C. Wu, Y. Pan and L. Li, J. Mater. Sci., 2016, 51, 5271–5280 CrossRef CAS
.
- K. Ueno, A. Yamamoto, T. Noguchi, T. Inoue, S. Sodeoka and H. Obara, J. Alloys Compd., 2005, 388, 118–121 CrossRef CAS
.
- J. E. Ni, E. D. Case, K. N. Khabir, R. C. Stewart, C.-I. Wu, T. P. Hogan, E. J. Timm, S. N. Girard and M. G. Kanatzidis, Mater. Sci. Eng., B, 2010, 170, 58–66 CrossRef CAS
.
- N. Petch, J. Iron Steel Inst., London, 1953, 174, 25–28 CAS
.
- E. Hall, Proc. Phys. Soc., London, Sect. B, 1951, 64, 747 CrossRef
.
- P. F. Becher, J. Am. Ceram. Soc., 1991, 74, 255–269 CrossRef CAS
.
- W. H. Gao, X. Y. Yi, B. Sun, X. L. Meng, W. Cai and L. C. Zhao, Acta Mater., 2017, 132, 405–415 CrossRef CAS
.
- M. Telkes, J. Appl. Phys., 1954, 25, 765–777 CrossRef CAS
.
- E. Groß, M. Riffel and U. Stöhrer, J. Mater. Res., 1995, 10, 34–40 CrossRef
.
- T. Caillat, J. P. Fleurial, G. J. Snyder and A. Borshchevsky, Proceedings of 20th International Conference on Thermoelectrics, Cat. no. 01TH8589, 2001, pp. 282–285.
- A. Muto, D. Kraemer, Q. Hao, Z. F. Ren and G. Chen, Rev. Sci. Instrum., 2009, 80, 093901 CrossRef CAS PubMed
.
- A. Muto, J. Yang, B. Poudel, Z. F. Ren and G. Chen, Adv. Energy Mater., 2012, 3, 245–251 CrossRef
.
- J. R. Salvador, J. Y. Cho, Z. Ye, J. E. Moczygemba, A. J. Thompson, J. W. Sharp, J. D. Koenig, R. Maloney, T. Thompson, J. Sakamoto, H. Wang and A. A. Wereszczak, Phys. Chem. Chem. Phys., 2014, 16, 12510–12520 RSC
.
- J. Q. Guo, H. Y. Geng, T. Ochi, S. Suzuki, M. Kikuchi, Y. Yamaguchi and S. Ito, J. Electron. Mater., 2012, 41, 1036–1042 CrossRef CAS
.
- X. K. Hu, P. Jood, M. Ohta, M. Kunii, K. Nagase, H. Nishiate, M. G. Kanatzidis and A. Yamamoto, Energy Environ. Sci., 2016, 9, 517–529 CAS
.
- Q. H. Zhang, J. C. Liao, Y. S. Tang, M. Gu, C. Ming, P. F. Qiu, S. Q. Bai, X. Shi, C. Uher and L. D. Chen, Energy Environ. Sci., 2017, 10, 956–963 CAS
.
- P. A. Zong, R. Hanus, M. Dylla, Y. S. Tang, J. C. Liao, Q. H. Zhang, G. J. Snyder and L. D. Chen, Energy Environ. Sci., 2017, 10, 183–191 CAS
.
| This journal is © The Royal Society of Chemistry 2018 |

