 Open Access Article
Insights into the generation of reactive oxygen species (ROS) over polythiophene/ZnIn2S4 based on different modification processing†
Bo
Gao
 *abc,
Sidra
Iftekhar
 c,
Varsha
Srivastava
 c,
Bhairavi
Doshi
 c and
Mika
Sillanpää
 c
c
aResearch Institute of Membrane Separation Technology of Shaanxi Province, Xi'an University of Architecture and Technology, Xi'an 710055, PR China. E-mail: gaobo@xauat.edu.cn
bKey Laboratory of Membrane Separation of Shaanxi Province, Xi'an University of Architecture and Technology, Xi'an 710055, China
cLaboratory of Green Chemistry, Faculty of Technology, Lappeenranta University of Technology, Sammonkatu 12, FIN-50130 Mikkeli, Finland
First published on 19th March 2018
Abstract
The performance of a polythiophene-modified ZnIn2S4 hybrid photocatalyst was associated with the processing methods. We reported the influence of different modification methods (blending versus surface polymerization) on photogenerated reactive oxygen species (ROS) and photocatalytic degradation of tetracycline. The photocatalytic degradation of tetracycline was enhanced with polythiophene modification either by blending or by surface chemical polymerization, and 51% or 54% NPOC (non-purgeable organic carbon) removal was achieved, respectively, in comparison with 36% for ZnIn2S4. Nanosized particles in the range of 10–20 nm were observed in pure ZnIn2S4 and the blended sample (PTh-ZIS) via an ethanol-thermal method, resulting in a high surface area of 188 m2 g−1 and 209 m2 g−1, respectively. The optical property of ZnIn2S4 still dominated the blended samples so that superoxide radical (˙O2−) was generated from ZnIn2S4 through electron transfer. For surface polymerization samples, transmission electron microscopy (TEM) clearly showed that ZnIn2S4 particles were covered by a thin polythiophene film, which can act as a photosensitizer promoting the generation of singlet oxygen (1O2) through energy transfer. Overall, our work revealed important processing guidelines together with ROS detection for the conductive polymer-modified photocatalyst.
1. Introduction
The ternary metal sulfide ZnIn2S4 possesses an appropriate band gap and can be easily synthesized under relatively mild conditions. A comprehensive study of the photocatalytic degradation of organic pollutants has been conducted in our previous research.1 It is still a challenge to enhance the separation rate of photogenerated electron–hole pairs and their transfer in an isolated ternary metal sulfide component. Numerous ZnIn2S4 composites with various morphologies have been explored to enhance the separation and transfer of photogenerated charge carriers for higher photocatalytic activity. There are four categories of modification processing based on the published articles. The first category is to obtain various morphologies in favor of high photocatalytic performance through different synthesis methods.2–4 The second category is metal ion modification such as surface deposition of metal5,6 and metal ion doping.7,8 The third category is the construction of a heterojunction with ZnIn2S4.9–17 The fourth category is the modification of ZnIn2S4 with carbon analogs such as reduced graphene oxide (rGO)18–20 and carbon dots.21Recently, the modification of semiconductors with conductive polymers to gain high photocatalytic performance has emerged.22,23 However, the literature related to the modification of ZnIn2S4 with conductive polymers is scarce. In this direction, the modification of ZnIn2S4 by polypyrrole (PPy) has been investigated in our previous research studies.24,25 The composite photocatalyst in our previous study was synthesized through a hydrothermal method in the presence of PPy powder, which can be categorized as a “blending method”. The most commonly used modification method for composite semiconductors with conductive polymers was in situ surface polymerization.26–28 Furthermore, the photoinduced degradation efficiency was strongly associated with the generated reactive oxygen species (ROS) since ROS were primary intermediates for photocatalytic reactions.29 The identification of the ROS was important for understanding the photocatalytic degradation mechanism and improving the photocatalytic activity.29 The ROS production was affected by the preparation and modification conditions.30,31 Therefore, the relationship between modification processing and the resulting photocatalytic activity and ROS should be better understood.
In a continuation of this topic, ZnIn2S4 was modified with polythiophene by a blending and surface polymerization method. Polythiophene (PTh), as a typical conjugated polymer with a unique transporting property for electrons and holes,32,33 has been used as a modified material for inorganic semiconductor photocatalysts.34–36 In this research, polythiophene/ZnIn2S4 was prepared via surface chemical oxidative polymerization and a facial ethanol-thermal method in the presence of polythiophene powder. A comparative study of these two methods was carried out to elucidate the connection between modification processing, photocatalytic activity and ROS. Previous research proved that incorporation of some dopants into the polymer matrix could improve the performance of composite photocatalysts37 and also stabilize the polymer with a substrate.38 Some dopants such as sodium dodecylbenzene sulfonate (SDBS), hexadecyl trimethyl ammonium bromide (CTAB), sodium p-toluenesulfonate (TSNa), sodium bis(2-ethylhexyl)sulfosuccinate (AOT) and anthraquinone-2-sulfonate (AQS) were adopted to assist in the preparation of polythiophene. We reported the influence of different dopants on the photocatalytic performance of polythiophene/ZnIn2S4 prepared by blending and surface polymerization. Moreover, multiwalled carbon nanotubes (MWCNTs) were commonly used as an inorganic carbon-modified material for transferring charge carriers,39 so MWCNT/ZnIn2S4 was tested and compared with polythiophene/ZnIn2S4.
2. Experimental section
2.1. Chemicals
Unless otherwise stated, the chemicals were purchased from Sigma-Aldrich and used without any further purification. The chemicals used in this experiment were as follows: indium nitrate hydrate (InN3O9·xH2O, 99.99% trace metals basis), zinc nitrate hexahydrate (Zn(NO3)2·6H2O, crystallized ≥99%), thioacetamide (TAA, reagent grade 98%), iron(III) chloride (FeCl3, reagent grade >97%), thiophene (≥99%), tetracycline hydrochloride (TC, ≥95%), anthraquinone-2-sulfonic acid sodium salt monohydrate (AQS, 97%), sodium dodecylbenzene sulfonate (SDBS, technical grade), hexadecyl trimethyl ammonium bromide (CTAB, ≥99%), sodium p-toluenesulfonate (TSNa, 95%), sodium bis(2-ethylhexyl) sulfosuccinate (AOT, ≥97%), chloroform (≥99.5%, contains 100–200 ppm amylenes as stabilizer), 2,2,6,6-tetramethyl-4-piperidone (TEMP, 95%) and 5,5-dimethyl-pyroline-N-oxide (DMPO). Nylon membrane filter (pore size 0.45 μm) was used for organic solvent filtration. Multiwalled carbon nanotube (MWCNT, carbon basis ≥98%) was purchased with dimensions of 10 nm ± 1 nm × 4.5 nm ± 0.5 nm × 3–6 μm (O.D. × I.D. × L). The ultrapure water used in this experiment was produced by a mini instrument (Sartorius arium® mini) with a specific resistance of 18.2 MΩ cm.2.2. Preparation of polythiophene/ZnIn2S4via ethanol-thermal method in the presence of polythiophene powder (blending)
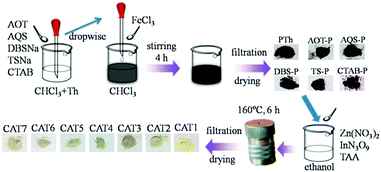
First, polythiophene powder was prepared according to previous research38 with some modification. In detail, FeCl3 (2.43 g, 15 mmol) was dispersed in 20 ml chloroform with continuous magnetic stirring. Thiophene monomer (1 ml, 12.50 mmol) was dissolved in 20 ml chloroform and sonicated for 5 min to form a monomer solution. Then the monomer solution was added into the FeCl3 dispersion drop by drop and sonicated for 15 min. After that, the mixture was maintained under magnetic stirring for 4 h at room temperature. The resultant polythiophene was collected by suction filtration using a nylon membrane filter and first washed twice with 20 ml acetone and then with water several times. The polythiophene powder was ground and sieved through a 78 μm sieve after drying at 70 °C for 10 h and was marked as “PTh”. The synthesis of AOT, SDBS, TSNa, CTAB, AQS modified polythiophene was conducted using the following steps. Specifically, 0.5 mmol dopant (AOT, SDBS, TSNa, CTAB or AQS) was added into the thiophene monomer–chloroform solution and sonicated for 5 min to form a monomer–dopant mixture. Other procedures were the same as in the preparation of pure polythiophene powder. The products were labeled “AOT-PTh”, “SDBS-PTh”, “TSNa-PTh”, “CTAB-PTh” and “AQS-PTh”, respectively.Subsequently, polythiophene/ZnIn2S4 composite photocatalysts were prepared via the ethanol-thermal method. Specifically, 2.5 mmol Zn(NO3)2·6H2O, 5 mmol InN3O9·xH2O and 10 mmol TAA were dissolved in 100 ml ethanol and sonicated for 3 min in order to obtain a uniform solution. Then the solution was transferred into a Teflon–lined autoclave. The autoclave was sealed and placed on a plate heater at 160 °C for 6 h and then naturally cooled to room temperature. Pure ZnIn2S4 was obtained by suction filtration after washing with water several times and was marked as “ZIS (CAT1)”. In the same way, a certain amount of PTh, CTAB-PTh, AOT-PTh, AQS-PTh, SDBS-PTh or TSNa-PTh powder was added into the mixture solution before transferring into the autoclave. The as-prepared composite photocatalysts were named “PTh-ZIS (CAT2)”, “CTAB-PTh-ZIS (CAT3)”, “AOT-PTh-ZIS (CAT4)”, “AQS-PTh-ZIS (CAT5)”, “SDBS-PTh-ZIS (CAT6)” and “TSNa-PTh-ZIS (CAT7)”, respectively. Composite photocatalysts “x% PTh-ZIS” with different weight ratios of polythiophene powder to ZnIn2S4 (0.5%, 1% and 5%) were also prepared and denoted as 0.5% PTh-ZIS, 1% PTh-ZIS and 5% PTh-ZIS, respectively. The proposed synthesis route is illustrated in Scheme 1. For easier understanding, this modification process was labeled as “blending”.
2.3. Preparation of polythiophene/ZnIn2S4via surface chemical oxidative polymerization
Pure ZnIn2S4 was synthesized using the above-mentioned ethanol-thermal method. The chemical oxidative polymerization of thiophene on the ZnIn2S4 surface was conducted as in previous research.28 In particular, 0.5 g pure ZnIn2S4 was dispersed in 50 ml ethanol and stirred for 30 min in an ice-water bath (0 °C). Then, 5 μl of thiophene monomer was added with constant stirring to form a thiophene monomer–ZnIn2S4 mixture. After 30 min, 2 ml of HCl aqueous solution (pH 2) containing 67.5 mg FeCl3 was added dropwise into the above mixture. Afterward, the reaction mixture was maintained with stirring for 6 h in an ice-water bath. The resulting precipitate was filtered through a nylon membrane filter and washed with water several times. After drying at 70 °C for 10 h, the obtained product was denoted as “PTS-ZIS (CAT8)”. The nominal weight ratio of thiophene monomer to ZnIn2S4 was 1![[thin space (1/6-em)]](https://www.rsc.org/images/entities/char_2009.gif) :
:![[thin space (1/6-em)]](https://www.rsc.org/images/entities/char_2009.gif) 100. For surface polymerization of dopant-modified polythiophene over ZnIn2S4, 2.4 μmol of dopant (CTAB, AOT, AQS, SDBS or TSNa) was dissolved in HCl aqueous solution (2 ml, pH 2) containing 67.5 mg FeCl3. The molar ratio of thiophene monomer to dopants was kept at 25
100. For surface polymerization of dopant-modified polythiophene over ZnIn2S4, 2.4 μmol of dopant (CTAB, AOT, AQS, SDBS or TSNa) was dissolved in HCl aqueous solution (2 ml, pH 2) containing 67.5 mg FeCl3. The molar ratio of thiophene monomer to dopants was kept at 25![[thin space (1/6-em)]](https://www.rsc.org/images/entities/char_2009.gif) :
:![[thin space (1/6-em)]](https://www.rsc.org/images/entities/char_2009.gif) 1. The corresponding composite photocatalysts were labeled as “CTAB-PTS-ZIS (CAT9)”, “AOT-PTS-ZIS (CAT10)”, “AQS-PTS-ZIS (CAT11)”, “SDBS-PTS-ZIS (CAT12)” and “TSNa-PTS-ZIS (CAT13)”, respectively. The proposed synthesis route of chemical oxidative polymerization is illustrated in Scheme 2.
1. The corresponding composite photocatalysts were labeled as “CTAB-PTS-ZIS (CAT9)”, “AOT-PTS-ZIS (CAT10)”, “AQS-PTS-ZIS (CAT11)”, “SDBS-PTS-ZIS (CAT12)” and “TSNa-PTS-ZIS (CAT13)”, respectively. The proposed synthesis route of chemical oxidative polymerization is illustrated in Scheme 2.
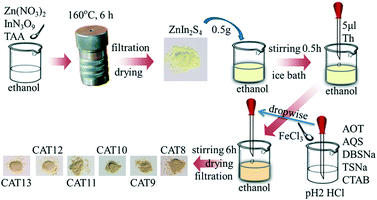 | ||
| Scheme 2 The proposed synthesis routes for the composite photocatalysts via chemical oxidative polymerization. | ||
For comparison, MWCNT/ZnIn2S4 (denoted as “CNT-ZIS (CAT14)”) with a MWCNT to ZnIn2S4 weight ratio of 1% was prepared via the ethanol-thermal method in the presence of MWCNTs in a precursor solution of ZnIn2S4. On the basis of CNT-ZIS, surface chemical oxidative polymerization of polythiophene was conducted according to the above-mentioned method. The product “CNT-ZIS-PTS” was further abbreviated as “C-Z-PTS (CAT15)”. In addition, polymerization of polythiophene first occurred on the surface of the MWCNT and the product “PTh-MWCNT” was obtained. Then, 1% weight ratio of “PTh-MWCNT” was added into the precursor solution of ZnIn2S4 and the product “PTh-MWCNT-ZIS” was obtained through the ethanol-thermal method and was labeled as “PTh-C-Z (CAT16)”.
2.4. Photocatalytic activity test
The photocatalytic reaction for tetracycline removal was performed in a 200 ml beaker containing 100 ml of 10 mg l−1 tetracycline solution with constant magnetic stirring. The photocatalyst dosage was 0.3 g l−1. A 150 W halogen cold visible light source (VWR) with a light intensity of 308 mW cm−2 and a wavelength range of 450–700 nm was positioned horizontally 10 cm above the beaker. The samples were taken by syringe and filtered through a 0.22 μm membrane at given time intervals for further analysis. After 180 min of degradation, the reaction solution was collected by suction filtration using a 0.22 μm membrane for evaluation of the mineralization of tetracycline. In a similar way, the adsorption of tetracycline by different photocatalysts was also conducted in the dark for comparison.2.5. Analysis and characterization
In order to clarify the changes of molecular structure of tetracycline, the concentration of tetracycline was monitored using a UV-vis spectrometer (PerkinElmer Lambda 45) scanning from 200 to 500 nm. The mineralization of tetracycline was determined through non-purgeable organic carbon (NPOC) analysis using a Shimadzu TOC-VCPH carbon analyzer. In addition, the formation of ROS such as superoxide radical (˙O2−), hydroxyl radical (˙OH) and singlet oxygen (1O2) was determined by electron spin resonance (ESR, ADANI CMS 8400). TEMP and DMPO were used as spin trapping agents to generate stable paramagnetic adducts for ESR analysis and the concentration was 100 mM. 100 μl of TEMP or DMPO was added into 1 mg photocatalyst sample and then the mixture was shaken vigorously for sufficient mixing. After irradiation under visible light for 1 min, the sample was taken very quickly in a capillary for further ESR analysis. The specific surface area and porosity were measured using nitrogen (N2) adsorption–desorption at 77.53 K on a Tristar II Plus analyzer and calculated using the Brunauer–Emmett–Teller (BET) method. The degassing procedure was conducted prior to BET measurement at 423 K for 18 h with a continuous N2 flow. Measurements of UV-vis diffuse reflectance spectra (DRS) were done with a Perkin-Elmer Lambda 950 spectrophotometer using a 150 mm integrating sphere. X-ray diffraction (XRD) spectra were measured with a PANalytical diffractometer with Co Kα radiation (λ 0.154056 nm, at 40 kV and 40 mA) over a 2θ range of 10–100°. Transmission electron microscopy images were collected with a HITACHI 7700 transmission electron microscope (TEM) operated at 100 kV. Samples for TEM analysis were prepared by dispersing them in ethanol followed by 20 min sonication to obtain suspensions of dispersed particles. After sonication, a drop of suspension was deposited on carbon-coated copper grids (3 nm carbon film, 400 mesh).3. Results and discussion
3.1. The effect of PTh content on the photoactivity of PTh-ZIS prepared by blending
As can be observed from the spectrum of the initial TC solution in Fig. 1(a), the absorbance of TC in water was characterized by two main wavelengths. One peak located at 275 nm was associated with the aromatic ring A structure including enolic and acylamino groups.40 Another peak located in the visible region with its maximum absorption at 357 nm originated from the extended chromophores comprising ketone and enolic groups (indicated by the dashed box in Fig. 1(a)) connected to aromatic rings B–D.40 In order to elucidate the change of peak at 275 nm and 357 nm during photocatalytic degradation of TC, the calibration curve of peak absorbance (275 nm and 357 nm) and TC concentration is given in Fig. 1(b). The removal of TC was evaluated based on the data derived from the peaks at 275 nm and 357 nm. The effect of PTh content on the photocatalytic activity of PTh-ZIS prepared by blending is shown in Fig. 2. Compared with the pure ZnIn2S4, it is obvious that the photocatalytic performance for the degradation of TC was improved after being modified with PTh by blending based on either the degradation rate at 357 nm and 275 nm or the NPOC removal rate. From Fig. 2, we can also find that the PTh content in the PTh-ZIS composite photocatalyst had little influence on the photocatalytic degradation of TC. Similar results with degradation rates of ∼95% at 357 nm and ∼80% at 275 nm were obtained when the PTh content was 0.5%, 1% and 5% by weight. The average NPOC removal rate obtained by 1% PTh-ZIS was a little higher than 0.5% and 5% PTh-ZIS, so that 1% PTh was selected as the optimal amount for further experiments.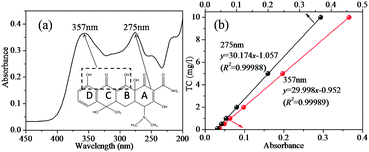 | ||
| Fig. 1 (a) The chemical structure and the characteristic UV-vis spectrum of tetracycline, (b) the calibration curve of peak absorbance based on 275 nm and 357 nm. | ||
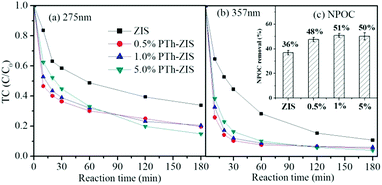 | ||
| Fig. 2 The photocatalytic degradation of tetracycline by pure ZIS and PTh-ZIS with different contents of PTh (a) based on 275 nm and (b) based on 357 nm. (c) NPOC removal rate (inset). | ||
3.2. Photocatalytic degradation of tetracycline based on different photocatalysts
The removal of TC via an adsorption process in the presence of various photocatalysts was evaluated separately in the dark (data are shown in the ESI† Fig. S1). The adsorption removal of TC was similar based on the data from 275 nm or 357 nm. It is reasonable that no chemical reaction occurred during adsorption and the TC molecule was just transferred from the aqueous solution to the solid photocatalyst. Therefore, the two typical peaks located at 357 nm and 275 nm in the TC molecule were proportionately decreased during adsorption. The adsorption removal of TC by different photocatalysts was maintained in the range of 40% to 60%. Furthermore, it is of great significance to report the influence of modification processing on the photocatalytic activity. As shown in Fig. 3, the removal rate of TC based on 275 nm and 357 nm and also NPOC revealed that all the modified composite photocatalysts exhibited enhancement of photocatalytic efficiency compared to pristine ZnIn2S4, indicating that polythiophene-modified ZnIn2S4, either by blending or by surface polymerization, could improve the photocatalytic activity. Though the enhancement was not significant, it was comparable with the enhancement by Sm-doped ZnIn2S4,8 TiO2–ZnIn2S4 (ref. 16) and rGO/ZnIn2S4 (ref. 18) in published research studies. In addition, the photocatalytic degradation of TC was enhanced by the CNT-ZIS composite as studied previously39 compared to pure ZnIn2S4, and the highest NPOC removal rate was obtained by further surface polymerization of polythiophene on CNT-ZIS (C-Z-PTS). However, changing the order of synthesis would tremendously affect the photocatalytic performance. For instance, the composite photocatalyst (PTh-C-Z), synthesized first by polymerization of polythiophene on MWCNT and then blending with ZIS, inhibited the degradation of TC compared with the CNT-ZIS photocatalyst.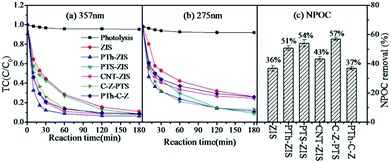 | ||
| Fig. 3 The performance of different photocatalysts on the photocatalytic degradation of tetracycline (a) based on 357 nm, (b) based on 275 nm. (c) NPOC removal rate. | ||
The photocatalytic degradation of TC would exert an effect on the decreasing tendency of 357 nm (Fig. 3(a)) and 275 nm (Fig. 3(b)) because of the chemical bond cleavage reaction derived from the attack of reactive species. According to the degradation rate at 357 nm, there were differences within the first 120 min and then tended to be stable with a removal rate of ∼95% at the end of 180 min of reaction. However, there were still differences among different photocatalysts based on the degradation rate at 275 nm after 180 min. Moreover, there was a direct correlation between the degradation rate at 275 nm and the NPOC removal rate (Fig. 3(c)). It is interesting to note that photocatalysts prepared by blending had a better degradation rate at 357 nm and photocatalysts prepared by surface polymerization showed a better removal rate at 275 nm and better NPOC removal. For the composite photocatalysts prepared by blending (PTh-ZIS, CNT-ZIS, PTh-C-Z), the degradation of TC at 357 nm proceeded relatively fast in the first 60 min and then gradually slowed down with prolonged reaction time (Fig. 3(a)) and the concentration of TC from 275 nm decreased continuously as the reaction time went on (Fig. 3(b)). This phenomenon demonstrated that the fragmentation of the extended chromophores connected to aromatic rings B–D occurred first, and then by-products with characteristic absorbance at 275 nm were accumulated. Therefore, the degradation of TC based on 275 nm was slower than that of 357 nm. However, a different degradation tendency was observed over the PTS-ZIS composite photocatalyst synthesized via surface polymerization. The concentration of TC decreased continuously with reaction time either at 357 nm or 275 nm, and finally it could achieve degradation efficiencies similar to that of PTh-ZIS of ∼95% removal rate at 357 nm and ∼80% at 275 nm and ∼50% NPOC removal. This indicated that the fragmentation of the chromophores connected to aromatic rings B–D and the enolic and acylamino groups connected to aromatic ring A proceeded simultaneously over the surface polymerized photocatalysts.
3.3. The effect of dopants on the performance of polythiophene/ZnIn2S4 based on blending and surface polymerization
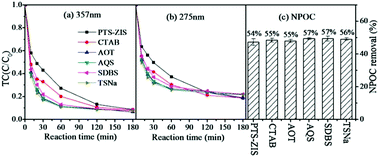
First, the dopant (CTAB, AOT, AQS, SDBS, TSNa) modified polythiophene had a negative impact on adsorption when the photocatalysts were prepared by blending (CAT3–CAT7) (Fig. S1(a)†). On the contrary, positive effects of dopants on adsorption were observed when composite photocatalysts were synthesized by surface polymerization (CAT9–CAT13) (Fig. S1(b)†). The effect of dopants on the photocatalytic degradation of TC based on the blending method is shown in Fig. 4. Compared with PTh-ZIS, all the dopants except AQS had a negative effect on the photocatalytic removal of TC and NPOC removal. Little enhancement was achieved when ZnIn2S4 was modified by AQS-doped polythiophene (CAT5). Previous research proved that the dopants could improve the conductivity of native-state polypyrrole.37 Polythiophene had a higher conductivity than polypyrrole in its native state,28 so the dopants had less influence on the performance of polythiophene/ZnIn2S4 synthesized by blending.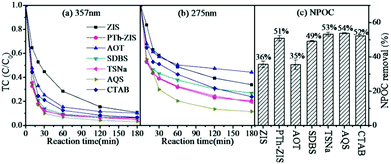 | ||
| Fig. 4 The photocatalytic degradation of tetracycline by PTh-ZIS with different dopants synthesized by the blending method (a) based on 357 nm, (b) based on 275 nm. (c) NPOC removal rate. | ||
In addition, Fig. 5 shows the effect of dopants based on surface polymerization modification. In accordance with the adsorption, the introduction of dopants had positive effects on the photocatalytic rate of TC though they had similar TC and NPOC removal rates at the end of the reaction after 180 min. The dopants in the polymer matrix could also stabilize the thiophene monomer with substrate through non-covalent interaction,38 which might be beneficial to the performance of composite photocatalysts synthesized by surface polymerization. Considering the two modification processes, including surface polymerization and blending, AQS used as a dopant could have some positive impacts on the photocatalytic performance of polythiophene/ZnIn2S4. A similar phenomenon was observed in the AQS-doped polypyrrole-modified ZnIn2S4 in our previous experiment.25 Previous research indicated that AQS could serve as an electron shuttle to accelerate electron transfer41 and also as an electron mediator for enhanced electrocatalytic performance.42
3.4. Characterization related to the photocatalytic property
From the above, PTh-ZIS synthesized by blending exhibited faster degradation of TC based on 357 nm and surface polymerization of PTS-ZIS had a higher TC removal rate at 275 nm and NPOC removal. Moreover, AQS-doped polythiophene-modified ZnIn2S4 by blending or surface polymerization (AQS-PTh-ZIS or AQS-PTS-ZIS) showed an additional increase of photocatalytic activity compared with pure polythiophene-modified ZnIn2S4 (PTh-ZIS or PTS-ZIS). It is necessary to explore the mechanism related to these differences. DRS, XRD, BET and TEM analyses were performed to further determine whether some characteristics of photocatalysts such as optical properties, morphology and crystallographic structure were influenced by modification processing or had some impact on the photocatalytic activity.The optical properties were studied using UV-vis diffuse reflectance spectroscopy (DRS). As illustrated in Fig. 6(a), the R% for the modified photocatalyst by blending (CAT2–CAT7) decreased in the range of 500 nm to 800 nm, indicating that the absorption was strengthened in the visible light region. The photographs of as-prepared samples (inset of Fig. 6(a)) show that the color changed from light yellow to grey when ZnIn2S4 was modified with polythiophene by blending. Pure polythiophene (PTh) exhibited a deep brick-red color and very low reflectance from the UV to the visible light region, indicating high absorbance of visible light as a photosensitizer. Fig. 6(b) shows the DRS spectra of photocatalysts modified by surface polymerization and the dark yellow color of the composite photocatalyst (CAT8–CAT13). A large difference in color was found between blending (grey) and surface polymerization (yellow-red color) modification method. The grey color in the blended photocatalyst samples was generated by blending the light yellow of ZnIn2S4 and the deep brick-red of PTh. However, a thin film of deep brick-red PTh covered the surface of ZnIn2S4 (light yellow), resulting in the yellow-red color for surface polymerization samples. Based on the Kubelka–Munk function, the F(R) is related to the diffuse reflectance through the following equation.30
 | (1) |
 | ||
| Fig. 6 DRS spectra of modified photocatalysts by blending (a) and surface chemical oxidative polymerization (b). Inset: photographs of as-prepared samples. (c) Corresponding F(R) curves. | ||
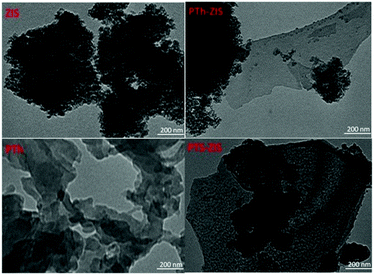
The XRD patterns of as-prepared samples (Fig. S2†) presented only two obvious diffraction peaks located at 32.5° and 55.6°, corresponding to the hexagonal phase of ZnIn2S4 (JCPDS No. 01-072-0773).43 The photocatalysts modified with pure or doped polythiophene by blending (PTh-ZIS or AQS-PTh-ZIS) and surface chemical polymerization (PTS-ZIS or AQS-PTS-ZIS) had similar profiles in XRD peak location, peak width and intensity. The morphology was observed through TEM images (Fig. 7). The size of ZIS fine particles was in the range of 10 nm to 20 nm, indicating that nanosized ZIS particles were obtained by the ethanol-thermal method in this research. The TEM images of blended PTh-ZIS samples clearly show that nanosheets and nanoparticles were mixed together at random. The neat PTh was composed of intertwined sheet structures attached to some round and rod-shaped particles with a size of about 30 nm. Therefore, the nanosheet morphology in these composite photocatalysts was attributed to the PTh. Unlike the loose and scattered particles in neat ZIS and blended samples, more dense and agglomerated particles with a size of more than 20 nm appeared in the surface polymerization samples (PTS-ZIS). Moreover, the TEM image shows that the particle surface was covered with a thin film, indicating the covering of polythiophene on the surface of ZIS.
N2 adsorption and desorption isotherms for all the photocatalysts at 77 K plotted as a function of P/P° are shown in Fig. S3.† According to the IUPAC classification, they exhibited a type IV isotherm which is attributed to monolayer–multilayer adsorption through capillary condensation taking place in their mesopores.44 The H3 hysteresis loop of the catalysts revealed the aggregation of plate-like particles giving rise to slit-shaped pores, which was in good agreement with TEM results. Some textural properties of photocatalyst samples such as surface area, pore diameter and pore volume are summarized in Table 1. The pristine ZnIn2S4 had a relatively high BET surface area of 188 m2 g−1, which was associated with the homogeneous and fluffy nanoparticles. The BET surface areas of CAT2 and CAT8 were 209 m2 g−1 and 155 m2 g−1, respectively, which suggested that the photocatalyst prepared via surface chemical polymerization showed reduced surface area in comparison with that synthesized by blending. This suggested that the covering of polythiophene on the surface of ZnIn2S4 had blocked some pores in ZnIn2S4, since the pure PTh had a low BET surface area of 13 m2 g−1. Moreover, the porosity decreased for CAT8 in comparison to CAT2 (see Table 1) because of the dense and agglomeration particles modified via surface polymerization, which was in good agreement with TEM results. Besides the above-mentioned properties, the generated ROS might be an important factor for the photocatalytic activity.
| Label | Samples | BET surface area (m2 g−1) | Pore diameter (4V/A by BET, Å) | Pore volume (cm3 g−1) |
|---|---|---|---|---|
| CAT1 | ZnIn2S4 | 188 | 52 | 0.24 |
| CAT2 | PTh-ZIS | 209 | 53 | 0.28 |
| CAT3 | CTAB-PTh-ZIS | 99 | 41 | 0.11 |
| CAT4 | AOT-PTS-ZIS | 162 | 42 | 0.17 |
| CAT5 | AQS-PTh-ZIS | 190 | 48 | 0.23 |
| CAT6 | SDBS-PTh-ZIS | 107 | 50 | 0.13 |
| CAT7 | TSNa-PTh-ZIS | 178 | 54 | 0.24 |
| CAT8 | PTS-ZIS | 155 | 42 | 0.16 |
| CAT9 | CTAB-PTS-ZIS | 154 | 45 | 0.17 |
| CAT10 | AOT-PTS-ZIS | 147 | 43 | 0.16 |
| CAT11 | AQS-PTS-ZIS | 184 | 43 | 0.31 |
| CAT12 | SDBS-PTS-ZIS | 153 | 43 | 0.16 |
| CAT13 | TSNa-PTS-ZIS | 153 | 44 | 0.17 |
| CAT14 | CNT-ZIS | 136 | 56 | 0.19 |
| CAT15 | C-Z-PTS | 113 | 60 | 0.17 |
| CAT16 | PTh-C-Z | 178 | 60 | 0.27 |
| — | PTh | 13 | 71 | 0.02 |
3.5. Detection of reactive oxygen species for different photocatalysts
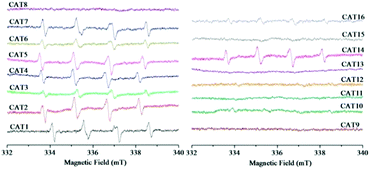
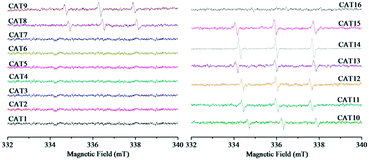
The generated ROS were detected in order to clarify whether the types of ROS were influenced by different modification processing. The ESR spectra of the DMPO-spin adducts are shown in Fig. 8. The special spectrum with four main peaks in a 1![[thin space (1/6-em)]](https://www.rsc.org/images/entities/char_2009.gif) :
:![[thin space (1/6-em)]](https://www.rsc.org/images/entities/char_2009.gif) 1
1![[thin space (1/6-em)]](https://www.rsc.org/images/entities/char_2009.gif) :
:![[thin space (1/6-em)]](https://www.rsc.org/images/entities/char_2009.gif) 1
1![[thin space (1/6-em)]](https://www.rsc.org/images/entities/char_2009.gif) :
:![[thin space (1/6-em)]](https://www.rsc.org/images/entities/char_2009.gif) 1 arrangement can be characteristic of the DMPO–˙O2− adduct.45 Among the as-prepared sixteen samples, the characteristic peaks of the DMPO–˙O2− adduct were observed in nine samples including pristine ZnIn2S4 (CAT1), CAT2–CAT7 (modified with PTh or doped PTh by blending), CNT-ZIS (CAT14) and PTh-CNT-ZIS (CAT16). This indicated that ˙O2− was produced in the photocatalytic process by the above-mentioned photocatalyst under visible light irradiation. A common phenomenon was that the final step for the preparation of these photocatalysts was the ethanol-thermal reaction with or without addition of other components such as PTh, doped PTh, CNT and PTh-CNT. No ESR signals of the DMPO–˙O2− adduct were observed for other photocatalysts such as CAT8–CAT13 (surface polymerization of PTh or doped PTh) and CAT15 (polymerization of PTh on the CNT-ZIS surface), which demonstrated that there was no superoxide radical produced by the photocatalysts modified by surface polymerization of PTh. In addition, TEMP was used to trap 1O2 with the formation of a TEMP–1O2 adduct. The typical ESR signals of three peaks with an intensity of 1
1 arrangement can be characteristic of the DMPO–˙O2− adduct.45 Among the as-prepared sixteen samples, the characteristic peaks of the DMPO–˙O2− adduct were observed in nine samples including pristine ZnIn2S4 (CAT1), CAT2–CAT7 (modified with PTh or doped PTh by blending), CNT-ZIS (CAT14) and PTh-CNT-ZIS (CAT16). This indicated that ˙O2− was produced in the photocatalytic process by the above-mentioned photocatalyst under visible light irradiation. A common phenomenon was that the final step for the preparation of these photocatalysts was the ethanol-thermal reaction with or without addition of other components such as PTh, doped PTh, CNT and PTh-CNT. No ESR signals of the DMPO–˙O2− adduct were observed for other photocatalysts such as CAT8–CAT13 (surface polymerization of PTh or doped PTh) and CAT15 (polymerization of PTh on the CNT-ZIS surface), which demonstrated that there was no superoxide radical produced by the photocatalysts modified by surface polymerization of PTh. In addition, TEMP was used to trap 1O2 with the formation of a TEMP–1O2 adduct. The typical ESR signals of three peaks with an intensity of 1![[thin space (1/6-em)]](https://www.rsc.org/images/entities/char_2009.gif) :
:![[thin space (1/6-em)]](https://www.rsc.org/images/entities/char_2009.gif) 1
1![[thin space (1/6-em)]](https://www.rsc.org/images/entities/char_2009.gif) :
:![[thin space (1/6-em)]](https://www.rsc.org/images/entities/char_2009.gif) 1 can be indexed as the TEMP–1O2 adduct.46 As shown in Fig. 9, in contrast to the signals of the DMPO–˙O2− adduct (Fig. 8), the characteristic triplet of the TEMP–1O2 adduct was observed in eight samples from CAT8 to CAT15. Apart from CAT14, there were no signals of the TEMP–1O2 adduct in the samples in which the signals of the DMPO–˙O2− adduct can be observed.
1 can be indexed as the TEMP–1O2 adduct.46 As shown in Fig. 9, in contrast to the signals of the DMPO–˙O2− adduct (Fig. 8), the characteristic triplet of the TEMP–1O2 adduct was observed in eight samples from CAT8 to CAT15. Apart from CAT14, there were no signals of the TEMP–1O2 adduct in the samples in which the signals of the DMPO–˙O2− adduct can be observed.
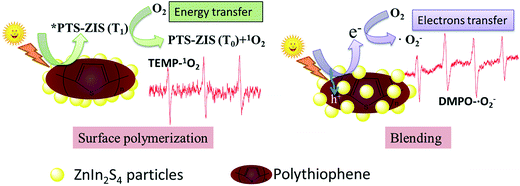
According to the ESR analysis, the types of ROS were greatly influenced by modification processing. Scheme 3 illustrates the generation of ROS based on surface polymerization and blending, that ˙O2− was generated through electron transfer in blended samples and 1O2 was generated through energy transfer in surface polymerization samples. The predominant ROS was ˙O2− in the ZnIn2S4 photocatalytic reaction system based on published research,3 so it is reasonable that ˙O2− was detected in this pristine ZnIn2S4 system. The optical property of ZnIn2S4 still dominated in the composite photocatalysts modified by blending (CAT2–CAT7), so the similar ROS (˙O2−) as ZnIn2S4 was observed. Normally, singlet oxygen (1O2) was generated through the energy transfer (not electron transfer) from the excited triplet state of photosensitizers to molecular oxygen.47 An energy value of approximately 94.5 kJ mol−1 above the ground state was needed for the excitation of ground state oxygen to singlet oxygen (1O2).48 In any case, the triplet-state photosensitizer must exceed this energy for the generation of singlet oxygen (1O2).48 Though polythiophene can act as a photosensitizer,26 the photocatalysts modified by blending of PTh were not efficient in the generation of singlet oxygen (1O2) so that ˙O2− was detected as the only ROS in these samples. However, the surface polymerization of polythiophene on ZnIn2S4 can make the composite photocatalysts generate their excited triplet state efficiently and further promote the generation of singlet oxygen (1O2). Therefore, singlet oxygen (1O2) was detected for the photocatalysts prepared by surface chemical oxidative polymerization (CAT8–CAT13 and CAT15). Exceptionally, both signals of TEMP–1O2 and DMPO–˙O2− adducts were observed in CNT-ZIS (CAT14). On the one hand, the preparation of CNT-ZIS by blending made it retain the main feature of ZnIn2S4 for generation of ˙O2−. On the other hand, the MWCNT might serve as a more efficient photosensitizer than PTh in blended composite photocatalysts, which can provide the required energy transfer for 1O2 generation. Though two kinds of ROS were produced in CAT14, it was not efficient in photocatalytic degradation of TC (Fig. 3). There might be interaction between ˙O2− and 1O2, thus weakening their reaction with organic compounds. In combination with the generated ROS and degradation tendency at 357 nm and 275 nm, the difference in the photocatalytic degradation tendency of TC was unique to the different ROS generated by photocatalysts prepared via blending or surface chemical polymerization.
4. Conclusions
We have explored how blending and the surface polymerization modification method affected the performance of catalysts for photocatalytic degradation of tetracycline and ROS generation. In comparison with inorganic carbon-based modification of ZnIn2S4 (CNT-ZIS), polythiophene modification was more efficient in degradation of tetracycline. Blending-based photocatalysts had a better degradation rate at 357 nm, while photocatalysts prepared by surface polymerization showed a better removal rate at 275 nm and better NPOC removal. The NPOC removal rate was dependent upon the degradation of TC based on the characteristic peak at 275 nm. The difference in the photocatalytic degradation tendency of TC was unique to the different generated ROS. On the basis of ESR results, blending-based samples generated superoxide radical (˙O2−), while singlet oxygen (1O2) was detected as the only ROS for photocatalysts modified by surface polymerization.Conflicts of interest
There are no conflicts to declare.Acknowledgements
The corresponding author wants to acknowledge the support from the National Natural Science Foundation of China (51708442), the Natural Science Foundation of Shaanxi province (2017JQ5019) and the Scientific Research Project from the Education Department of Shaanxi Province (17JK0452).Notes and references
- B. Gao, S. Dong, J. Liu, L. Liu, Q. Feng, N. Tan, T. Liu, L. Bo and L. Wang, Chem. Eng. J., 2016, 304, 826–840 CrossRef CAS.
- Y. Chen, R. Huang, D. Chen, Y. Wang, W. Liu, X. Li and Z. Li, ACS Appl. Mater. Interfaces, 2012, 4, 2273–2279 CAS.
- L. Su, X. Ye, S. Meng, X. Fu and S. Chen, Appl. Surf. Sci., 2016, 384, 161–174 CrossRef CAS.
- Z. X. Chen, D. Li, G. Xiao, Y. He and Y. Xu, J. Solid State Chem., 2012, 186, 247–254 CrossRef CAS.
- B. Gao, L. Liu, J. Liu and F. Yang, Appl. Catal., B, 2013, 129, 89–97 CrossRef CAS.
- R. M. Mohamed, A. Shawky and M. S. Aljahdali, J. Taiwan Inst. Chem. Eng., 2016, 65, 498–504 CrossRef CAS.
- S. Shen, L. Zhao, Z. Zhou and L. Guo, J. Phys. Chem. C, 2008, 112, 16148–16155 CAS.
- C. Tan, G. Zhu, M. Hojamberdiev, K. Lokesh, X. Luo, L. Jin, J. Zhou and P. Liu, J. Hazard. Mater., 2014, 278, 572–583 CrossRef CAS PubMed.
- J. Liu, W. Fang, Z. Qin, Z. Jiang and W. Shangguan, Catal. Sci. Technol., 2018, 8, 1375–1382 CAS.
- B. Gao, L. F. Liu, J. D. Liu and F. L. Yang, Appl. Catal., B, 2014, 147, 929–939 CrossRef CAS.
- S. Wan, M. Ou, Q. Zhong, S. Zhang and F. Song, Chem. Eng. J., 2017, 325, 690–699 CrossRef CAS.
- S. Zhang, L. Wang, C. Liu, J. Luo, J. Crittenden, X. Liu, T. Cai, J. Yuan, Y. Pei and Y. Liu, Water Res., 2017, 121, 11–19 CrossRef CAS PubMed.
- S. Wan, Q. Zhong, M. Ou and S. Zhang, J. Mater. Sci., 2017, 52, 11453–11466 CrossRef CAS.
- J. Chen, F. Xin, H. Niu, C. Mao and J. Song, Mater. Lett., 2017, 198, 1–3 CrossRef CAS.
- W. Lim, M. Hong and G. W. Ho, Dalton Trans., 2016, 45, 552–560 RSC.
- Y. Xia, Q. Li, K. L. Lv and M. Li, Appl. Surf. Sci., 2017, 398, 81–88 CrossRef CAS.
- F. Guo, Y. Cai, W. Guan, H. Huang and Y. Liu, J. Phys. Chem. Solids, 2017, 110, 370–378 CrossRef CAS.
- J. Chen, H. Zhang, P. Liu, Y. Li, X. Liu, G. Li, P. Wong, T. An and H. Zhao, Appl. Catal., B, 2015, 168, 266–273 CrossRef.
- Y. Chen, H. Ge, L. Wei, Z. Li, R. Yuan, P. Liu and X. Fu, Catal. Sci. Technol., 2013, 3, 1712–1717 CAS.
- H. Li, H. Yu, S. Chen, H. Zhao, Y. Zhang and X. Quan, Dalton Trans., 2014, 43, 2888–2894 RSC.
- W. Shi, H. Lv, S. Yuan, H. Huang, Y. Liu and Z. Kang, Sep. Purif. Technol., 2017, 174, 282–289 CrossRef CAS.
- X. Li, G. Jiang, G. He, W. Zheng, Y. Tan and W. Xiao, Chem. Eng. J., 2014, 236, 480–489 CrossRef CAS.
- W. Li, Y. Tian, C. Zhao, Q. Zhang and W. Geng, Chem. Eng. J., 2016, 303, 282–291 CrossRef CAS.
- B. Gao, W. Chen, S. Dong, J. Liu, T. Liu, L. Wang and M. Sillanpaa, J. Photochem. Photobiol., A, 2017, 349, 115–123 CrossRef CAS.
- B. Gao, Z. Safaei, I. Babu, S. Iftekhar, E. Iakovleva, V. Srivastava, B. Doshi, S. Ben Hammouda, S. Kalliola and M. Sillanpaa, J. Photochem. Photobiol., A, 2017, 348, 150–160 CrossRef CAS.
- U. Riaz, S. Ashraf and J. Kashyap, Mater. Res. Bull., 2015, 71, 75–90 CrossRef CAS.
- Y. Wang, W. Chu, S. Wang, Z. Li, Y. Zeng, S. Yan and Y. Sun, ACS Appl. Mater. Interfaces, 2014, 6, 20197–20204 CAS.
- W. Dai, H. Xu, J. Yu, X. Hu, X. Luo, X. Tu and L. Yang, Appl. Surf. Sci., 2015, 356, 173–180 CrossRef CAS.
- Y. Nosaka and A. Y. Nosaka, Chem. Rev., 2017, 117, 11302–11336 CrossRef CAS PubMed.
- T. Zoltan, M. C. Rosales and C. Yadarola, J. Environ. Chem. Eng., 2016, 4, 3967–3980 CrossRef CAS.
- S. Obregón, M. A. Ruíz-Gómez and D. B. Hernández-Uresti, J. Colloid Interface Sci., 2017, 506, 111–119 CrossRef PubMed.
- U. Mehmood, A. Al-Ahmed and I. A. Hussein, Renewable Sustainable Energy Rev., 2016, 57, 550–561 CrossRef CAS.
- K. Reddy, M. Hassan and V. Gomes, Appl. Catal., A, 2015, 489, 1–16 CrossRef CAS.
- Y. Duan, Q. Luo, D. Wang, X. Li, J. An and Q. Liu, Superlattices Microstruct., 2014, 67, 61–71 CrossRef CAS.
- W. Fan, C. Chen, H. Bai, B. Luo, H. Shen and W. Shi, Appl. Catal., B, 2016, 195, 9–15 CrossRef CAS.
- G. Z. Liao, S. Chen, X. Quan, H. Chen and Y. B. Zhang, Environ. Sci. Technol., 2010, 44, 3481–3485 CrossRef CAS PubMed.
- S. Zhang, Q. Y. Chen, Y. H. Wang and L. J. Guo, Int. J. Hydrogen Energy, 2012, 37, 13030–13036 CrossRef CAS.
- T. S. Swathy, M. A. Jose and M. J. Antony, Polymer, 2016, 103, 206–213 CrossRef CAS.
- B. Chai, T. Y. Peng, P. Zeng and X. H. Zhang, Dalton Trans., 2012, 41, 1179–1186 RSC.
- Y. Wang, H. Zhang and L. Chen, Catal. Today, 2011, 175, 283–292 CrossRef CAS.
- S. Orsetti, C. Laskov and S. B. Haderlein, Environ. Sci. Technol., 2013, 47, 14161–14168 CrossRef CAS PubMed.
- S. Zhao, G. Q. Zhang, L. Fu, L. F. Liu, X. H. Fang and F. L. Yang, Electroanalysis, 2011, 23, 355–363 CrossRef CAS.
- X. L. Gou, F. Y. Cheng, Y. H. Shi, L. Zhang, S. J. Peng, J. Chen and P. W. Shen, J. Am. Chem. Soc., 2006, 128, 7222–7229 CrossRef CAS PubMed.
- K. S. W. Sing, D. H. Everett, R. A. W. Haul, L. Moscou, R. A. Pierotti, J. Rouquerol and T. Siemieniewska, Pure Appl. Chem., 1985, 57, 603–619 CrossRef CAS.
- Y. L. Song, J. Y. Tian, S. S. Gao, P. H. Shao, J. Y. Qi and F. Y. Cui, Appl. Catal., B, 2017, 210, 88–96 CrossRef CAS.
- X. D. Zhu, Y. J. Wang, W. X. Qin, S. C. Zhang and D. M. Zhou, Chemosphere, 2016, 144, 628–634 CrossRef CAS PubMed.
- X. F. Zhang and N. Feng, Spectrochim. Acta, Part A, 2018, 189, 13–21 CrossRef CAS PubMed.
- K. Plaetzer, B. Krammer, J. Berlanda, F. Berr and T. Kiesslich, Lasers Med. Sci., 2009, 24, 259–268 CrossRef CAS PubMed.
Footnote |
| † Electronic supplementary information (ESI) available: The adsorption removal of tetracycline by various photocatalysts; XRD spectra of different photocatalysts; N2 adsorption–desorption graphs for all the catalysts. See DOI: 10.1039/c8cy00303c |
| This journal is © The Royal Society of Chemistry 2018 |

