Probing the conformational dynamics of photosystem I in unconfined and confined spaces†
Gaurav
Das‡
ab,
Shyamtanu
Chattoraj‡§
c,
Somen
Nandi
 c,
Prasenjit
Mondal
 ab,
Abhijit
Saha¶
a,
Kankan
Bhattacharyya
 *d and
Surajit
Ghosh
 *ab
*ab
aOrganic & Medicinal Chemistry Division, CSIR-Indian Institute of Chemical Biology, 4, Raja S. C. Mullick Road, Jadavpur, Kolkata-700032, West Bengal, India. E-mail: sghosh@iicb.res.in; Fax: +91-33-2473-5197; Fax: +91-33-2473-0284; Tel: +91-33-2499-5872
bAcademy of Scientific and Innovative Research (AcSIR), CSIR-Indian Institute of Chemical Biology Campus, 4 Raja S. C. Mullick Road, Kolkata 700 032, India
cDepartment of Physical Chemistry, Indian Association for the Cultivation of Science, Jadavpur, Kolkata 700032, India
dDepartment of Chemistry, Indian Institute of Science Education & Research Bhopal, Bhopal Bypass Road, Bhauri, Bhopal-462 066, Madhya Pradesh, India
First published on 23rd November 2017
Abstract
The fluorescence dynamics of Photosystem I (PSI) in bulk water and inside a confined environment like a liposome have been investigated using time resolved confocal microscopy. In bulk water, PSI exhibits a major emission peak at ∼680 nm, while in the liposome it exhibits a markedly blue shifted emission maximum at ∼485 nm. This is indicative of conformational changes due to entrapment and emergence of a stressed conformation of PSI inside the liposome. The observed time constants for the fluorescence lifetime of PSI inside the liposome are significantly high as opposed to PSI in bulk water. More interestingly, the fluorescence intensity of PSI in bulk water exhibits strong fluctuations with many high intensity jumps and these are anti-correlated with the fluorescence lifetime of PSI. In contrast, inside the liposome, no such anti-correlated behaviour is observed. We further demonstrated that PSI exhibits at least two conformational states in bulk water, whereas a single conformation is observed inside the liposome, indicating the conformational rigidity and locking of the PSI complex inside a liposome.
Introduction
Photosystem I (PSI) is a protein complex present in a photosynthetic organism, which is a key photochemical reaction center that catalyzes light dependent electron transfer.1,2 PSI is a multi-subunit protein complex that with the help of light energy produces high energy carriers like ATP and NADPH.3 The concept of plants having two different photosystems emerged from early spectroscopic studies.4 PSI is known to generate a large negative redox potential and uses light energy efficiently to transport electrons from plastocyanin on the lumenal side to ferredoxin on the stromal side of the thylakoid membrane.5 The PSI complex isolated from plants generally consists of 175 chlorophyll molecules, 2 phylloquinones and 3 Fe4S4 clusters.6 Since it is such a complex system, several biophysical studies have been conducted to understand the molecular level architecture of photosynthetic pigment–protein complexes. Several studies have shown that PSI pigments exhibit an emission maximum at 735 nm at low temperature, while at room temperature only the maximum at 685 nm is displayed.7 It has also been observed that the fluorescence quantum yield at room temperature decreases with increasing intensity of laser light.8 This may be attributed to multiple excitations, leading to exciton annihilation.9 It is already known that purified aggregates of chlorophyll a/b proteins have a shorter lifetime than solubilized monomeric proteins due to this exciton–exciton annihilation facilitated in the aggregate by a larger population of chlorophylls.10 Exciton annihilation refers to a transfer process in high excitation intensity where there is a collision of two excitations within a pool of chromophores.11Another interesting aspect that has emerged in this field is the studies concerning the measurement of the fluorescence lifetime (τ) or average fluorescence decay time. The fluorescence lifetime of chlorophyll a in plants is ∼0.7 ns, while in Anacystis and Porphyridium it is 0.5 ns.12 The decay of chlorophyll fluorescence at 4 °C in stabilized PSII isolated from spinach has been measured using multi-frequency cross-correlation phase fluorometry.13 This measurement has generated two lifetime components of chlorophyll a (25 ps and 35 ps) at 4 °C, which correspond to the time of charge separation and the time of charge recombination.14
Apart from this, there have been many reports on fluorescence anisotropy measurements of these systems. The fluorescence anisotropy of PSI particles isolated from spinach chloroplasts has been reported.15 Even in Mn-depleted PSII, the g-anisotropy of the tyrosine radical YZ˙ has been investigated to have a clear understanding of the mechanism of YZ˙ proton-coupled electron transfer.16 Recently, single molecule spectroscopy has been employed to investigate the conformational dynamics of several biomolecules including photosynthetic pigment–protein complexes,17,18 enzymes19,20 and other organized assemblies.21–23 In a recent study, Moerner and co-workers detected four conformational states of a photosynthetic protein complex, out of which only one shows anti-correlated behavior in intensity and lifetime.18,24 However, the structural dynamics of the isolated photosystem have not been explored to a great extent.
PSI is a sensitive protein complex and is easily degradable. Thus, stabilization of PSI is an important issue. Liposomes embedded with purified large protein complexes have become powerful tools for studying the structural and functional aspects of these protein complexes.25–27 It has been reported previously that large protein complexes such as light-harvesting chlorophyll a/b (LHCIIb) of PSII, upon reconstitution into a liposome, cause enhancement of thermal stability and regulate the photochemical activity.25,26 Further study reveals that micelles, formed from a suitable surfactant, can stabilize PSI by improving its structural integrity.27 However, the dynamics of PSI in confined and congested cell like liposomal systems have recently attracted much more attention because of the requirement of structural optimization for various reasons such as electron transport, etc., and thus they are yet to be explored.
In the present work, we applied time resolved confocal microscopy to study the dynamics associated with the conformational transitions of isolated PSI in bulk water and inside a confined system (i.e. liposome). For this study, first we isolated PSI particles from spinach leaves and characterized them through various spectral studies in bulk water and then entrapped them in a liposome. We calculated the dwell time distribution of PSI in a high intensity and low lifetime conformational state and explained the results in terms of local and global conformational changes in PSI.
Results and discussion
Fluorescence spectra and decays of PSI in bulk water
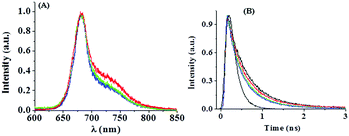
Fig. 1(A) shows fluorescence spectra of isolated PSI in bulk water. It has been observed that there is a maximum at ∼682 nm with a shoulder at ∼730 nm. A similar observation was found previously.28 It may be mentioned that the spectra were recorded at room temperature under a confocal microscope. At room temperature, fluorescence spectra of PSI are dominated by a major peak at ∼680 nm, with a shoulder at ∼730 nm. In the present case, we also found similar results. In addition, we found that each single PSI complex is different, which exhibits different fluorescence spectra characterized by different ratios of intensities of the 680 nm and 730 nm bands.Fig. 1(B) shows fluorescence decays of isolated PSI in bulk water. The decays are dominated by a major short component of ∼0.45 ns and a minor long component of ∼2.5 ns (Table 1). Interestingly, the decay becomes faster with increase in laser power. The lifetime components of PSI decrease upon increasing the laser power from 10% to 70% as shown in Table 1. This may indicate the presence of protein conformational induced exciton–exciton annihilation processes in the excited state of PSI.
| Laser power (%) | τ 1 (ns) (a1) | τ 2 (ns) (a2) |
|---|---|---|
| a ±10%, τ1 and τ2 are the individual time components with their associated amplitudes a1 and a2, respectively. | ||
| 10 | 0.45 (0.90) | 2.5 (0.10) |
| 25 | 0.38 (0.95) | 1.3 (0.05) |
| 50 | 0.32 (0.85) | 0.9 (0.15) |
| 70 | 0.30 (0.85) | 0.8 (0.15) |
Fluctuations in the fluorescence intensity and lifetime of PSI in bulk water
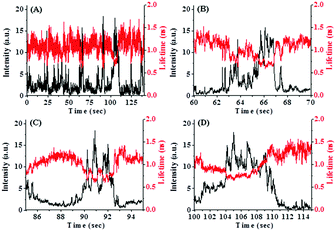
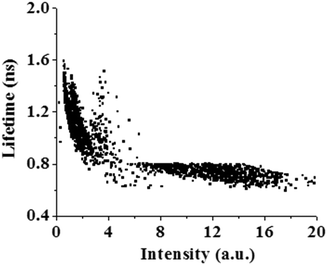
The most interesting finding of the present work is the fluctuations of the fluorescence intensity and lifetime of PSI in bulk water. Fig. 2 shows fluctuations in the fluorescence intensity and lifetime of PSI. Different reversible transitions in intensity have been detected, some of which are weakly fluorescent and metastable in nature. The expanded regions in different time windows are shown in Fig. 2(B)–(D). We observed both large and small amplitude jumps in intensity. In addition, it has been found that for all time windows, the fluorescence intensity and lifetime are anti-correlated with each other, i.e. an increase in fluorescence intensity is accompanied by a decrease in fluorescence lifetime and vice versa. This is a surprising observation since an increase in fluorescence intensity generally corresponds to an increase in lifetime. Previously, Moerner and co-workers investigated the conformational dynamics of a light harvesting protein, allophycocyanin.18 They detected multiple conformational states in which intensity and lifetime were found to be correlated, anti-correlated or non-correlated. The population of anti-correlated intensity-lifetime states was lower in their case. In our case, we observed the anti-correlation between the intensity and lifetime of PSI, exclusively for all time windows.We plotted the fluorescence intensity and lifetime of PSI, in terms of a 2D scatter plot (Fig. 3). This plot was generated by assembling intensity and its corresponding lifetime from seven individual experiments. It is observed from Fig. 3 that there are at least two conformational states of PSI: one state has a higher intensity but a lower lifetime, while the other has a lower intensity and a higher lifetime. This demonstrates that PSI exists in at least two detectable conformational states. In addition, we detected another conformational state with significant lifetime fluctuations at near-constant intensity (Fig. 2(D)). The origin of this conformational state may be explained considering the fluctuations of the spontaneous (natural) emission lifetime as reported previously.18 Previously, Moerner and co-workers detected four conformational states of a photosynthetic protein complex, out of which only one exhibits anti-correlated behavior in intensity and lifetime.18 In the present study, we observe this feature, exclusively. The exact reason behind the observation of such conformational states is not clear. However, it may involve light induced conformational changes of the PSI which modulate the fluorescence intensity and lifetime in an anti-correlated manner.
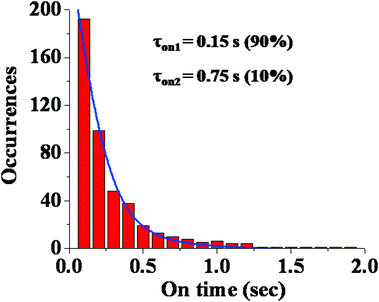
We also calculated the dwell time distribution of PSI in a high intensity and low lifetime conformational state. Fig. 4 shows the dwell time histogram which is bi-exponential in nature. We detected two dwell times – one short time of ∼0.15 s (90%) and one longer time of ∼0.75 s (10%). It is evident that the contribution of the shorter dwell time component is major. This indicates that most of the conformational transitions occur at a relatively faster rate. It may be mentioned that the structure of PSI is highly complex involving many pigment–protein interactions. So, it is obvious that such a multi-protein–pigment assembly may involve both short and long range conformational fluctuations. Thus, the observation of a short dwell time may indicate a short scale conformational change (locally), while the longer dwell time suggests a relatively large scale structural change (globally).
Fluctuations in the fluorescence anisotropy of PSI in bulk water
In order to investigate the origin of such conformational changes observed above, we studied single molecule polarization (i.e. anisotropy) properties of PSI. Fig. 5 shows fluctuations in fluorescence anisotropy with time for PSI in bulk water. It has been observed that significant changes in the anisotropy are detected for certain time periods only. Interestingly, such changes in anisotropy are accompanied by large scale changes in fluorescence intensity as observed in Fig. 2(B)–(D). In contrast, there is no significant change in the fluorescence anisotropy for the time periods which exhibit small amplitude intensity jumps. The large scale intensity fluctuations may involve an out of plane orientation of the PSI and results in a significant change in fluorescence anisotropy.17 Thus, we attribute the longer dwell time observed in Fig. 4 to the large scale conformational change of PSI involving the out of plane orientation.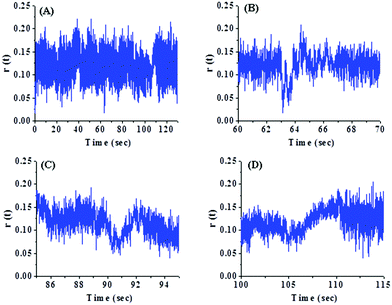 | ||
| Fig. 5 Fluctuations in fluorescence anisotropy with time for PSI in bulk water recorded under a confocal microscope: (A) full time scale and (B)–(D) expanded time scales. | ||
Confocal image, fluorescence spectrum and decay of PSI in a liposome
In this section, we discuss how the photo-physical properties of a PSI are altered when it is entrapped in a liposome or in a confined space. Fig. 6(A) depicts the confocal image of PSI inside a liposome. Inside the liposome, PSI exhibits an emission maximum at ∼485 nm (Fig. 6(B)). This indicates that the emission spectrum of PSI inside the liposome is drastically blue shifted compared to that in bulk water (∼680 nm). This demonstrates a large structural change of PSI inside the liposome.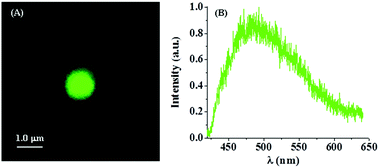 | ||
| Fig. 6 PSI encapsulated in a liposome: (A) confocal image and (B) fluorescence spectrum, recorded under a confocal microscope. λex = 405 nm. | ||
Inside the liposome, PSI changes to a blue-green emitting species compared to a red-emitting species in bulk water. Such blue-green emission of PSI has been reported previously and has been shown to play an important role under confined conditions.29,30 Thus, the observation of the blue-green emission of PSI inside the liposome may indicate a large scale conformational change due to its entrapment in the liposome and the consequent emergence of a rigid conformation.
Fig. 7 shows a comparison of the fluorescence decays of PSI in bulk water and inside a liposome. The fluorescence lifetime is fitted to a bi-exponential decay with time components of ∼0.65 ns (0.65) and ∼4.0 ns (0.35). It is quite obvious that these lifetime components are much higher compared to those in bulk water (Table 1). This indicates that the rates of non-radiative processes are suppressed inside the liposome due to local confinement. In the next section, we will discuss how this change in the photo-physical properties of PSI inside the liposome is manifested in the fluorescence intensity time trajectories.
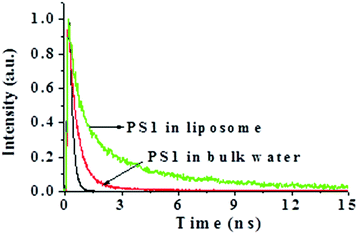 | ||
| Fig. 7 Comparison of the fluorescence decays of PSI in bulk water (red, λem = 690 nm) and in a liposome (green, λem = 480 nm). λex = 405 nm for both. | ||
Fluctuations in the fluorescence intensity and lifetime of PSI in a liposome
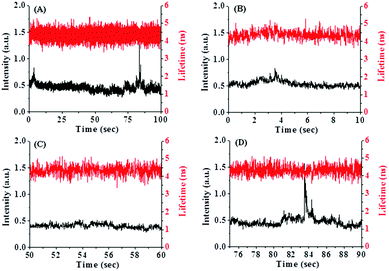
Fig. 8 shows the variation of the fluorescence intensity and lifetime of PSI with time inside the liposome. PSI, encapsulated in a confined environment like a liposome, also displays fluctuations in fluorescence intensity with time (Fig. 8, black lines) like in bulk water. The fluctuations in fluorescence intensity are not so significant as compared to the bulk water, except for only one high intensity jump inside the liposome (Fig. 8(D), black line). It may be mentioned here that a liposome without encapsulated PSI (i.e. control liposome) doesn’t show any fluctuation in fluorescence intensity with time (Fig. S1, ESI†). More interestingly, the fluorescence lifetime of PSI inside the liposome doesn’t exhibit any fluctuation and remains nearly constant throughout the entire observation period (Fig. 8, red lines). As a consequence, there is no such correlation/anti-correlation between the intensity and lifetime of PSI in the liposome. This is in sharp contrast to the PSI in bulk water where fluorescence intensity and lifetime are anti-correlated and involves many high intensity jumps. This indicates conformational locking of the PSI inside the liposome due to the large scale structural change, which eventually provides a conformational rigidity of the PSI.The 2D scatter plot of the fluorescence intensity and lifetime of PSI inside a liposome is depicted in Fig. 9. This indicates the presence of a single conformational state of PSI inside the liposome.
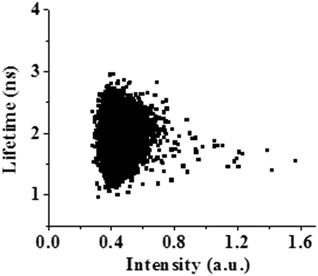 | ||
| Fig. 9 2D scatter plot of the fluorescence intensity vs. lifetime of PSI encapsulated in a liposome. This indicates the presence of only one conformational state of PSI. | ||
Fluctuations in the fluorescence anisotropy of PSI in a liposome
We also investigated the variation of fluorescence anisotropy with time for PSI inside the liposome (Fig. 10). As shown in Fig. 10, there are no significant fluctuations of fluorescence anisotropy with time for any time period. Even for the one high intensity state, observed in Fig. 8(D), the fluorescence anisotropy doesn’t display any transition. This reconciles the conformational locking and trapping of the PSI in a rigid structure inside the liposome.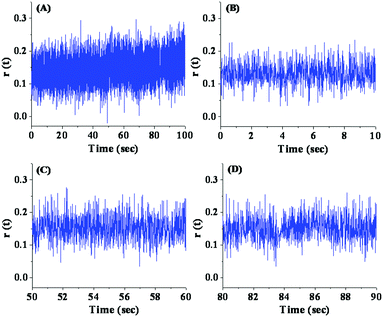 | ||
| Fig. 10 Fluctuations in fluorescence anisotropy with time for PSI inside the liposome recorded under the confocal microscope: (A) full time scale and (B)–(D) expanded time scales. | ||
Experimental
Materials
All chemicals were used without further purification.
Methods
The procedure for preparation of physiologically relevant buffers and lipid–oil mixture and other details are given in the ESI.†![[thin space (1/6-em)]](https://www.rsc.org/images/entities/char_2009.gif) 000g for 5 min and the pellet was resuspended in a small volume of water. This is the chlorophyll containing solution. The absorbance (A) of the chlorophyll solution was taken at 664 and 648 nm, and its concentration was calculated using the formula [Cchlorophyll (a+b) = (5.24 × A664 + 22.24 × A648) μg mL−1]. Then 0.8% (w/v) Triton-X-100 was added to the chlorophyll solution and stirred for 30 min to separate out the PSI from other chloroplast complexes and then again centrifuged at 42
000g for 5 min and the pellet was resuspended in a small volume of water. This is the chlorophyll containing solution. The absorbance (A) of the chlorophyll solution was taken at 664 and 648 nm, and its concentration was calculated using the formula [Cchlorophyll (a+b) = (5.24 × A664 + 22.24 × A648) μg mL−1]. Then 0.8% (w/v) Triton-X-100 was added to the chlorophyll solution and stirred for 30 min to separate out the PSI from other chloroplast complexes and then again centrifuged at 42![[thin space (1/6-em)]](https://www.rsc.org/images/entities/char_2009.gif) 000g for 30 min. The supernatant was collected and loaded onto 25 mL of a linear sucrose gradient (0.1 to 2 M) and centrifuged at 1
000g for 30 min. The supernatant was collected and loaded onto 25 mL of a linear sucrose gradient (0.1 to 2 M) and centrifuged at 1![[thin space (1/6-em)]](https://www.rsc.org/images/entities/char_2009.gif) 00
00![[thin space (1/6-em)]](https://www.rsc.org/images/entities/char_2009.gif) 000g at 4 °C for 18 h. A dark green band observed at the interface of 1 and 2 M sucrose solutions was collected and homogenized; aliquots were made and stored at −80 °C. The PSI concentration was thus determined from the absorbance measurement at 595 nm using Bradford reagent and the BSA standard curve.
000g at 4 °C for 18 h. A dark green band observed at the interface of 1 and 2 M sucrose solutions was collected and homogenized; aliquots were made and stored at −80 °C. The PSI concentration was thus determined from the absorbance measurement at 595 nm using Bradford reagent and the BSA standard curve.
Mixture A. At first, to make a single lipid layer, a 100 μL of a lipid–oil mixture was carefully added on top of 200 μL of external buffer (EB) and then kept in an ice bath for 2 h.
Mixture B. 5 μL of plain internal buffer (IB) (for a control experiment) and IB with PSI solution were separately added to 600 μL of a lipid–oil mixture in two different micro-centrifuge tubes and kept at 4 °C for 5 min. Then, we made an emulsion of those solutions using a Hamilton syringe and again incubated at 4 °C for 10 min. After that, 200 μL of mixture B was carefully added to mixture A (in two different micro-centrifuge tubes) and kept in an ice bath for another 5 min. Then, those solutions were centrifuged for 12 min at the rate of 110g, 5 min for 350g and 3 min for 560g serial wise at 4 °C. The upper oil portions were aspirated out carefully with a pipette and the remaining portion was an EB containing with or without PSI encapsulated liposomes.32
Imagic(t) = I‖(t)![[thin space (1/6-em)]](https://www.rsc.org/images/entities/char_2009.gif) cos2(54.75°) + I⊥(t)·G·sin2(54.75°) = (1/3)I‖(t) + 2/3·G·I⊥(t) cos2(54.75°) + I⊥(t)·G·sin2(54.75°) = (1/3)I‖(t) + 2/3·G·I⊥(t) | (1) |
 | (2) |
Conclusions
By applying time resolved confocal microscopy, we explore the dynamics of the PSI complex in bulk water and inside a confined system like a liposome. Significant differences in terms of emission maxima, lifetimes, intensity fluctuations and conformational states were observed inside a liposome compared to the bulk. We demonstrate that the fluorescence lifetime of PSI entrapped inside the liposome was found to be quite larger compared to that in the bulk water. Although the fluorescence intensity of PSI in bulk water exhibited strong fluctuations with many high intensity jumps and was anti-correlated with the fluorescence lifetime, at the same time, when trapped inside the liposome, no such fluctuations and anti-correlation behavior between fluorescence intensity and lifetime were observed. Furthermore, when the fluorescence anisotropy was varied with time, PSI entrapped inside the liposome didn’t display any fluctuations in fluorescence anisotropy compared to the PSI in bulk water. We show that PSI exhibits at least two conformational states in bulk water but only a single conformation was observed inside the liposome, indicating conformational locking of PSI inside a liposome. All these events only reflect the fact that PSI inside the liposome undergoes conformational rigidity due to the large scale structural changes of the PSI. The information obtained in this study provides new insight into the conformational transitions of photosynthetic pigment–protein complexes in isolated PSI.Conflicts of interest
The authors declare no conflicts of interest.Acknowledgements
SG thanks the Department of Biotechnology, India, for providing an extramural grant (BT/PR19159/NNT/1043/2016). KB thanks the Department of Science and Technology, India, for providing extramural grant IR/S1/CU 02/2009. We thank the Council of Scientific and Industrial Research (CSIR) and the JC Bose Fellowship Program for generous research support. GD thanks the Indian Council of Medical Research (ICMR), India. PM, SN and AS kindly acknowledge CSIR, India, for awarding their fellowships. We thank Dr Mary Anne Conti (NHLBI, NIH, USA) and Dr Biman Jana (Department of Physical Chemistry, IACS, India) for reading the manuscript and helpful discussions.Notes and references
- B. Andersen, H. V. Scheller and B. L. Møller, FEBS Lett., 1992, 311, 169 CrossRef CAS PubMed.
- P. E. Jensen, R. Bassi, E. J. Boekema, J. P. Dekker, S. Jansson, D. Leister, C. Robinson and H. V. Scheller, Biochim. Biophys. Acta, 2007, 1767, 335 CrossRef CAS PubMed.
- A. Amunts and N. Nelson, Structure, 2009, 17, 637 CrossRef CAS PubMed.
- F. Franck, P. Juneau and R. Popovic, Biochim. Biophys. Acta, 2002, 1556, 239 CrossRef CAS.
- N. Nelson and C. F. Yocum, Annu. Rev. Plant Biol., 2006, 57, 521 CrossRef CAS PubMed.
- A. Ben-Shem, F. Frolow and N. Nelson, Nature, 2003, 426, 630 CrossRef CAS PubMed.
- N. E. Geacintov and J. Breton, Biophys. J., 1977, 17, 1 CrossRef CAS PubMed.
- D. Mauzerall, Biophys. J., 1976, 16, 87 CrossRef CAS PubMed.
- A. J. Campillo, S. L. Shapiro, V. H. Kollman, K. R. Winn and R. C. Hyer, Biophys. J., 1976, 16, 93 CrossRef CAS PubMed.
- T. M. Nordlund and W. H. Knox, Biophys. J., 1981, 36, 193 CrossRef CAS PubMed.
- B. Brüggemann and V. May, J. Chem. Phys., 2003, 118, 746 CrossRef.
- G. S. Singhal and E. Rabinowitch, Biophys. J., 1969, 9, 586 CrossRef CAS PubMed.
- Govindjee, M. vandeVen, C. Preston, M. Seibert and E. Gratton, Biochim. Biophys. Acta, 1990, 1015, 173 CrossRef CAS.
- M. Mimuro, I. Yamazaki, S. Itoh, N. Tamai and K. Satoh, Biochim. Biophys. Acta, 1988, 933, 478 CrossRef CAS.
- A. Andreeva and M. Velitchkova, Photosynth. Res., 2000, 65, 15 CrossRef CAS PubMed.
- J. M. Keough, D. L. Jenson, A. N. Zuniga and B. A. Barry, J. Am. Chem. Soc., 2011, 133, 11084 CrossRef CAS PubMed.
- G. S. Schlau-Cohen, Q. Wang, J. Southall, R. J. Cogdell and W. E. Moerner, Proc. Natl. Acad. Sci. U. S. A., 2013, 110, 10899 CrossRef CAS PubMed.
- R. H. Goldsmith and W. E. Moerner, Nat. Chem., 2010, 2, 179 CrossRef CAS PubMed.
- Y. He, M. Lu and H. Peter Lu, Phys. Chem. Chem. Phys., 2013, 15, 770 RSC.
- Y. He, Y. Li, S. Mukherjee, Y. Wu, H. Yan and H. P. Lu, J. Am. Chem. Soc., 2011, 133, 14389 CrossRef CAS PubMed.
- A. Pabbathi, S. Patra and A. Samanta, ChemPhysChem, 2013, 14, 2441 CrossRef CAS PubMed.
- R. Yadav, B. Sengupta and P. Sen, J. Phys. Chem. B, 2014, 118, 5428 CrossRef CAS PubMed.
- W. E. Moerner, Proc. Natl. Acad. Sci. U. S. A., 2007, 104, 12596 CrossRef CAS PubMed.
- B. K. Muller, E. Zaychikov, C. Brauchle and D. C. Lamb, Biophys. J., 2005, 89, 3508 CrossRef PubMed.
- C. Yang, S. Boggasch, W. Haase and H. Paulsen, Biochim. Biophys. Acta, 2006, 1757, 1642 CrossRef CAS PubMed.
- Z. Yang, X. Su, F. Wu, Y. Gong and T. Kuang, J. Photochem. Photobiol., B, 2005, 78, 125 CrossRef CAS PubMed.
- X. Wang, G. Huang, D. Yu, B. Ge, J. Wang, F. Xu, F. Huang, H. Xu and J. R. Lu, PLoS One, 2013, 8, e76256 CAS.
- R. Pedrós, I. Moya, Y. Goulas and S. Jacquemoud, Photochem. Photobiol. Sci., 2008, 7, 498 Search PubMed.
- S. V. Mantha, G. A. Johnson and T. A. Day, Photochem. Photobiol., 2001, 73, 249 CAS.
- F. Stober and H. K. Lichtenthaler, Radiat. Environ. Biophys., 1993, 32, 357 CrossRef CAS PubMed.
- A. Saha, S. Mohapatra, G. Das, B. Jana, S. Ghosh, D. Bhunia and S. Ghosh, ACS Appl. Mater. Interfaces, 2017, 9, 176 CAS.
- S. Nandi, P. Mondal, R. Chowdhury, A. Saha, S. Ghosh and K. Bhattacharyya, Phys. Chem. Chem. Phys., 2016, 18, 30444 RSC.
- S. Ghosh, S. Nandi, C. Ghosh and K. Bhattacharyya, ChemPhysChem, 2016, 17, 2818 CrossRef CAS PubMed.
- S. Chattoraj and K. Bhattacharyya, J. Phys. Chem. C, 2014, 118, 22339 CAS.
- R. Chowdhury, S. Nandi, R. Halder, B. Jana and K. Bhattacharyya, J. Chem. Phys., 2016, 144, 065101 CrossRef PubMed.
- S. Mohapatra, S. Nandi, R. Chowdhury, G. Das, S. Ghosh and K. Bhattacharyya, Phys. Chem. Chem. Phys., 2016, 18, 18381 RSC.
Footnotes |
| † Electronic supplementary information (ESI) available. See DOI: 10.1039/c7cp07375e |
| ‡ These authors contributed equally. |
| § Present Address: Department of Genetics, Harvard Medical School. |
| ¶ Present Address: The Hebrew University of Jerusalem, Israel. |
| This journal is © the Owner Societies 2018 |

