Melanin-manganese nanoparticles with ultrahigh efficient clearance in vivo for tumor-targeting T1 magnetic resonance imaging contrast agent†
Wen
Xu‡
a,
Jinghua
Sun‡
 a,
Liping
Li
a,
Xiaoyang
Peng
a,
Ruiping
Zhang
*ab and
Binquan
Wang
*b
a,
Liping
Li
a,
Xiaoyang
Peng
a,
Ruiping
Zhang
*ab and
Binquan
Wang
*b
aDepartment of imaging of Shanxi Provincial Cancer Hospital, Molecular Imaging Precision Medical Collaborative Innovation Center, Shanxi Medical University, Platform of Shanxi Scientific and Technological Innovation, Taiyuan 030001, China
bShanxi Key Scientific and Technological Innovation Platform for Precision Diagnosis and Treatment of Head and Neck Cancer, The First Hospital, Shanxi medical University, Taiyuan 03001, China. E-mail: zrp_7142@163.com
First published on 21st November 2017
Abstract
Endogenous biomaterials in organisms, with native biocompatibility and biodegradability, appear more advantageous in the development of nanoscale diagnostic and therapeutic systems for future clinical translation. Herein, a novel tumor-targeting Magnetic Resonance Imaging (MRI) contrast agent was developed based on Mn2+-chelating ultrasmall water-soluble melanin nanoparticles (MNP-PEG-Mn). The nanoparticles, with a size of about 5.6 nm, presented high chelation stability and showed negligible cytotoxicity as estimated by MTT assay. Moreover, the r1 longitudinal relaxivity (20.56 mM−1 s−1) of MNP-PEG-Mn was much higher than that of Gadodiamide (6.00 mM−1 s−1), which is a clinically approved MRI contrast agent. In vivo MRI experiments revealed excellent tumor-targeting specificity after tumor-bearing mice were intravenously injected with MNP-PEG-Mn. Additionally, MNP-PEG-Mn could be excreted via renal and hepatobiliary pathways with negligible toxicity to body tissues. These preliminary results indicated the clinically translatable potential of MNP-PEG-Mn as a T1 MRI contrast agent for tumor-targeted imaging.
1. Introduction
Magnetic resonance imaging (MRI), as one of the most prominent clinical imaging techniques, providing noninvasive anatomical and physiological information with high spatial and temporal resolution, has shown great potential in the early detection and accurate localization of tumors for decreasing tumor mortality.1–3 In particular, the rapid advancement of MRI has been accelerated by the development of exogenous contrast agents that can effectively improve diagnostic sensitivity and accuracy by shortening the relaxation times of the protons in water.4,5 Among MRI contrast agents, gadolinium chelates have been widely used and studied in the clinic due to their predominant positive signal enhancement.6–8 However, some studies have demonstrated that Gd-based contrast agents increased the risk of nephrogenic systemic fibrosis in patients, which is a rare, idiopathic systemic fibrosing disorder that can be critical to patients with acute or chronic kidney disease, or severely impaired renal function.9,10 Furthermore, it is also reported that the use of Gd-based contrast agents could lead to brain abnormalities in healthy patients.11 Manganese (Mn)-based contrast agents, as alternatives to Gd-based contrast agents, have been receiving more attention lately for use in MRI as they have better biosafety.12–14 Manganese is not only a natural cellular constituent but also plays a critical role in cell and mitochondrial function.15In recent years, numerous Mn-based nanoscale MRI contrast agents have been developed. Some manganese complexes based on small molecules have attracted considerable interest,16,17 however low sensitivity, non-specificity and fast elimination from the circulation system still remain challenging problems. Besides, various morphologies of manganese oxide, such as nanoplates,18,19 mesoporous silica-coated hollow nanoparticles20 and PLGA encapsulated nanocrystals,21 have also been reported for MRI due to their potential physiological function and high resolution.22,23 These nanoscale systems showed enhanced relaxivity and high accumulation in tumors via enhanced permeability and retention (EPR) effects, promoting their potential as MRI contrast agents for cancer diagnosis. However, the non-biodegradability and potential long-term toxicity of these inorganic nanosystems have remarkably impeded their progress for future clinical translation. Endogenous biomaterials in organisms, with native biocompatibility and biodegradability, appear more advantageous and may address the biosafety issues in vivo. Nevertheless, most organic structures, such as cells24 and ferritines,25 need complicated and time-consuming synthetic procedures to develop them into MRI contrast agents, due to their lack of contrast properties. Thus, exploring endogenous materials with high contrast properties is more promising for in vivo MRI and clinical translation.
Melanin, an irregular biopolymer and a ubiquitous natural pigment, presents in many organisms. It has attracted much attention because of its good biocompatibility and biodegradability, contrast properties and metal ion chelation, which are appealing for the fabrication of MRI contrast agents. For example, Ju and co-workers prepared melanin-like nanoparticles and chelated Fe3+ for an MRI contrast agent.26 Nevertheless, a good MRI contrast agent not only needs high relaxivity, excellent tumor-targeting ability and good biosafety, but rapid clearance properties also remain an important goal. The large size and poor solubility of the above-mentioned melanin-like nanoparticles apparently increased the difficulty of metabolising the nanoparticles and led to their accumulation in vivo. Recently, we prepared ultrasmall water-soluble melanin nanoparticles (MNPs) that preserve many of the properties of melanin, and can be used as a good endogenous nanoplatform for tumor multimodality imaging and imaging-guided therapy.27–29 The ultrasmall scale nanostructures have strong surface effects, which allow for enhanced exposure of metal ions and further complexation with more hydrophilic ligands. The high surface area and increased number of hydrophilic ligands enhance the relaxivity of the MRI contrast agent.30 Meanwhile it has been reported that nanoparticles smaller than 6 nm in diameter can undergo renal clearance.31,32 Therefore, it is highly desirable to explore an ultrasmall water-soluble melanin-Mn based MRI contrast agent with highly efficient clearance for tumor-targeting imaging, while the correlative research has not yet been reported to the best of our knowledge.
Herein, a novel MRI contrast agent has been constructed based on ultrasmall PEG-modified MNP and chelated Mn2+ (MNP-PEG-Mn). A schematic illustration of the preparation process is shown in Fig. 1. The physicochemical properties and in vitro behaviors of MNP-PEG-Mn were thoroughly examined with transmission electron microscopy (TEM), dynamic light scattering (DLS), relaxivity measurements, MTT assays, and confocal microscopy. Subsequently, the in vivo MRI performance was studied on tumor-bearing mice. Interestingly, the nanoparticles show significant signal enhancement in tumors and could be entirely cleared by the liver and kidneys. All of these properties make MNP-PEG-Mn highly promising as an MRI contrast agent for potential clinical translation.
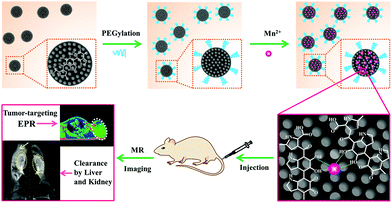 | ||
| Fig. 1 Schematic illustration of the construction of tumor-targeting MRI contrast agent with ultrahigh efficient clearance in vivo, based on Mn2+-chelating melanin nanoparticles. | ||
2. Experimental
2.1. Materials
Melanin was acquired from Sigma-Aldrich. Sodium hydroxide (NaOH), hydrochloric acid (37 wt% HCl) and MnCl2·4H2O were purchased from Sinopharm Chemical Reagent Beijing Co., Ltd. Amine-PEG5000-amine (NH2-PEG5000-NH2, 5 kDa) was obtained from Shanghai Zzbio Co., Ltd. All of the reagents were purchased and used without further purification. Phosphate buffered saline (PBS) and 4,6-diamidino-2-phenylindole (DAPI) were purchased from Boster Biological Technology Co., Ltd.2.2. Preparation of MNP-PEG-Mn
MNPs were prepared according to a previously reported method with slight modifications.27 Briefly, 10 mg Melanin was dissolved in 3 mL of 0.1 M NaOH aqueous solution under vigorous stirring. After dissolving, HCl aqueous solution (0.1 M) was swiftly dropped into the basic melanin solution to adjust the pH to 7.5 under sonication for 2.5 min. A dark black melanin aqueous solution was obtained. The neutralized solution was further centrifuged using 30 kDa molecular weight cut off (MWCO) filters and washed with deionized water, this was repeated several times to remove the NaCl and other small melanin fragments that were produced. The aqueous solvent was removed by freeze-drying to obtain MNPs.For good biocompatibility, the commercially available NH2-PEG5000-NH2 was used to modify the surface of the MNPs. 0.1 M NaOH solution was added to the MNP aqueous solution (1 mg mL−1 of water) to adjust the pH of the solution to 9.5. 20 mg NH2-PEG5000-NH2 aqueous solution with pH = 9.5 was added dropwise to the MNP aqueous solution. After vigorous stirring for 12 h, the PEG-modified MNPs were centrifuged and washed several times to remove the free NH2-PEG5000-NH2. The resulting products, labeled MNP-PEG, were obtained by freeze-drying for further application.
1 mL of 2 mg mL−1 fresh MnCl2 solution was added to the MNP-PEG (2 mg mL−1) aqueous solution to chelate Mn2+. After incubation for 1 h at room temperature, the complexes were washed with water several times and then purified using a PD-10 column. The products, marked as MNP-PEG-Mn, were washed out by PBS solution and passed through a 0.22 μm Millipore filter into a sterile tube for in vitro and animal experiments.
The stability of manganese ion-chelated MNP-PEG was studied by incubating MNP-PEG-Mn in a PBS solution (pH = 7.4) and acetic acid-sodium acetate buffer solution (pH = 5.5) at 37 °C. MNP-PEG-Mn was placed in a dialysis tube (MWCO 3500D) with magnetic stirring. At a certain time, the dialysate was removed and replaced with fresh PBS solution or acetic acid-sodium acetate buffer solution. The Mn2+ concentration in the dialysate was measured by inductively coupled plasma mass spectrometry (ICP-MS, Thermal Elemental X7, Thermo Electron Co., USA) analysis. To evaluate the physiological stability, MNP-PEG-Mn (1 mg) was dispersed into a solution with 50% fatal bovine serum (FBS, 5 mL) and 50% PBS solution (5 mL), and then incubated at 37 °C for 24 h. Its hydrodynamic size was determined at 0 h, 2 h, 4 h, and 24 h by DLS measurements.
2.3. Characterization of MNP-PEG-Mn
TEM images were recorded on a JEM-2100F microscope with an accelerating voltage of 200 kV. The hydrodynamic size and zeta potential were investigated using a Nano-Zetasizer system (Malvern Instruments Ltd). The chemical properties of MNP-PEG-Mn were measured by an iS50 Fourier transform-infrared (FT-IR) spectrometer using the KBr method in transmission mode in the range 500–4000 cm−1.2.4. Cell culture and animal tumor model
The human laryngeal cancer Hep-2 cell line was purchased from the Type Culture Collection of the Chinese Academy of Sciences (Shanghai, China). The Hep-2 cells were cultured in Dulbecco's modified Eagle's medium (DMEM, GIBCO) supplemented with 10% (v/v) fetal bovine serum (FBS) (HyClone, Logan, UT, USA) and 100 μg mL−1 penicillin/streptomycin (HyClone, Logan, UT, USA) in a humidified incubator at 37 °C under 5% CO2. The cell morphology was monitored daily and cell passaging was done every 3 days at 50% confluence. For cell passaging and cell experiments, cells were detached by incubating with trypsin and collected via centrifugation (5 min, 1000 RPM, 4 °C).Female nude mice (5–7 weeks, 18 ± 2 g) were purchased from Hunan slack King experimental animal Co. and housed in an isolated animal room with water and rodent food supplements to acclimatize for 2 weeks before use. All animal experiments were conducted in accordance with the relevant laws and institutional guidelines following the approval of the Ethics Committee of the Chinese Academy of Sciences. To induce a tumor, 1 × 106 KB Hep-2 cells were suspended in 100 μL of PBS solution and injected subcutaneously into the flank region of the nude mice. The tumor size was measured periodically using a slide caliper, the animals were observed daily for any behavioral abnormalities and weighed weekly. When the volume of the tumors approached 150 mm3, the mice were used for the MRI studies.
2.5. In vitro cytotoxicity assay
The in vitro cytotoxicity of MNP-PEG-Mn was measured in Hep-2 cells and NIH 3T3 cells using a 3-(4,5-dimethylthiazol-2-yl)-2,5-diphenyltetrazolium bromide (MTT) assay. The cells were seeded in 96-well plates at a density of 8000 cells per well and incubated for 24 h at 37 °C under 5% CO2 to allow the cells to attach before the experiment. Then, the cells were washed with PBS solution and replaced with the complete medium with a series of concentrations of MNP-PEG and MNP-PEG-Mn (1600, 800, 400, 200, 100, 50, 25, and 0 μg mL−1) for another 24 h. The culture medium was discarded and the cells were subsequently washed several times with PBS solution. Fresh culture medium, containing 20 μL of MTT solution (5 mg mL−1), was added to each well. After incubation for 4 h in the CO2 incubator, the MTT solution was carefully removed and replaced with 100 μL of dimethyl sulfoxide. Finally, the absorbance of each well was measured with a microplate reader, using a wavelength of 550 nm as the test wavelength and 650 nm as the reference wavelength (Infinite M1000; TECAN, Morrisville, NC, USA). The absorbance of the untreated cells was used as a control and its absorbance was used as the reference value for calculating 100% cellular viability. All of the experiments were independently performed three times.2.6. Cellular uptake studies
2.7. In vitro MRI study
In vitro MRI experiments were performed at 25 °C in a 3.0 T MR clinical scanner (Magnetom Trivo with Tim, Siemens, Germany) with a wrist surface coil (diameter: 11 cm). For the measurement of T1, relaxivity (r1) and T1-weighted MR images, 200 μL of MNP-PEG-Mn and Gadodiamide aqueous solutions with different concentrations (0.025, 0.05, 0.1 and 0.2 mM) were transferred to tubes, and the data were acquired with spin-echo acquisition on a NMR-analyzer (GY-PNMR-10). The imaging parameters were as follows: field of view (FOV), 90 × 60 mm2; slice thickness, 1.5 mm; spacing, 0.5 mm; base matrix resolution, 256 × 256; repetition time (TR), 500 ms; and effective echo time (TE), 20 ms. The r1 values were calculated from the slope of the curve-fitting of 1/T1 (s−1) versus the metal ion concentration (mM).2.8. In vivo MRI study
The animal study was approved by the Institutional Animal Use and Care Committee of Shan Xi Medical University (approval no. 2016LL141). The tumor-bearing mice were anesthetized using an intraperitoneal injection of 1% pentobarbital sodium (40 mg kg−1), then the axial and coronal MR images of the tumor-bearing mice were collected as the data of pre-injection. Afterward, the mice (n = 3) were treated with 200 μL of the sample in PBS solution (8 mg mL−1 based on the MNP concentration) through tail intravenous injection. The axial images of the tumor location were collected at 0.5 h, 24 h and 48 h, and meanwhile, the coronal images were also obtained at particular time intervals (0.5 h, 1 h, 24 h, 48 h, 72 h and 120 h) using 3.0 T clinical MRI equipment (Trivo, Siemens) with a wrist surface coil (diameter: 11 cm). The imaging sequence parameters were as follows: FOV, 90 × 60 mm2; slice thickness, 5 mm; spacing, 0.5 mm; base resolution matrix, 256 × 256; TR, 500 ms; and TE, 20 ms. Imaging analysis was performed using Image J software.2.9. In vivo toxicity assessment
2.10. Statistical analysis
The variance and t tests were used to analyze the data. The data are presented with their mean and standard deviation (SD), and p < 0.05 was considered as statistically significant. All statistical analyses were performed using SPSS 22.0 for Windows (Chicago, IL, USA).3. Results and discussion
3.1. Preparation and characterization of MNP-PEG-Mn
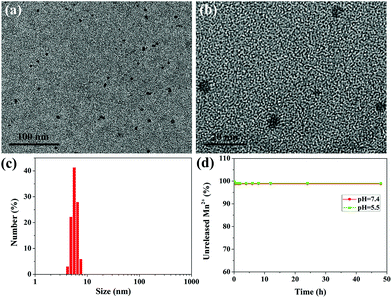
The ultrasmall water-soluble MNPs were prepared according to a previous method,27 which preserved good biocompatibility and biodegradability, high contrast properties and excellent metal ion chelation. To retain the water-solubility, prolong the circulation time in the blood and further improve the in vivo behavior, polyethylene glycol (PEG) was introduced into the ultrasmall MNPs, which was a simple, time-saving, and low energy-consuming modification process.33 The successful PEGylation can be verified by the FT-IR spectra (Fig. S1†); the characteristic absorption peaks of MNP-PEG at 2880 cm−1 belong to the alkyl C–H stretching and the peak at 1110 cm−1 is attributed to the C–O–C stretching in the PEG molecules. Fig. S2†shows a representative TEM image and size distribution of MNP-PEG, which suggest that MNP-PEG was well dispersed with uniform size and shape, and the mean hydrodynamic diameter was about 3.6 nm. The zeta potential of MNP-PEG was measured to be −25.4 ± 2.3 mV. The MNPs can bind with metal ions owing to the existence of catechol groups.27,28,34 After chelation of Mn2+, the results of TEM and DLS measurements are shown in Fig. 2a–c. The MNP-PEG-Mn was still monodispersed, while the average diameter became larger and increased to approximately 5.6 nm (Fig. S3†). Moreover, the surface potential decreased to −13.5 ± 0.6 mV because of the introduction of positive Mn2+. The number of Mn2+ ions chelated to the MNP-PEG was calculated to be about 55 per MNP.To check the leakage of Mn2+ from MNP-PEG-Mn, the dialysis experiments of MNP-PEG-Mn in PBS solution (pH = 7.4) and acidic buffer solution (pH = 5.5) were performed. The results indicated that only about 1% of the Mn2+ ions were released from MNP-PEG-Mn in the first 2 h, and there was no further release at longer incubation time periods, even after 48 h (Fig. 2d), indicating the strong chelating stability of MNP-PEG-Mn. The metal ions released in the first 2 h may derive from those that were absorbed on MNP-PEG-Mn through weak electrostatic interactions. The physiological stability of MNP-PEG-Mn was investigated by measuring the change in the hydrodynamic size distribution of the nanoparticles in serum and the results are shown in Fig. S4.†The hydrodynamic size of MNP-PEG-Mn showed little significant change after incubation for 24 h in serum, indicating good physiological stability.
3.2. In vitro cytotoxicity assay
Before in vivo application of MNP-PEG-Mn, Hep-2 cells were employed to evaluate the cytotoxicity of MNP-PEG and MNP-PEG-Mn with various concentrations over 24 h using a standard MTT assay. The standard non-cancerous cells (NIH 3T3 fibroblasts) were used as a normal contrast group and the results are shown in Fig. 3 and Fig. S5.†The samples presented negligible cytotoxicity before and after Mn2+ chelation, whether using Hep-2 cells or NIH 3T3 cells, even at manganese concentrations up to 1600 μg mL−1. This favorable result may be attributed to the low cytotoxicity and the good native biocompatibility of melanin. Thus, the in vitro cell viability results showed that MNP-PEG-Mn can be used as an MRI contrast agent for in vivo tumor diagnosis.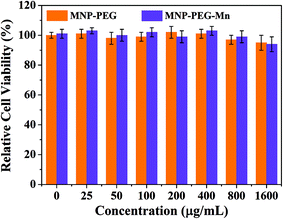 | ||
| Fig. 3 In vitro experiments. Relative viabilities of Hep-2 cells incubated with MNP-PEG and MNP-PEG-Mn nanoparticles at various concentrations for 24 h using a MTT assay. | ||
3.3. Cellular uptake studies
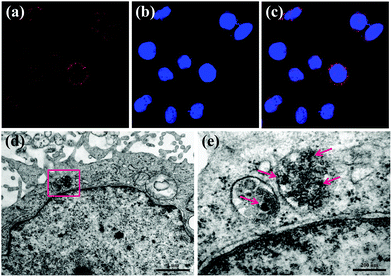
The cellular uptake behaviors and subsequent localization of MNP-PEG-Mn have been estimated by CLSM and bio-TEM after Hep-2 cells were incubated with 200 μg mL−1 MNP-PEG-Mn for 24 h. The CLSM images of MNP-PEG-Mn chelated with rhodamine are shown in Fig. 4a–c. MNP-PEG-Mn can be clearly seen in the cytoplasm after incubation for 24 h, as shown by the red fluorescence from rhodamine lighting up the nuclei, suggesting the existence of Hep-2 cells which uptake the chelated nanoparticles.To further understand the detailed localization of MNP-PEG-Mn after cellular uptake, Hep-2 cells treated with the same concentration of MNP-PEG-Mn for a period of 24 h were fixed, and infiltrated with resin. Then, thin sections of the fixed cells were imaged using TEM, as shown in Fig. 4d and e. The darker contrast in various regions indicates a high level of aggregation of nanoparticles within the cells. As the magnification was increased, MNP-PEG-Mn could be clearly seen within the organelles, which was likely taken up via passive endocytosis where the nanoparticles were engulfed into the cell and located within endosomes or lysosomes.
3.4. MRI in vitro
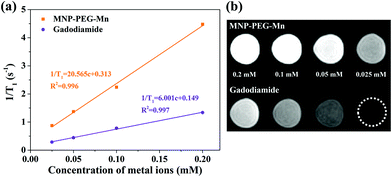
To explore the potential of MNP-PEG-Mn as a T1 MRI contrast agent, the longitudinal relaxivity (r1), which reflects the ability to shorten the T1 longitudinal relaxation time of water protons, was measured on a 3 T MRI scanner at 35 °C. At the same time, Gadodiamide, a commercial MRI contrast agent used in clinics, was selected as a control. The final values were calculated from the slope of the curves in Fig. 5a. It can be seen that the MR signal significantly enhanced with increasing concentrations of MNP-PEG-Mn, suggesting the nanoparticles generated a high magnetic field gradient on their surface. The r1 value of MNP-PEG-Mn is 20.57 mM−1 s−1, which is about 3.4 times higher than commercial Gadodiamide (6.00 mM−1 s−1). The high relaxivity of MNP-PEG-Mn could be attributed to the strong surface effects of the ultrasmall scale nanostructures, which exposed more metal ions and chelated with hydrophilic ligands. Further research on the T1-weighted images (Fig. 5b) revealed that MNP-PEG-Mn presented significantly brighter images than Gadodiamide at the same metal ion concentration. These results suggested that MNP-PEG-Mn had better MRI enhancement than Gadodiamide.3.5. MRI in vivo
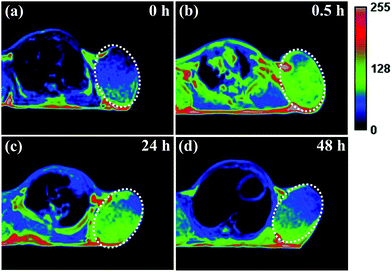
It has been reported that ultrasmall-sized nanoparticles can cross the blood-brain barrier and accumulate in the tumor region by the EPR effect.6 The in vivo performance of MNP-PEG-Mn, used as a tumor-targeting MRI contrast agent, was evaluated with 3.0 T clinical MRI equipment using tumor-bearing mice. Samples were intravenously injected into the mice at a melanin concentration of 1.6 mg per mouse, and the axial T1-weighted MR images were acquired pre-injection and at appropriate time intervals (0 h, 0.5 h, 24 h and 48 h) after injection (as shown in Fig. 6). It can be seen that obvious enhanced signal and prominent positive contrast effects were achieved in the tumor region at 0.5 h after the injection of the samples, suggesting a great number of nanoparticles have accumulated according to the EPR effect. The MR signals of the tumor tissue became slightly weaker at the 24 h time interval, but could still be clearly detected. Finally, the signal showed a sharp decrease at 48 h, due to the metabolism of MNP-PEG-Mn.To better understand the change of the MR signal in the location of the tumor, the signal intensities of the tumor and the muscle, estimated by Image J Software, were quantitatively analyzed. On the whole, the tumor without injection showed a lower signal intensity of 458 ± 2% and the muscle showed a signal intensity of 355 ± 3% as the control. The intensity value at the tumor site increased to 567 ± 7% in 0.5 h after injection, while the intensity in the muscle only showed a small increase of 361 ± 2%, indicating high uptake in the tumor. After 24 h, the tumor site had a reduced signal of about 530 ± 4%, while the signal value of the muscle did not significantly change. Finally, the values of the tumor and the muscle decreased at 48 h to 455 ± 2% and 358 ± 4% respectively, similar to the values pre-injection. According to the published results, the high intensity value of 567 ± 7% for the tumor is sufficient to detect the location of tumor tissues.8,35 Therefore, MNP-PEG-Mn exhibited excellent contrast effects and high tumor-targeting ability.
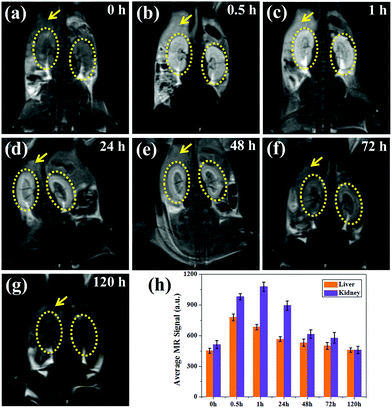
To study the metabolic behavior of the nanoparticles in vivo, coronal images were obtained at the same time points, as shown in Fig. 7a–g. Impressively, a high T1-weighted contrast of the livers and kidneys can be observed, in which the contrast of the renal pelvis is visible after 0.5 h and lights up 1 h post-injection. Moreover, the kidney showed higher brightness than the liver, suggesting that most of the ultrasmall nanoparticles are metabolized by the kidney, which is in agreement with previous reports.31,32,36 As the kidneys filter metabolites from the bloodstream through the basal lamina, which has pores of approximately 10 nm, some small nanoparticles show enhanced renal accumulation and long retention time (∼24 h), which are also beneficial for kidney imaging. Thus MNP-PEG-Mn can not only accumulate in tumors and allow for tumor imaging due to its EPR effect, but also can serve as a kidney-targeting MRI contrast agent. After 48 h, the MR signals of the liver and kidneys remarkably decreased, and the MR images at the 72 h time point showed little difference compared with those pre-injection, indicating MNP-PEG-Mn could be completely excreted via renal and hepatobiliary pathways.
For quantitative analysis, the signal intensity of the region of interest on the liver and kidney of each T1-weighted MR image was measured, as shown in Fig. 7h. The average intensity of the liver increased immediately from 452 ± 23% at 0 h to 778 ± 34%, and the intensity of the kidneys enhanced from 512 ± 40% at 0 h to 982 ± 30% at 0.5 h after the injection of MNP-PEG-Mn. The signal intensity of the kidneys continually increased to 1080 ± 45%, while that of liver decreased to 685 ± 26% at 1 h, further confirming that the nanoparticles can be eliminated by the liver and kidneys, especially by the kidneys. After 48 h, the signal contrast was not obvious compared with the image taken pre-injection, indicating that most nanoparticles had been cleared from the body. Therefore, MNP-PEG-Mn not only displayed excellent contrast properties, but also could be very efficiently excreted via the liver and kidney pathways after the MR imaging in vivo, this reduces the toxic effects caused by the long-term accumulation of conventional nanoparticles in various organs, and enhances the biosafety.
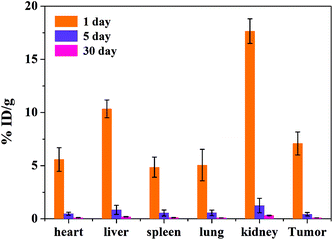
The biodistribution of the tumor-bearing mice (n = 3) after tail vein injection with the same concentration of the MRI contrast agent MNP-PEG-Mn after 1, 5 and 30 days is shown in Fig. 8. The mice were sacrificed and then the Mn2+ levels were measured in various organs using ICP-MS. The results revealed that the nanoparticles were mainly cleared by the kidneys and liver, which is consistent with the MRI results in vivo. The accumulation in various organs after 1 day is obviously higher than that after 5 days and 30 days. With increasing time, the nanoparticles were gradually cleared. At 5 days, only the kidneys had a small accumulation of 1.26 ± 0.68 %ID g−1, and the nanoparticles in the various organs were undetectable at 30 days. The results suggested that most of the MNP-PEG-Mn could be excreted mainly through the renal and hepatobiliary systems after 5 days.
3.6. Toxicity studies
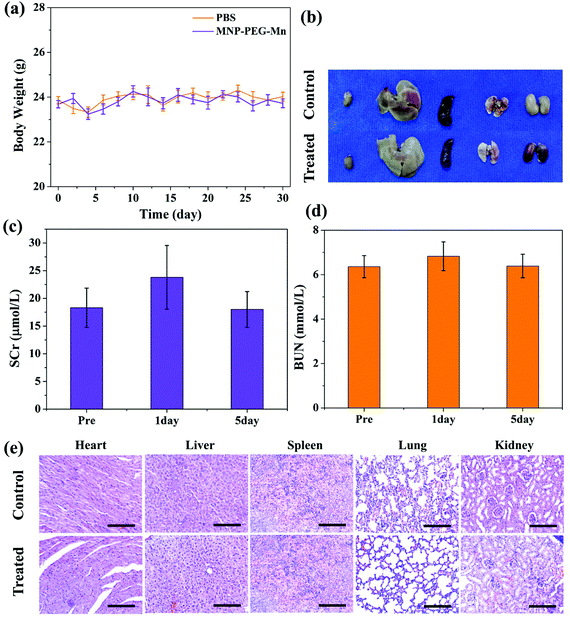
The in vivo toxicity of MNP-PEG-Mn was also investigated in detail. By intravenous injection of MNP-PEG-Mn, at a dose of 3.2 mg per mouse, which is 2 times that of the in vivo imaging dose, no noticeable abnormal behavior and weight change (as shown in Fig. 9a) were observed among those mice receiving a high dose of MNP-PEG-Mn. Three mice were sacrificed at 24 h post-injection of MNP-PEG-Mn. The photos of the harvested organs including the heart, liver, spleen, lung and kidneys are shown in Fig. 9b. No remarkable differences were observed except in the kidneys. The kidneys became black because most of the melanin nanoparticles are cleared by the kidney (Fig. 7 and 8). The blood chemistry examination serum creatinine (SCr) and urea nitrogen (BUN), the specific serological markers for kidney function, were measured for the blood samples of the above mice. The detection indexes of SCr and BUN remained within the normal ranges (Fig. 9c and d), suggesting that intravenous injection of MNP-PEG-Mn had no major renal toxicity. To further confirm the toxicity of MNP-PEG-Mn, the main organs were analyzed by H&E staining, as shown in Fig. 9e. The results indicated that MNP-PEG-Mn has no appreciable adverse effect on these main organ tissues. In short, these in vivo results validated that MNP-PEG-Mn showed excellent biocompatibility and therefore could be used as a promising contrast agent for MRI.4. Conclusions
In summary, a natural biopolymer system based on Mn2+-chelating ultrasmall water-soluble melanin nanoparticles were developed as a T1 MRI contrast agent for tumor-targeted imaging. The melanin nanoparticles exhibited excellent biosafety due to being abundantly present in many organisms. Furthermore, MNP-PEG-Mn had a much higher relaxivity than that of commercial Gadodiamide. More attractively, the results of in vivo MRI displayed good tumor-targeting specificity, and the nanoparticles could be very efficiently eliminated by both the renal and hepatobiliary pathways, avoiding long-term accumulation. Therefore MNP-PEG-Mn showed great translation potential as an MRI contrast agent for tumor diagnosis.Conflicts of interest
The authors declare no competing financial interest.Acknowledgements
This work has been financially supported by the National Natural Science Foundation of China (Grant No. 51372260, 51132009, 51402338, 81471730 and 81571747), the Shanghai Excellent Academic Leaders Program (Grant No. 16XD1404000), Overseas students science and technology Projects, Shanxi Scholarship Council of China (No. 2015057) and the Key research and development project of Shanxi Province (No. 2016021).Notes and references
- Y. Li, Y. Huang, Z. Wang, F. Carniato, Y. Xie, J. Patterson, M. P. Thompson, C. M. Andolina, T. B. Ditri, J. E. Millstone, J. S. Figueroa, J. D. Rinehart, M. Scadeng, M. Botta and N. C. Gianneschi, Small, 2016, 12, 668–677 CrossRef CAS PubMed.
- R. Chen, D. Ling, L. Zhao, S. Wang, Y. Liu, R. Bai, S. Baik, Y. Zhao, C. Chen and T. Hyeon, ACS Nano, 2015, 9, 12425–12435 CrossRef CAS PubMed.
- C. Huang, K. Nwe, A. A. Zaki, M. W. Brechbiel and A. Tsourkas, ACS Nano, 2012, 6, 9416–9424 CrossRef CAS PubMed.
- D. V. Hingorani, A. S. Bernstein and M. D. Pagel, Contrast Media Mol. Imaging, 2015, 10, 245–265 CrossRef CAS PubMed.
- C. Yin, B. Hong, Z. Gong, H. Zhao, W. Hu, X. Lu, J. Li, X. Li, Z. Yang, Q. Fan, Y. Yao and W. Huang, Nanoscale, 2015, 7, 8907–8919 RSC.
- J. Y. Park, M. J. Baek, E. S. Choi, S. Woo, J. H. Kim, T. J. Kim, J. C. Jung, K. S. Chae, Y. M. Chang and G. H. Lee, ACS Nano, 2009, 3, 3663–3669 CrossRef CAS PubMed.
- C. Guo, L. Sun, W. She, N. Li, L. Jiang, K. Luo, Q. Gong and Z. Gu, Polym. Chem., 2016, 7, 2531–2541 RSC.
- Y. Cao, M. Liu, K. Zhang, G. Zu, Y. Kuang, X. Tong, D. Xiong and R. Pei, Biomacromolecules, 2017, 18, 150–158 CrossRef CAS PubMed.
- P. Marckmann, L. Skov, K. Rossen, A. Dupont, M. B. Damholt, J. G. Heaf and H. S. Thomsen, J. Am. Soc. Nephrol., 2006, 17, 2359–2362 CrossRef PubMed.
- K. M. Hasebroock and N. J. Serkova, Expert Opin. Drug Metab. Toxicol., 2009, 5, 403–416 CrossRef CAS PubMed.
- T. Kanda, T. Fukusato, M. Matsuda, K. Toyoda, H. Oba, J. Kotoku, T. Haruyama, K. Kitajima and S. Furui, Radiology, 2015, 276, 228–232 CrossRef PubMed.
- E. M. Gale, I. P. Atanasova, F. Blasi, I. Ay and P. A. Caravan, J. Am. Chem. Soc., 2015, 137, 15548–15557 CrossRef CAS PubMed.
- T. Kim, E. J. Cho, Y. Chae, M. Kim, A. Oh, J. Jin, E. S. Lee, H. Baik, S. Haam, J. S. Suh, Y. M. Huh and K. Lee, Angew. Chem., Int. Ed., 2011, 50, 10589–10593 CrossRef CAS PubMed.
- E. M. Gale, C. M. Jones, I. Ramsay, C. T. Farrar and P. Caravan, J. Am. Chem. Soc., 2016, 138, 15861–15864 CrossRef CAS PubMed.
- G. Porcheron, A. Garenaux, J. Proulx, M. Sabri and C. M. Dozois, Front. Cell. Infect. Microbiol., 2013, 3, 1–24 Search PubMed.
- Q. Zhang, J. D. Gorden, R. J. Beyers and C. R. Goldsmith, Inorg. Chem., 2011, 50, 9365–9373 CrossRef CAS PubMed.
- M. K. Islam, S. Kim, H.-K. Kim, S. Park, G.-H. Lee, H. J. Kang, J.-C. Jung, J.-S. Park, T.-J. Kim and Y. Chang, J. Med. Chem., 2017, 60, 2993–3001 CrossRef CAS PubMed.
- M. Park, N. Lee, S. H. Choi, K. An, S.-H. Yu, J. H. Kim, S.-H. Kwon, D. Kim, H. Kim, S. Baek, T.-Y. Ahn, O. K. Park, J. S. Son, Y.-E. Sung, Y.-W. Kim, Z. W. Wang, N. Pinna and T. Hyeon, Chem. Mater., 2011, 23, 3318–3324 CrossRef CAS.
- Z. Zhao, H. Fan, G. Zhou, H. Bai, H. Liang, R. Wang, X. Zhang and W. Tan, J. Am. Chem. Soc., 2014, 136, 11220–11223 CrossRef CAS PubMed.
- T. Kim, E. Momin, J. Choi, K. Yuan, H. Zaidi, J. Kim, M. Park, N. Lee, M. T. McMahon, A. Q. Hinojosa, J. W. M. Bulte, T. Hyeon and A. A. Gilad, J. Am. Chem. Soc., 2011, 133, 2955–2961 CrossRef CAS PubMed.
- M. F. Bennewitz, T. L. Lobo, M. K. Nkansah, G. Ulas, G. W. Brudvig and E. M. Shapiro, ACS Nano, 2011, 5, 3438–3446 CrossRef CAS PubMed.
- H. B. Na, J. H. Lee, K. An, Y. I. Park, M. Park, I. S. Lee, D. H. Nam, S. T. Kim, S. H. Kim and S. W. Kim, Angew. Chem., Int. Ed., 2007, 46, 5397–5401 CrossRef CAS PubMed.
- M. Zhang, L. Xing, H. Ke, Y. He, P. Cui, Y. Zhu, G. Jiang, J. Qiao, N. Lu, H. Chen and H. Jiang, ACS Appl. Mater. Interfaces, 2017, 9, 11337–11344 CAS.
- A. K. A. Silva, J. Kolosnjaj-Tabi, S. Bonneau, I. Marangon, N. Boggetto, K. Aubertin, O. Clément, M. F. Bureau, N. Luciani, F. Gazeau and C. Wilhelm, ACS Nano, 2013, 7, 4954–4966 CrossRef CAS PubMed.
- D. J. Huard, K. M. Kane and F. A. Tezcan, Nat. Chem. Biol., 2013, 9, 169–176 CrossRef CAS PubMed.
- K.-Y. Ju, J. W. Lee, G. H. Im, S. Lee, J. Pyo, S. B. Park, J. H. Lee and J.-K. Lee, Biomacromolecules, 2013, 14, 3491–3497 CrossRef CAS PubMed.
- Q. Fan, K. Cheng, X. Hu, X. Ma, R. Zhang, M. Yang, X. Lu, L. Xing, W. Huang, S. S. Gambhir and Z. Cheng, J. Am. Chem. Soc., 2014, 136, 15185–15194 CrossRef CAS PubMed.
- R. Zhang, Q. Fan, M. Yang, K. Cheng, X. Lu, L. Zhang, W. Huang and Z. Cheng, Adv. Mater., 2015, 27, 5063–5069 CrossRef CAS PubMed.
- M. Yang, Q. Fan, R. Zhang, K. Cheng, J. Yan, D. Pan, X. Ma, A. Lu and Z. Cheng, Biomaterials, 2015, 69, 30–37 CrossRef CAS PubMed.
- J. Sherwood, K. Lovas, M. Rich, Q. Yin, K. Lackey, M. S. Bolding and Y. Bao, Nanoscale, 2016, 8, 17506–17515 RSC.
- S. Zhang, Z. Chu, C. Yin, C. Zhang, G. Lin and Q. Li, J. Am. Chem. Soc., 2013, 135, 5709–5716 CrossRef CAS PubMed.
- M. Longmire, P. L. Choyke and H. Kobayashi, Nanomedicine, 2008, 3, 703–717 CrossRef CAS PubMed.
- P. M. Leal, S. Rivera-Fernandez, J. M. Franco, D. Pozo, J. M. De la Fuente and M. L. Garcia-Martin, Nanoscale, 2015, 7, 2050–2059 RSC.
- X. Zheng, J. Zhang, J. Wang, X. Qi, J. M. Rosenholm and K. Cai, J. Phys. Chem. C, 2015, 119, 24512–24521 CAS.
- K. S. Kim, W. Park, J. Hu, Y. H. Bae and K. A. Na, Biomaterials, 2014, 35, 337–343 CrossRef CAS PubMed.
- X. Zhang, Z. Luo, J. Chen, S. Song, X. Yuan, X. Shen, H. Wang, Y. Sun, K. Gao, L. Zhang, S. Fan, D. Leong, M. Guo and J. Xie, Sci. Rep., 2015, 5, 8669 CrossRef CAS PubMed.
Footnotes |
| † Electronic supplementary information (ESI) available: FT-IR spectra of MNP, MNP-PEG and NH2-PEG5000-NH2 (Fig. S1). TEM image and hydrodynamic size distribution graph of MNP-PEG (Fig. S2). The hydrodynamic size distribution of MNP-PEG-Mn in intensity and volume modes (Fig. S3). The hydrodynamic size distribution of MNP-PEG-Mn during different incubation periods with serum (Fig. S4). Cell viabilities of the NIH 3T3 cells after 24 h incubation with MNP-PEG-Mn at various concentrations determined by MTT assay (Fig. S5). See DOI: 10.1039/c7bm00635g |
| ‡ These authors contributed equally to this work. |
| This journal is © The Royal Society of Chemistry 2018 |

