Pyrazinamide-induced hepatotoxicity and gender differences in rats as revealed by a 1H NMR based metabolomics approach†
He
Zhao
a,
Zhi-Hong
Si
b,
Ming-Hui
Li
a,
Lei
Jiang
a,
Yong-Hong
Fu
a,
Yue-Xiao
Xing
a,
Wei
Hong
a,
Ling-Yu
Ruan
a,
Pu-Ming
Li
a and
Jun-Song
Wang
*a
aCenter for Molecular Metabolism, School of Environmental and Biological Engineering, Nanjing University of Science and Technology, 200 Xiao Ling Wei Street, Nanjing 210094, PR China. E-mail: wang.junsong@gmail.com; Fax: +86 25 84303216; Tel: +86 25 84303216
bCancer Hospital, Chinese Academy of Sciences, 350 Shu Shan Hu Road, Hefei 230031, PR China
First published on 5th October 2016
Abstract
Pyrazinamide (PZA) is a well-known first line anti-tuberculosis drug used in combination with other drugs such as isoniazid and rifampicin. Unfortunately, PZA suffered from a high rate of hepatotoxicity and hyperuricemia, which has not been clearly elucidated, hindering its wide application for therapeutic purposes. The purpose of this investigation was to develop a model of rat sub-acute hepatotoxicity induced by PZA and to explore the affected metabolic pathways by a 1H NMR-based metabolomics approach complemented with histopathological analysis and clinical chemistry. Rats of both genders were administered with PZA by gavage at doses of 1.0 and 2.0 g kg−1 for 4 weeks. PZA decreased the weights of dosed rats and induced liver injury dose-dependently. The female rats were more sensitive to PZA induced damage. Orthogonal signal correction partial least-squares discriminant analysis (OSC-PLS-DA) of the NMR profiles of the rat liver and serum revealed that PZA produced a status of oxidative stress and disturbances in purine metabolism, energy metabolism and NAD+ metabolism in a gender-specific and dose-dependent manner. These findings could be helpful to clarify the mechanism of PZA-induced hepatotoxicity and hyperuricemia. This integrated metabolomics approach showcased its ability to characterize the global metabolic status of organisms, providing a powerful and feasible tool to probe drug induced toxicity or side effects.
1. Introduction
Tuberculosis (TB), one of the most notorious infectious diseases, continues to be a major menace to the world population. A total of 9.4 million new cases, 14 million prevalent cases, and 1.3 million deaths were reported worldwide according to the estimation on the global burden of TB in 2009 published by the World Health Organization (WHO). Most cases were found in African, South-East Asian, and Western Pacific regions, where many people live in overcrowded slums, with significant obstacles in accessing health infrastructure and service.1,2Recommended standard treatment for adult pulmonary TB is a regimen of isoniazid, rifampicin, and pyrazinamide for 2 months, followed by 4 months of isoniazid (INH) and rifampicin (RIF) 3 times a week.3 Unfortunately, all these three recommended front line anti-TB drugs can bring about quite serious adverse events (SAEs) such as hepatotoxicity, skin reactions, and gastrointestinal and neurological disorders,4 among which the most frequent and serious is drug-induced hepatotoxicity. Drug-induced hepatotoxicity has become the nightmare of many pharmaceutical companies, regulatory agencies, and healthcare professionals and institutions, leading to obstacles in drug development, restrictions of use, and post-market withdrawals of approved drugs.5
Among the three first line anti-tuberculosis (anti-TB) drugs, pyrazinamide (PZA) was documented with more severe hepatotoxicity than isoniazid and rifampicin.6,7 Patients taking PZA were reported with radical asymptomatic serum aminotransferase elevation,8,9 which if not detected in time would lead to severe hepatotoxicity in patients, and even to death.8 It was also reported that PZA-induced hepatotoxicity is sexually dimorphic, more frequent and severe in women than in men.10,11 PZA catalyzed by amidase and xanthine oxidase in vivo produces its metabolites, e.g. pyrazinoic acid and 5-hydroxy-pyrazinamide, which are more toxic than PZA.12 Therefore, one strategy to attenuate the hepatotoxicity of PZA was to inhibit the involved enzymes. A recent investigation using oligonucleotide microarrays revealed that oral administration of PZA to rats affected the expression of 839 genes in diverse cellular pathways, concerning oxidative stress, peroxisome proliferator-activated receptor (PPAR) signaling, drug metabolism, and apoptosis.9 In spite of these valuable information on PZA-induced hepatotoxicity, the mechanism of PZA induced hepatotoxicity is still not well defined, especially from the metabolic viewpoint.
Metabolomics is one of the indispensible components of systems biology. Compared with genomics, transcriptomics and proteomics, metabolomics deals with the detection, identification and quantitative analysis of low-molecular-weight metabolites in tissues or body fluids,13,14 comprehensively profiling the endogenous metabolic status of organisms in response to pathological or toxicological events. 1H NMR-based metabolomics, as a non-biased, non-destructive, and high throughput “omics” analytical technology, has been successfully applied in toxicity screening, disease diagnosis, drug safety evaluation and mechanism study, and in many other fields.15,16 In this study, the sub-acute toxicity of PZA was performed by a consecutive 28 days oral administration of PZA to male and female Wistar rats. Serum and liver tissues were collected for clinical assays, histopathological inspection and 1H NMR-based metabolomics approach. Orthogonal signal correction-partial least squares-discriminant analysis (OSC-PLS-DA) disclosed many metabolite alterations, concerning oxidative stress, and disturbance in purine metabolism, energy metabolism, and NAD+ metabolism. To our best knowledge, this is the first report to elucidate the underlying toxic mechanism of PZA using 1H NMR based metabolomics.
2. Materials and methods
2.1 Chemicals and reagents
Pyrazinamide (CAS registry number 98-96-4, purity, at least 98%, PZA) was purchased from Shanghai Sangon Biotech (Shanghai, China). Kits for blood: aspartate aminotransferase (AST), alanine aminotransferase (ALT), and serum uric acid (SUA); for the liver extract: total proteins (TP), glutathione (GSH), oxidized glutathione (GSSG), xanthine oxidase (XOD) and glutathione S-transferase (GST) were purchased from Nanjing Jiancheng Bioengineering Institute (Nanjing, China). Deuterium oxide (D2O, 99.9%) and sodium 3-trimethylsilyl-1-[2,2,3,3-2H4] propionate (TSP) were purchased from Sigma Chemical Co. (St Louis, MO, USA). Ultrapure water (resistivity ≥18.25 MΩ cm) was used for all solution preparation. Acetonitrile was obtained from Guangdong Guanghua Sci-Tech Co. (Guangdong, China). All reagents were of analytical grade.2.2 Animals and drug administration
A total of 60 male and female 6-week-old SPF-level Wistar rats (200 ± 20 g) were obtained from Beijing Vital River (Beijing, China), a joint venture of Charles River Laboratories in China (Charles River Laboratories, Wilmington, Mass). All the animals were reared in stainless steel wire-mesh cages in a well-ventilated and climate-controlled room at a temperature of 25 ± 2 °C and a relative humidity of 50 ± 10%, with a 12 h light/12 h dark cycle. All the rats were given ad libitum access to pelleted rodent chow and tap water throughout the experiments. All procedures for animal care and use were in accordance with the National Institute of Health (NIH) guidelines for the Care and Use of Laboratory Animals, and the guidelines of the institutional Animal Care and Use Committee of Nanjing University of Science and Technology by which our animal experiments were approved.After 10 days of acclimatization, all the rats were randomly categorized into six groups: female control group (FCon), female low-dose group (FLD), female high-dose group (FHD), male control group (MCon), male low-dose group (MLD), and male high-dose group (MHD), each containing 10 rats. PZA was ground to powder for easy suspension in 0.5% solution of sodium carboxymethyl cellulose. The dosed groups were treated daily with 1.0 and 2.0 g kg−1 PZA in a volume of 10 ml per kg body weight by oral administration, for 28 consecutive days. The control group was treated with the vehicle of the same volume. The stock solutions of high-dose (250 mg ml−1) and low-dose (125 mg ml−1) were prepared everyday before administration. The low and high-dose exceeded the normal human dose (40 mg kg−1) by 4- and 8-fold, respectively,17,18 for efficient model-construction in comparatively short time in rats. After administration of PZA, the rats were observed for recording their behavioral changes.
2.3 Sample collection
All rats were fasted overnight the next day after the final administration of PZA and were sacrificed after anesthetization by chloral hydrate (350 mg kg−1, i.p.). Blood samples were collected in test tubes and allowed to stand for 1 h to clot, at room temperature, then the serum samples were obtained by centrifugation at 4 °C, 3000 rpm for 10 min, and stored at −80 °C. No obvious hemolysis was observed.The livers were quickly removed and rinsed with ice-cold saline, and divided into two parts, of which one was immersed in 10% neutral-buffered formalin for 24 h and embedded in paraffin wax for histopathological inspection. Serial sections of 4 μm thickness were cut from tissue blocks, stained with hematoxylin and eosin (H&E), and examined by light microscopy. All left livers were quickly frozen in liquid nitrogen and then stored at −80 °C before NMR analysis.
Frozen rat livers were weighed (500–600 mg) and homogenized in an ice cold solution of acetonitrile/water (1![[thin space (1/6-em)]](https://www.rsc.org/images/entities/char_2009.gif) :
:![[thin space (1/6-em)]](https://www.rsc.org/images/entities/char_2009.gif) 1, v/v, 6 ml g−1 liver), washed with ice-water, and then centrifuged at 12
1, v/v, 6 ml g−1 liver), washed with ice-water, and then centrifuged at 12![[thin space (1/6-em)]](https://www.rsc.org/images/entities/char_2009.gif) 000 rpm for 10 min at 4 °C. The upper layers were transferred into fresh tubes, and were lyophilized until dryness on a vacuum concentrator. Dried liver extracts were dissolved in 600 μL 99.8% D2O phosphate buffer (0.2 M Na2HPO4 and 0.2 M NaH2PO4, pH 7.0, containing 0.05% TSP). After vortex and centrifugation to remove any debris, the supernatant (about 550 μL) was then pipetted into a 5 mm NMR tube for 1H NMR analysis. D2O was used for field frequency locking and TSP was used as a chemical shift reference (1H, 0.00 ppm).
000 rpm for 10 min at 4 °C. The upper layers were transferred into fresh tubes, and were lyophilized until dryness on a vacuum concentrator. Dried liver extracts were dissolved in 600 μL 99.8% D2O phosphate buffer (0.2 M Na2HPO4 and 0.2 M NaH2PO4, pH 7.0, containing 0.05% TSP). After vortex and centrifugation to remove any debris, the supernatant (about 550 μL) was then pipetted into a 5 mm NMR tube for 1H NMR analysis. D2O was used for field frequency locking and TSP was used as a chemical shift reference (1H, 0.00 ppm).
2.4 Biochemical parameters
Serum AST, ALT, and SUA were analyzed using commercial kits according to the manufacturer's specifications in our own laboratory.The liver tissues were homogenized in ice-cold saline (0.2 g liver tissue in 1.8 ml of normal saline). The homogenates were centrifuged at 4 °C, 2500 rpm for 10 min, and the supernatants were transferred to fresh tubes and stored at −80 °C before use for biochemical assays. The total protein concentration, GSH and GSSG levels, and the activities of GST and XOD were measured using commercial kits according to the manufacturer's specification in our own laboratory.
2.5 1H NMR spectroscopy
All the 1H NMR spectra of liver and serum samples were acquired at 298 K on a Bruker Avance 500 MHz flow-injection spectrometer (Bruker GmbH, Karlsruhe, Germany) with a Bruker 5 mm probe, using a modified transverse relaxation-edited Call-Purcell-Meiboom-Gill (CPMG) sequence (90(τ–180 − τ) n-acquisition) with a total spin-echo delay (2nτ) of 10 ms to suppress the signals of proteins, with 128 transients collected into 32![[thin space (1/6-em)]](https://www.rsc.org/images/entities/char_2009.gif) 768 (32 K) data points, a spectral width of 10
768 (32 K) data points, a spectral width of 10![[thin space (1/6-em)]](https://www.rsc.org/images/entities/char_2009.gif) 000 Hz, an acquisition time of 3.27 s. The spectra were Fourier transformed after multiplying the FIDs by an exponential weighting function corresponding to a line-broadening of 0.5 Hz.
000 Hz, an acquisition time of 3.27 s. The spectra were Fourier transformed after multiplying the FIDs by an exponential weighting function corresponding to a line-broadening of 0.5 Hz.
2.6 NMR data pre-processing and peak assignments
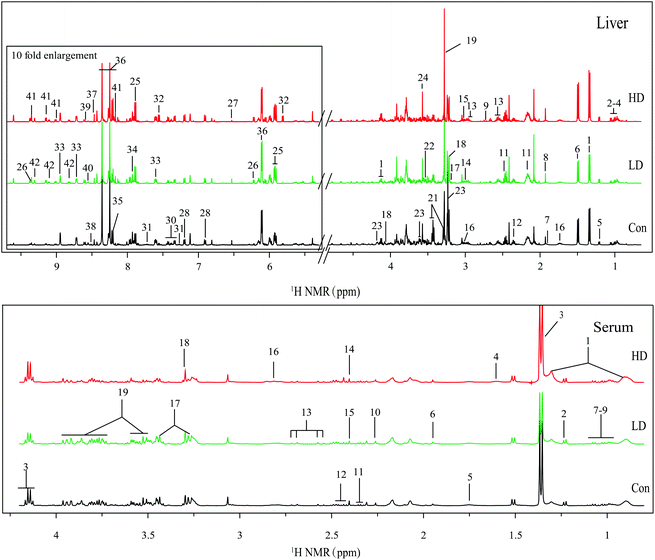
All the NMR spectra were manually adjusted for phase and baseline using Topspin 3.0 software (Bruker GmbH, Karlsruhe, Germany) and referenced to TSP (CH3, 0.00). The 1H NMR spectra were exported to ASCII files using Mestre C (3.7.4, Mestrelab Research SL), which were then imported into “R” (http://cran.r-project.org/), and peak aligned with an in-house developed R-script. With the removal of signals of water and its affected neighboring regions (4.83–5.30 ppm, liver extracts), the data were binned using an adaptive binning approach, with an average bin width of 0.015 ppm. All binned spectra over the ranges of 0.00–4.83 and 5.30–9.70 ppm for the liver, and 0.00–4.20 for serum were mean-centered and the integral values of each spectrum were probability quotient normalized to offset the sample concentration differences.The resonances of metabolites were assigned by querying publicly accessible metabolomics databases such as Human Metabolome Database (HMDB, http://www.hmdb.ca), Madison-Qingdao Metabolomics Consortium Database (MMCD, http://mmcd.nmrfam.wisc.edu), and Kyoto Encyclopedia of Genes and Genomes (KEGG), aided by Chenomx NMR suite 8.1 (Chenomx Inc., Edmonton, Canada). Peak overlapping of different metabolites hampered the accurate assignments of NMR signals and integration of peaks, thus the assignments and integrations of peaks were assisted by two-dimensional NMR experiments such as 1H–13C heteronuclear single quantum correlation (HSQC) spectroscopy, 1H–1H total correlation spectroscopy (TOCSY) (Fig. S6 and S7†) and two-dimensional statistical total correlation spectroscopy (STOCSY), which was executed by a suite of in-house developed scripts running in “R”.
Two dimensional STOCSY was used to identify the correlations between spectral resonances of interest to assist metabolite assignments.16 As known, different resonances belonging to the same molecules were highly correlated, which could help the assignments of metabolites. For example, the strong correlations of δ 2.10 (m) with δ 2.34 (m), and δ 2.15 (m) with δ 2.46 (m) allowed the assignments of glutamate and glutamine, respectively; the strong correlations of δ 3.28 (t) with δ 3.44 (t), and δ 8.25 (s) with δ 8.36 (s) allowed the assignments of taurine and inosine, respectively; the marked correlations among the signals at δ 9.35 (s) with δ 9.15 (d), and δ 9.31 (s) with δ 9.11 (d) allowed the assignments of NAD+ and NADP+, respectively (Fig. S3†).
Metabolic pathway analysis (MetPA) was performed by Metaboanalyst (http://www.metaboanalyst.ca) to help reveal disturbed metabolism.
2.7 Data statistical analysis
Multivariate statistical analysis, PCA and orthogonal signal correction-partial least square discriminate analysis (OSC-PLS-DA) were executed by in-house developed scripts running in “R” software (http://cran.r-project.org/). OSC-PLS-DA was performed to reveal the differential metabolic alterations in the livers and serum. The orthogonal signal correction (OSC) filter was applied to remove uninterested variations such as systematic variations or noise from the spectral data prior to PLS-DA.Each OSC-PLS-DA model was validated and assessed by a repeated 2-fold cross-validation (2CV). The validity of models against overfitting was evaluated by the parameter R2Y, and the parameter Q2Y reflected the predictability of the model. High Q2Y values indicated the significant difference between groups. However, the overfitting cannot always be evaluated by cross-validation, which could be further assessed by a 2000 times permutation test. Permutation testing is based on the comparison of the predictive capabilities of a model using real class assignments to a plenty of models calculated after random permutation of the class labels. The observed statistical p-values (p < 0.05) via permutation testing confirmed the significance of the OSC-PLS-DA model at a 95% confidence level. The performance measures were plotted on a histogram for visual assessment.
The color-coded loading plots were used to identify significantly altered metabolites. In the loading plots, the signals for metabolites with the warm color had more contribution to the class differentiation than those with the cool color.
The fold change values of selected metabolites in the livers and serum were calculated by the ratio of the integral area of metabolites, and the associated p-values were calculated and corrected by the Benjamini–Hochberg method19 for controlling the false positive rate in multiple comparisons using scripts written in R language (http://stat.ethz.ch/R-manual/R-devel/library/stats/html/p.adjust.html).
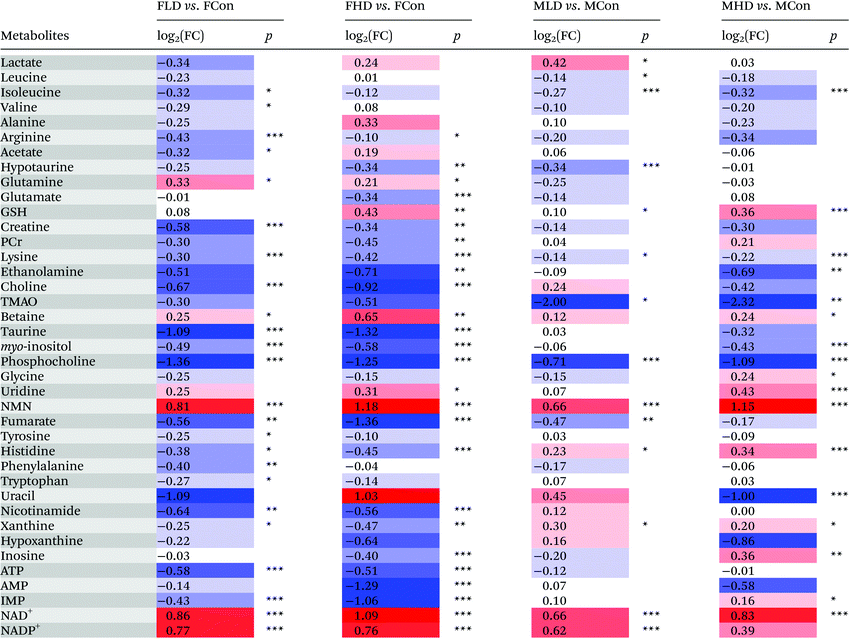
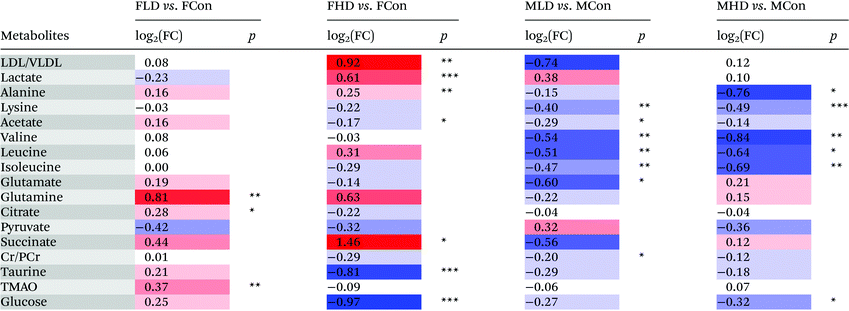
Parametric (Student's t test) or nonparametric (Mann–Whitney test) tests were performed to validate statistically significant metabolites that are increased or decreased between groups. p < 0.05 was considered statistically significant. Data were expressed in mean ± standard deviation (SD) and are summarized in Tables 1 and 2.
a Color coded according to the logarithmic transformation of fold change (FC), log2(FC), red represents the increased and blue the decreased in PZA treated groups. Color bar  .b P-values corrected by Benjamini–Hochberg methods were calculated based on a parametric Student's t-test or a nonparametric Mann–Whitney test. *p < 0.05, **p < 0.01, ***p < 0.001. .b P-values corrected by Benjamini–Hochberg methods were calculated based on a parametric Student's t-test or a nonparametric Mann–Whitney test. *p < 0.05, **p < 0.01, ***p < 0.001. |
|---|
|
a Color coded according to the logarithmic transformation of fold change (FC), log2(FC), red represents the increased and blue the decreased in PZA treated groups. Metabolite color bar  .
b
P-values corrected by Benjamini–Hochberg methods were calculated based on a parametric Student's t-test or a nonparametric Mann–Whitney test. *p < 0.05, **p < 0.01, ***p < 0.001. .
b
P-values corrected by Benjamini–Hochberg methods were calculated based on a parametric Student's t-test or a nonparametric Mann–Whitney test. *p < 0.05, **p < 0.01, ***p < 0.001. |
|---|
|
3. Results
3.1 Effect of pyrazinamide on clinical chemistry
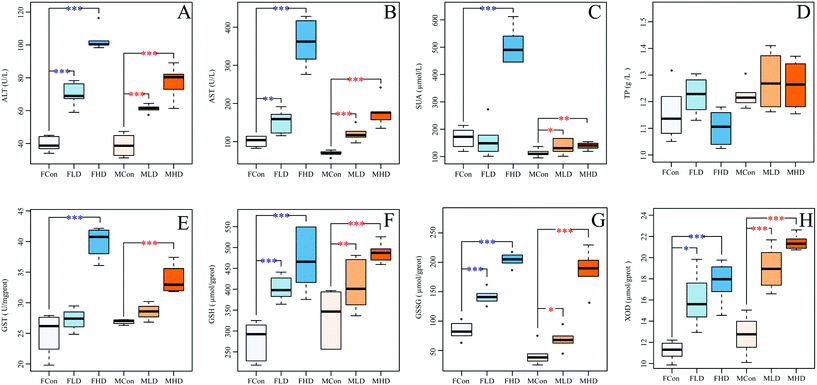
Pyrazinamide significantly increased the serum activities of ALT and AST dose-dependently in both genders, indicative of PZA liver damage (Fig. 1A and B). The level of serum UA was significantly elevated in the FHD group (Fig. 1C). UA is the end metabolic product of purine nucleotides and is mainly distributed in the livers and kidneys. A high blood concentration of uric acid could induce hyperuricemia, leading to arthritis and gout. The significant increase of UA thus suggested that a high dose of pyrazinamide might disturb the purine metabolism in the liver, which could be evidenced by significant elevated activity of hepatic XOD (Fig. 1H). As the marker for oxidative stress, the level of hepatic GSH and GSSG (markers for oxidative stress) and the activity of hepatic GST were increased in a dose-dependent manner in both genders, more significantly in female (Fig. 1E–G), suggesting the occurrence of oxidative stress. A slight decrease of TP was observed in the FHD group (Fig. 1D).3.2 Effects of pyrazinamide on clinical sign and histopathology
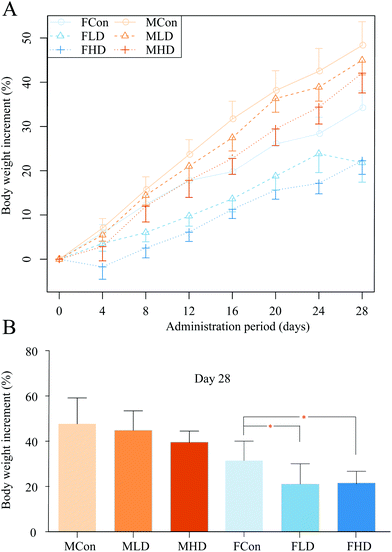
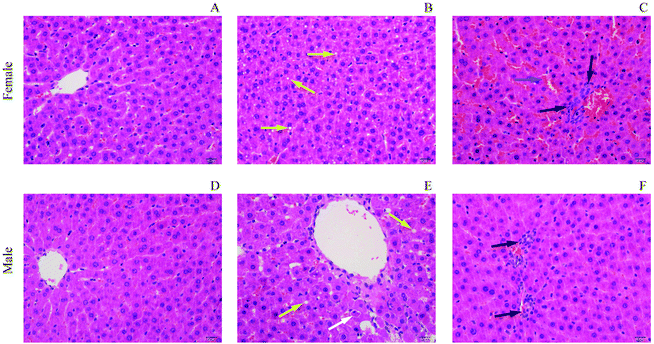
During the whole process of the experiments, all rats were carefully monitored for their clinical signs. Male rats dosed with PZA showed no obvious abnormal change, but female rats exhibited bradykinesia, and obvious weakness within 30 min of dosing, and dose-dependently decreased body weight compared to control rats (Fig. 2A and B) during the 28-days experiment in both genders: severer in female (Fig. 2C and D) than in male rats. All rats of both genders survived to the end of our research.The livers were H&E stained for histopathological inspection under a microscope. No apparent changes were observed in control rats of both genders (Fig. 3A and D). In the FLD group (Fig. 3B), slight hepatic vacuolar degeneration evidenced by some small circular vacuoles in the cytoplasm was found. However, in the FHD group (Fig. 3C), pathological changes were evidenced by apparent sinusoidal congestion, and slight inflammatory cell infiltration. The MLD group (Fig. 3E) exhibited slight hepatic vacuolar degeneration and apoptotic bodies. In the MHD group (Fig. 3F), PZA induced slight inflammatory cell infiltration.
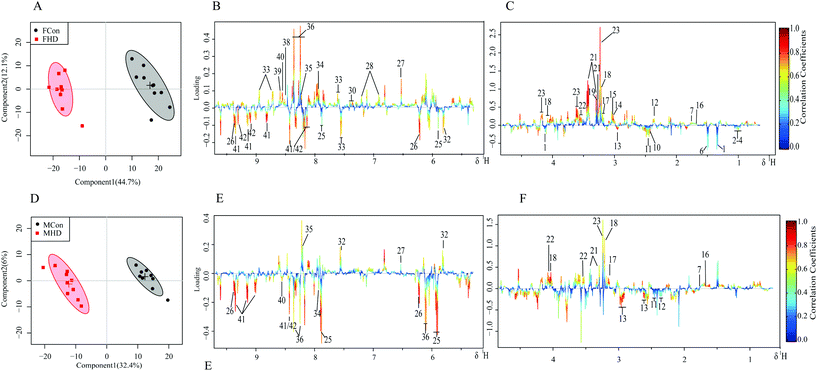
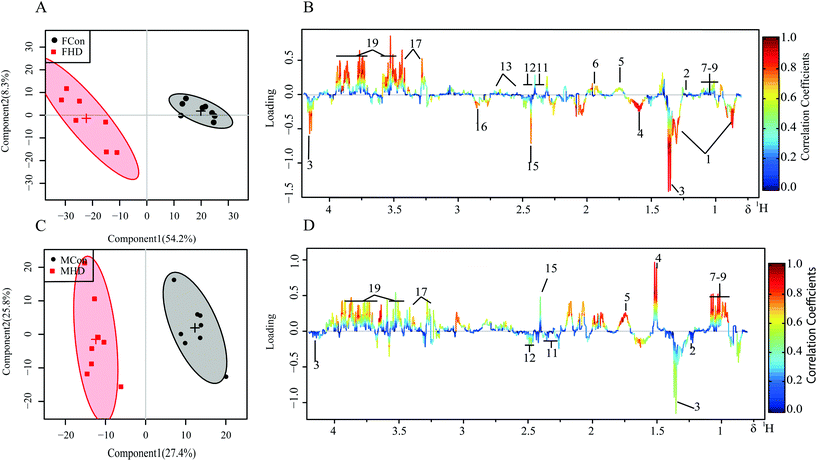
3.3 Multivariate statistical analysis of 1H NMR spectra
PCA and the supervised OSC-PLS-DA were performed on the binned 1H NMR metabolomics data to acquire an overview of variations among the groups. PCA explains maximum variation between samples, whereas PLS-DA explains maximum separation between defined class samples in the data (X); for this reason, the class membership of each sample must be known. Devoid of class information, PCA is less powerful in capturing variables contributing to grouping than supervised pattern recognition methods. Indeed, only slight separation of PZA treated groups from the control group in both genders was achieved in the PCA scores plots of both the liver and serum. OSC-PLS-DA, with the strong power to detect important contributing variables from irrelevant noise, was chosen as the primary multivariate statistical analysis method. In the scores plots for the livers of female rats, the two dosed groups were well separated from the control group (Fig. S1A†); however, in the scores plots for the livers of male rats, only the high-dose group exhibited marked separation from the control group (Fig. S1D†). Similar patterns were found in serum scores plots (Fig. S2A and C†). The good separation achieved between the high-dose group and the control group and, instead, by the overlapping between low-dose and control groups, revealing a dose-dependent manner of PZA induced metabolic changes, suggested that the effects caused by PZA are dose-dependent, and are more severe in the female group. As a result, thereafter, we primarily used high-dose versus control groups to acquire more information and carry out discussions.To investigate the distinct impact of PZA on the metabolic profiles of the livers and serum, the liver and serum NMR data of high-dose groups of each sex were subjected to OSC-PLS-DA. The scores plots for the liver and serum showed clear clustering of two groups with satisfactory goodness of fit and good predictability of the model (R2Y = 0.97, Q2Y = 0.92; R2Y = 0.96, Q2Y = 0.92 for the livers of male and female, respectively; R2Y = 0.88, Q2Y = 0.75; R2Y = 0.93, Q2Y = 0.31 for serum of male and female, respectively; Fig. S4†) and statistical significance (p = 0.001, p = 0.001 for the livers of male and female, respectively; p < 5 × 10⁻⁴, p = 0.001 for serum of male and female, respectively; Fig. S5†).
The metabolic alterations were directly visualized by the loading plot color coded according to the correlation coefficient (r2) and visualized in a covariance-based pseudo-spectrum, and the higher the significance of metabolites contributing to inter-class discrimination, the warmer the corresponding color.
3.4 Metabolite pathway analysis
The significantly altered metabolites selected based on OSC-PLS-DA loading plots and fold changes were subjected to MetPA (http://www.metaboanalyst.ca) for identifying the affected pathways resulting from PZA treatment. A hypergeometric test using over-representation analysis and pathway topology analysis of MetPA, indicated that nicotinate and nicotinamide metabolism, purine metabolism, taurine and typotaurine metabolism, glutathione metabolism, glycerophospholipid metabolism, and citrate cycle were disturbed in PZA dosed rats (Fig. 7).4. Discussion
In this investigation, histopathological inspection and clinical chemistry were applied to assess the toxicity of pyrazinamide after a consecutive 28 days oral PZA administration to Wistar rats of both genders. PZA significantly elevated the levels of serum ALT and AST, indicative of PZA induced liver damage. However, no significant histopathological alterations were found in the livers of PZA groups except slight sinusoidal congestion and inflammatory cell infiltration, which showed insensitivity to the toxic effect of traditional tissue inspection. 1H NMR-based metabolomics, with inherent advantages such as rapidity, high sensitivity and reproducibility, was adopted to explore biomarkers and the affected metabolic pathways after the administration of PZA. With the aid of multivariate statistical analysis, NMR profiling of PZA dosed and control groups caused oxidative stress, and revealed metabolic disturbance in purine metabolism, energy metabolism, and NAD+ metabolism.4.1 Purine metabolism
PZA could be metabolized into pyrazinoic acid that inhibited the renal tubular secretion of uric acid,20–22 producing a state of hyperuricaemia, the major adverse effect of PZA in clinic, featuring gout and arthralgia. Compared with the control rats, PZA dosed female rats were found with significant decreases of hepatic AMP, inosine, and xanthine, and increase of serum uric acid, indicative of the underlying cause of hyperuricaemia. These metabolites belong to the purine nucleotide metabolic pathway where AMP is firstly dephosphorylated to adenosine, and then deaminated to inosine by adenosine deaminase; inosine is subsequently hydrolyzed to hypoxanthine, and successively oxidized to xanthine; and finally, xanthine is converted to uric acid under the catalysis of XOD.XOD played an important role in the rate-limited conversion of xanthine to uric acid.23 The significant increase of serum uric acid and the corresponding decrease of hepatic xanthine in PZA dosed rats demonstrated an activated XOD, evidenced by obviously elevated activity of XOD in the liver (Fig. 1). As uric acid was mainly generated in the liver, alterations of uric acid related metabolites demonstrated severe metabolism disturbance induced by PZA. In addition, XOD was also involved in the rapid oxidation of PZA to its metabolites, pyrazinoic acid or 5-hydroxy-pyrazinamide in the liver,24,25 with stronger toxicity producing severe hepatotoxicity. In addition, pyrazinoic acid could inhibit the renal tubular secretion of uric acid, aggravating hyperuricaemia. The above metabolites were not significantly altered in PZA dosed male rat groups, showcasing the gender-specific response to PZA.
4.2 Oxidative stress
With the lipophilic nature, many anti-TB drugs are eliminated by conversion (such as oxidation and conjugation) into more hydrophilic derivatives, performed by hepatic phase 1 and phase 2 bioactivation enzymes such as cytochrome P450s. This biotransformation of xenobiotics occasionally produces toxic and reactive electrophilic metabolites, creating oxidative stresses in the livers or other organs.26 Oxidative stress was referred to as an imbalance between excessive generation of free radicals, such as reactive oxygen species (ROS), and organism antioxidant defense capacities. When intrinsic antioxidant defenses were overwhelmed by ROS and/or drug-derived radicals, tissue damage (i.e. hepatotoxicity) was caused.27,28 Anti-TB drugs, including isoniazid, rifampicin, and pyrazinamide, were reported to cause oxidative hepatic damage to organisms.9,29–32In PZA dosed male or female rats, hepatic GSH and GSSG were significantly increased, while glutamate and glycine were markedly decreased. In addition to being the most common and abundant natural antioxidant in organs, GSH also plays a crucial role in xenobiotic detoxification by its conjugation to xenobiotics via glutathione S-transferase (GST), therefore increasing the hydrophilicity of xenobiotics and facilitating their elimination.33 PZA stimulated and conspicuously enhanced the expression of five genes associated with hepatic GST (Gstm1, Gstm2, Gsta4, Gsta5, and Gstp1),9 which is consistent with our result that the activity of hepatic GST was significantly dose-dependently elevated in PZA dosed groups of both sexes. The liver is the primary organ of detoxification, and a significant increase of GSH in the tissue has been observed in lipopolysaccharide and cadmium-induced oxidative stress in mice so as to rebalance the redox status and reduce cell death caused by oxidative damage,34,35 therefore a significant increase of hepatic GSH and activity of GST suggested an adaptive mechanism to detoxicate and counteract oxidative damage caused by PZA.36 During these processes, a large amount of GSH was consumed. To sustain a certain level of GSH in cells, the synthesis of GSH from glutamate, cysteine, and glycine has to be enhanced since GSH does not enter the cell freely. In the FHD group, conspicuous decreases of glutamate and glycine could be suggestive of such an effort to replenish GSH consumption, which was not observed in PZA dosed male rats, indirectly reflecting a lower pressure of oxidative damage in male rats.
Cell membrane lipids, rich in poly-unsaturated fatty acids and phospholipids, are susceptible to oxidative damage, threatening the integrity and viability of cells. In the livers of PZA dosed rats, choline, phosphocholine, ethanolamine, and myo-inositol were significantly decreased. As the main components of phospholipids, they are essential for sustaining the integrity of the cell membrane.37 Their significant decreases were ascribed to their great consumption to repair the damaged cell membranes.
The hepatic levels of taurine and hypotaurine were significantly decreased in PZA-treated female rats. Taurine, abundant in many tissues, exhibits antioxidant and anti-apoptotic activities and has the abilities to regulate osmotic pressure, ion transport and DNA repair.23,32 Hypotaurine, the precursor of taurine, has the capacity to scavenge the hydroxyl radical OH˙ and restrain lipid peroxidation.38 It was reported that taurine and hypotaurine could attenuate oxidative stress.39–41 The significant dose-dependent decreases of taurine and hypotaurine in the livers of PZA dosed female rats reflected their consumptions to counteract PZA induced oxidative damage, which was less severe in the livers of male rats as evidenced by only a few insignificant alterations of taurine and hypotaurine.
In addition to membrane lipids, proteins are also targets for free radicals, which could change the three-dimensional structure of proteins and even lead to protein fragmentation.42,43 Serum levels of branched chain amino acids were decreased in PZA dosed rats. BCAAs are the essential amino acids that are absorbed in the intestine and transported in the bloodstream to the liver or other organs to synthesize body proteins. The reduced concentrations of BCAAs implied their increased utilizations to replenish and repair the damaged proteins, as indicated by no obvious decrease in PZA dosed groups.
PZA produced more severe DNA damage in rats than RIF and INH,44 which could be associated with the formation of hepatotoxic and genotoxic free radicals.45 Uridine, as the component of RNA, can be phosphorylated to nucleotides such as UTP and CTP, which are used for the synthesis of RNA and DNA.46,47 CTP can provide CDP-choline and CDP-ethanolamine for membrane biosynthesis.48,49 A significant increase of uridine was found in the livers of PZA dosed rats, reflecting a self-repair mechanism of the body to counteract PZA induced damage.
4.3 Energy metabolism
Hepatic fumarate and serum citrate, intermediates of the (tricarboxylic acid) TCA cycle, were significantly decreased in PZA dosed female rats, suggesting an inhibition of the TCA cycle following PZA treatment. Glycolysis is the first step in glucose metabolism where glucose can be degraded into two pyruvates. Pyruvate has two fates: undergoes catalysis by the pyruvate dehydrogenase complex to produce acetyl-CoA and then enters into the TCA cycle (aerobic respiration); or converts to lactate (anaerobic respiration). Pyruvate shows no significant change after PZA dosing, which together with the apparent elevations of lactate in serum of PZA dosed rats demonstrated a great pyruvate consumption to lactate, and further evidenced the inhibition of the TCA cycle. These results suggested the shift of the energy supply from aerobic respiration to anaerobic metabolism, which has been reported in cases of hepatotoxicity. Significantly increased serum lactate could be developed into hyperlactatemia symptomized with extreme fatigue and vomiting, which was also associated with the adverse effects of PZA.50–52Glycolysis and gluconeogenesis are usually enhanced in drug-induced hepatotoxicity where hepatic insufficiency often occurs.53 A significant increase of alanine (glucogenic amino acid) and decrease of glucose were observed in PZA dosed female rats, suggesting inhibited gluconeogenesis by PZA. In animals, gluconeogenesis takes place mainly in the liver, where pyruvate generated from alanine within mitochondria by transamination was firstly converted to oxaloacetate, which was then phosphorylated to phosphoenolpyruvate (PEP) under the catalysis of phosphoenolpyruvate carboxykinase (PEPCK, EC 4.1.1.32). On inhibition of picolinate carboxylase, PZA significantly enhanced the production of quinolinate, which could block the conversion of oxaloacetate to PEP by inhibiting PEPCK, and this is essential for the formation of PEP from pyruvate in hepatic gluconeogenesis.54–56
The inhibition of gluconeogenesis led to insufficient glucose supply for energy production. Even worse, glycolysis is not an efficient glucose utilization process to produce energy, producing a state of energy deficit, as evidenced by the obvious decrease of ATP in PZA dosed female rats. As a result, other means of energy supply have to come to rescue. We observed a significant decrease of creatine phosphate in the livers of PZA dosed female rats. Creatine phosphate functions as an energy conditioner in response to insufficient energy supply by donation of its phosphate group to ADP to supplement ATP need.57 In many tissues, especially those with high-energy demand, fatty acid β-oxidation (FAO) also plays a crucial role in ATP production: fatty acids were oxidized in mitochondria to produce energy. The significant increase of serum LDL/VLDL in PZA dosed female rats suggested an inhibited FAO by PZA,58 which could be ascribed in part to its down-regulation of hepatic CPT-1 mRNA,9 encoding enzyme carnitine palmitoyl transferase-1 that catalyzes the entry of long-chain fatty acids into the mitochondrial matrix for subsequent β-oxidation.
In conclusion, the alterations of energy related metabolites demonstrated severe energy metabolism disturbance induced by PZA, which was more serious in female, reflected gender-specific response to PZA.
4.4 NAD+ metabolism
Significantly elevated levels of NAD+, NADP+, and NMN, and a reduced level of NAM were observed in PZA dosed groups, more severe in female, implying that PZA disturbed the metabolism of NAD+. In mammals, NAD+ was either de novo synthesized from tryptophan or via a salvage pathway called “niacin pathway”, where NAM was converted to NMN by nicotinamide phosphoribosyltransferase (Nampt), and the latter was then converted to NAD+ under the catalysis of nicotinamide mononucleotide adenylyltransferase (Nmnat). Significantly decreased NAM and correspondingly increased NMN reflected that PZA and/or its metabolites could enhance the activity of Nampt. Nampt-mediated NAD+ biosynthesis influences cellular differentiation, stress resistance and metabolic responses in different cell types by raising intracellular NAD+ levels,59 and thereby regulating the activity of NAD+-consuming enzymes such as sirtuins, enhancing cellular resistance to damage and stress, and conferring the cells the ability to survive during stressful situations.60 Therefore, the altered NAD+ biosynthesis by PZA reflected a self-repair mechanism of the body to counteract PZA induced damage.5. Conclusion
Pyrazinamide-induced hepatotoxicity was firstly investigated by a 1H NMR-based metabolomics approach complemented with conventional histopathological inspection and clinical chemistry assays. Multivariate and univariate statistical analysis of NMR profiles revealed that pyrazinamide produced plenty of metabolite variations, concerning oxidative stress and disturbances in purine metabolism, energy metabolism and NAD+ metabolism with gender difference. Female rats were more susceptible to PZA-induced hepatotoxicity than males. These findings helped in the clarification and explanation of PZA-induced hepatotoxicity, and demonstrated the superiority of NMR based metabolomics to conventional methods in characterizing the holistic metabolic states of the entire organism to understand the complex pathology of diseases, the underlying mechanism of therapy, and the side effects of drugs.Conflicts of interest
There are no conflicts of interest to declare.Acknowledgements
This research work was financially supported by the National Natural Science Foundation of China (No. 81173526) and the Fundamental Research Funds for the Central Universities (No. 30916011307). The authors would like to thank Prof. Lan Yi for her excellent help with 1H NMR technical assistance.References
- A. Prasad, A. Ross, P. Rosenberg and C. Dye, A world of cities and the end of TB, Trans. R. Soc. Trop. Med. Hyg., 2016, 110, 151–152 CrossRef PubMed.
- W. H. Organization, Global tuberculosis control: WHO report 2010, World Health Organization, 2010 Search PubMed.
- D. Maher, P. Chaulet, S. Spinaci and A. Harries, Treatment of tuberculosis: guidelines for national programmes, in Treatment of tuberculosis: guidelines for national programmes, 2nd edn, 1997, pp. 1–77 Search PubMed.
- A. Tostmann, M. J. Boeree, R. E. Aarnoutse, W. De Lange, A. J. Van Der Ven and R. Dekhuijzen, Antituberculosis drug-induced hepatotoxicity: concise up-to-date review, J. Gastroenterol. Hepatol., 2008, 23, 192–202 CrossRef CAS PubMed.
- J. C. García-Cañaveras, N. Jiménez, M. J. Gómez-Lechón, J. V. Castell, M. T. Donato and A. Lahoz, LC-MS untargeted metabolomic analysis of drug-induced hepatotoxicity in HepG2 cells, Electrophoresis, 2015, 36, 2294–2302 CrossRef PubMed.
- K. C. Chang, C. C. Leung, W. W. Yew, T. Y. Lau and C. M. Tam, Hepatotoxicity of pyrazinamide: cohort and case-control analyses, Am. J. Respir. Crit. Care Med., 2008, 177, 1391–1396 CrossRef PubMed.
- H. Blumberg, W. Burman, R. Chaisson, C. Daley, S. Etkind, L. Friedman, P. Fujiwara, M. Grzemska, P. Hopewell and M. Iseman, American Thoracic Society/Centers for Disease Control and Prevention/Infectious Diseases Society of America: treatment of tuberculosis, Am. J. Respir. Crit. Care Med., 2003, 167, 603 CrossRef PubMed.
- P. D. McElroy, K. Ijaz, L. A. Lambert, J. A. Jereb, M. F. Iademarco, K. G. Castro and T. R. Navin, National survey to measure rates of liver injury, hospitalization, and death associated with rifampin and pyrazinamide for latent tuberculosis infection, Clin. Infect. Dis, 2005, 41, 1125–1133 CrossRef PubMed.
- Y. Zhang, Z. Jiang, Y. Su, M. Chen, F. Li, L. Liu, L. Sun, Y. Wang, S. Zhang and L. Zhang, Gene expression profiling reveals potential key pathways involved in pyrazinamide-mediated hepatotoxicity in Wistar rats, J. Appl. Toxicol., 2013, 33, 807–819 CrossRef CAS PubMed.
- A. M. Lee, J. Z. Mennone, R. C. Jones and W. S. Paul, Risk factors for hepatotoxicity associated with rifampin and pyrazinamide for the treatment of latent tuberculosis infection: experience from three public health tuberculosis clinics, Int. J. Tuberc. Lung Dis., 2002, 6, 995–1000 CAS.
- R. van Hest, H. Baars, S. Kik, P. van Gerven, M.-C. Trompenaars, N. Kalisvaart, S. Keizer, M. Borgdorff, M. Mensen and F. Cobelens, Hepatotoxicity of rifampin-pyrazinamide and isoniazid preventive therapy and tuberculosis treatment, Clin. Infect. Dis., 2004, 39, 488–496 CrossRef CAS PubMed.
- T. Y. Shih, C. Y. Pai, P. Yang, W. L. Chang, N. C. Wang and O. Y. Hu, A novel mechanism underlies the hepatotoxicity of pyrazinamide, Antimicrob. Agents Chemother., 2013, 57, 1685–1690 CrossRef CAS PubMed.
- M. Coen, E. M. Lenz, J. K. Nicholson, I. D. Wilson, F. Pognan and J. C. Lindon, An integrated metabonomic investigation of acetaminophen toxicity in the mouse using NMR spectroscopy, Chem. Res. Toxicol., 2003, 16, 295–303 CrossRef CAS PubMed.
- K. W. Jordan, J. Nordenstam, G. Y. Lauwers, D. A. Rothenberger, K. Alavi, M. Garwood and L. L. Cheng, Metabolomic characterization of human rectal adenocarcinoma with intact tissue magnetic resonance spectroscopy, Dis. Colon Rectum, 2009, 52, 520 CrossRef PubMed.
- J. L. Griffin, The potential of metabonomics in drug safety and toxicology, Drug Discovery Today: Technol., 2004, 1, 285–293 CrossRef CAS PubMed.
- Y.-H. Lou, J.-S. Wang, G. Dong, P.-P. Guo, D.-D. Wei, S.-S. Xie, M.-H. Yang and L.-Y. Kong, The acute hepatotoxicity of tacrine explained by 1 H NMR based metabolomic profiling, Toxicol. Res., 2015, 4, 1465–1478 RSC.
- V. Kovalenko, L. Bondarenko, T. Byshovetz, G. Shayakhmetova, A. Voronina, O. Voloshina and N. Saprykina, Pyrazinamide and disulfiram effects on male rat's reproductive function, Toxicol. Lett., 2006, 164, S303–S304 CrossRef.
- G. Shayakhmetova, L. Bondarenko, N. Saprykina and V. Kovalenko, Dose depending pyrazinamide effects on peroxidation processes and lipid contents in rats, Toxicol. Lett., 2006, 164, S72 CrossRef.
- Y. Benjamini and Y. Hochberg, Controlling the false discovery rate: a practical and powerful approach to multiple testing, J. R. Stat. Soc. Ser. B: Stat. Method., 1995, 289–300 Search PubMed.
- T. F. Yu, L. Berger, D. J. Stone, J. Wolf and A. B. Gutman, Effect of pyrazinamide and pyrazinoic acid on urate clearance and other discrete renal functions, Proc. Soc. Exp. Biol. Med., 1957, 96, 264–267 CrossRef CAS PubMed.
- I. M. Weiner and J. P. Tinker, Pharmacology of pyrazinamide: metabolic and renal function studies related to the mechanism of drug-induced urate retention, J. Pharmacol. Exp. Ther., 1972, 180, 411–434 CAS.
- C. Lacroix, C. Guyonnaud, M. Chaou, H. Duwoos and O. Lafont, Interaction between allopurinol and pyrazinamide, Eur. Respir. J., 1988, 1, 807–811 CAS.
- C. Jiao, Z. Jia, S. Wei, Z. Xie, C. Wen and G. Xu, Effect of a traditional Chinese medicine prescription Quzhuotongbi decoction on hyperuricemia model rats studied by using serum metabolomics based on gas chromatography-mass spectrometry, J. Chromatogr. B: Anal. Technol. Biomed. Life Sci., 2015, 1026, 272–278 Search PubMed.
- J.-W. Wu and T.-H. Tsai, Effect of silibinin on the pharmacokinetics of pyrazinamide and pyrazinoic acid in rats, Drug Metab. Dispos., 2007, 35, 1603–1610 CrossRef CAS PubMed.
- A. Tostmann, M. J. Boeree, W. H. Peters, H. M. Roelofs, R. E. Aarnoutse, A. J. van der Ven and P. N. Dekhuijzen, Isoniazid and its toxic metabolite hydrazine induce in vitro pyrazinamide toxicity, Int. J. Antimicrob. Agents, 2008, 31, 577–580 CrossRef CAS PubMed.
- F. J. Gonzalez, Role of cytochromes P450 in chemical toxicity and oxidative stress: studies with CYP2E1, Mutat. Res., Fundam. Mol. Mech. Mutagen., 2005, 569, 101–110 CrossRef CAS PubMed.
- A. Walubo, P. J. Smith and P. I. Folb, Oxidative stress during antituberculous therapy in young and elderly patients, Biomed. Environ. Sci., 1995, 8, 106–113 CAS.
- N. Ercal, H. Gurer-Orhan and N. Aykin-Burns, Toxic metals and oxidative stress part I: mechanisms involved in metal-induced oxidative damage, Curr. Top. Med. Chem., 2001, 1, 529–539 CrossRef CAS PubMed.
- S. Attri, S. Rana, K. Vaiphei, C. Sodhi, R. Katyal, R. Goel, C. Nain and K. Singh, Isoniazid–and rifampicin–induced oxidative hepatic injury–protection by N-acetylcysteine, Hum. Exp. Toxicol., 2000, 19, 517–522 CAS.
- C. Sodhi, S. Rana, S. Mehta, K. Vaiphei, S. Attari and S. Mehta, Study of oxidative-stress in isoniazid-rifampicin induced hepatic injury in young rats, Drug Chem. Toxicol., 1997, 20, 255–269 CrossRef CAS PubMed.
- A. Chowdhury, A. Santra, K. Bhattacharjee, S. Ghatak, D. R. Saha and G. K. Dhali, Mitochondrial oxidative stress and permeability transition in isoniazid and rifampicin induced liver injury in mice, J. Hepatol., 2006, 45, 117–126 CrossRef CAS PubMed.
- A. O. Kehinde and O. Adaramoye, Biochemical changes in blood and tissues of Wistar rats following administration of anti-tuberculosis drugs, Afr. J. Biochem. Res., 2015, 9, 67–72 CrossRef CAS.
- L. Gate, J. Paul, G. N. Ba, K. Tew and H. Tapiero, Oxidative stress induced in pathologies: the role of antioxidants, Biomed. Pharmacother., 1999, 53, 169–180 CrossRef CAS.
- P. Li, S. Liao, J. Wang, D. Xu, Q. Zhang, M. Yang and L. Kong, NMR metabolic profiling of lipopolysaccharide-induced mice sepsis and the treatment effects of berberine, RSC Adv., 2016, 6, 47474–47485 RSC.
- L. Liu, R. Tao, J. Huang, X. He, L. Qu, Y. Jin, S. Zhang and Z. Fu, Hepatic oxidative stress and inflammatory responses with cadmium exposure in male mice, Environ. Toxicol. Pharmacol., 2015, 39, 229–236 CrossRef CAS PubMed.
- V. Sivapiriya and S. Venkatraman, Effects of dimethoate (O, O-dimethyl S-methyl carbamoyl methyl phosphorodithioate) and ethanol in antioxidant status of liver and kidney of experimental mice, Pestic. Biochem. Physiol., 2006, 85, 115–121 CrossRef CAS.
- M. Yang, S. Wang, F. Hao, Y. Li, H. Tang and X. Shi, NMR analysis of the rat neurochemical changes induced by middle cerebral artery occlusion, Talanta, 2012, 88, 136–144 CrossRef CAS PubMed.
- B. Tadolini, G. Pintus, G. G. Pinna, F. Bennardini and F. Franconi, Effects of taurine and hypotaurine on lipid peroxidation, Biochem. Biophys. Res. Commun., 1995, 213, 820–826 CrossRef CAS PubMed.
- M. H. Li, J. S. Wang, Z. G. Lu, D. D. Wei, M. H. Yang and L. Y. Kong, NMR-based metabolomics approach to study the toxicity of lambda-cyhalothrin to goldfish (Carassius auratus), Aquat. Toxicol., 2014, 146, 82–92 CrossRef CAS PubMed.
- J. Das, J. Ghosh, P. Manna, M. Sinha and P. C. Sil, Taurine protects rat testes against NaAsO 2-induced oxidative stress and apoptosis via mitochondrial dependent and independent pathways, Toxicol. Lett., 2009, 187, 201–210 CrossRef CAS PubMed.
- P. Guerin, S. El Mouatassim and Y. Menezo, Oxidative stress and protection against reactive oxygen species in the pre-implantation embryo and its surroundings, Hum. Reprod. Update, 2001, 7, 175–189 CrossRef CAS PubMed.
- M. Li, J. Wang, Z. Lu, D. Wei, M. Yang and L. Kong, NMR-based metabolomics approach to study the toxicity of lambda-cyhalothrin to goldfish (Carassius auratus), Aquat. Toxicol., 2014, 146, 82–92 CrossRef CAS PubMed.
- C. L. Fattman, L.-Y. Chang, T. A. Termin, L. Petersen, J. J. Enghild and T. D. Oury, Enhanced bleomycin-induced pulmonary damage in mice lacking extracellular superoxide dismutase, Free Radicals Biol. Med., 2003, 35, 763–771 CrossRef CAS PubMed.
- K. Arslan, M. Kanbur, M. Karabacak, Z. S. Sarica, N. Tascioglu, K. M. Iscan, M. Dundar and A. Akcay, Genotoxic effects of some antituberculosis drugs and mixtures in rats, Drug Res., 2015, 65, 219–222 CAS.
- S. Nasu, K. Yamaguchi, S. Sakakibara, H. Imai and I. Ueda, The effect of pyrazines on the metabolism of tryptophan and nicotinamide adenine dinucleotide in the rat. Evidence of the formation of a potent inhibitor of aminocarboxy-muconate-semialdehyde decarboxylase from pyrazinamide, Biochim. Biophys. Acta, 1981, 677, 109–119 CrossRef CAS.
- A. Dobolyi, G. Juhász, Z. Kovács and J. Kardos, Uridine function in the central nervous system, Curr. Top. Med. Chem., 2011, 11, 1058–1067 CrossRef CAS PubMed.
- P. Kamphuis and R. Wurtman, Nutrition and Alzheimer's disease: pre-clinical concepts, Eur. J. Neurol., 2009, 16, 12–18 CrossRef PubMed.
- B. M. Ross, A. Moszczynska, J. K. Blusztajn, A. Sherwin, A. Lozano and S. J. Kish, Phospholipid biosynthetic enzymes in human brain, Lipids, 1997, 32, 351–358 CrossRef CAS PubMed.
- D. Genchev and P. Mandel, CTP synthetase activity in neonatal and adult rat brain, J. Neurochem., 1974, 22, 1027–1030 CrossRef CAS PubMed.
- Y. Gérard, L. Maulin, Y. Yazdanpanah, X. De La Tribonnière, C. Amiel, C.-A. Maurage, S. Robin, B. Sablonnière, C. Dhennain and Y. Mouton, Symptomatic hyperlactataemia: an emerging complication of antiretroviral therapy, AIDS, 2000, 14, 2723–2730 CrossRef.
- K. Brinkman, Management of hyperlactatemia: no need for routine lactate measurements, AIDS, 2001, 15, 795–797 CrossRef CAS PubMed.
- B. Knobel, G. Buyanowsky, M. Dan and L. Zaidel, Pyrazinamide-induced granulomatous hepatitis, J. Clin. Gastroenterol., 1997, 24, 264–266 CrossRef CAS PubMed.
- C. Lu, Y. Wang, Z. Sheng, G. Liu, Z. Fu, J. Zhao, J. Zhao, X. Yan, B. Zhu and S. Peng, NMR-based metabonomic analysis of the hepatotoxicity induced by combined exposure to PCBs and TCDD in rats, Toxicol. Appl. Pharmacol., 2010, 248, 178–184 CrossRef CAS PubMed.
- C. M. Veneziale, P. Walter, N. Kneer and H. A. Lardy, Influence of L-Tryptophan and Its Metabolites on Gluconeogenesis in the Isolated, Perfused Liver*, Biochemistry, 1967, 6, 2129–2138 CrossRef CAS PubMed.
- J. S. Cook and C. I. Pogson, Tryptophan and glucose metabolism in rat liver cells. The effects of DL-6-chlorotryptophan, 4-chloro-3-hydroxyanthranilate and pyrazinamide, Biochem. J., 1983, 214, 511–516 CrossRef CAS PubMed.
- S. Nasu, K. Yamaguchi, S. Sakakibara, H. Imai and I. Ueda, The effect of pyrazines on the metabolism of tryptophan and nicotinamide adenine dinucleotide in the rat Evidence of the formation of a potent inhibitor of aminocarboxy-muconate-semialdehyde decarboxylase from pyrazinamide, Biochim. Biophys. Acta, Gen. Subj., 1981, 677, 109–119 CrossRef CAS.
- P. Guo, J. Wang, G. Dong, D. Wei, M. Li, M. Yang and L. Kong, NMR-based metabolomics approach to study the chronic toxicity of crude ricin from castor bean kernels on rats, Mol. BioSyst., 2014, 10, 2426–2440 RSC.
- Q. Zhang, P. Guo, J. Wang, M. Yang and L. Kong, Gender-specific metabolic responses in focal cerebral ischemia of rats and Huang-Lian-Jie-Du decoction treatment, RSC Adv., 2015, 5, 95558–95575 RSC.
- A. Garten, S. Petzold, A. Körner, S.-I. Imai and W. Kiess, Nampt: linking NAD biology, metabolism and cancer, Trends Endocrinol. Metab., 2009, 20, 130–138 CrossRef CAS PubMed.
- A. Rongvaux, M. Galli, S. Denanglaire, F. Van Gool, P. L. Drèze, C. Szpirer, F. Bureau, F. Andris and O. Leo, Nicotinamide phosphoribosyl transferase/pre-B cell colony-enhancing factor/visfatin is required for lymphocyte development and cellular resistance to genotoxic stress, J. Immunol., 2008, 181, 4685–4695 CrossRef CAS.
Footnote |
| † Electronic supplementary information (ESI) available. See DOI: 10.1039/c6tx00245e |
| This journal is © The Royal Society of Chemistry 2017 |

