Metal organic framework-derived CoZn alloy/N-doped porous carbon nanocomposites: tunable surface area and electromagnetic wave absorption properties†
Wei
Feng
,
Yaming
Wang
 *,
Junchen
Chen
,
Baoqiang
Li
,
Lixin
Guo
,
Jiahu
Ouyang
,
Dechang
Jia
and
Yu
Zhou
Institute for Advanced Ceramics, Harbin Institute of Technology, Harbin 150001, P. R. China. E-mail: wangyaming@hit.edu.cn; Fax: +86-451-86414291; Tel: +86-451-86402040-8403
First published on 23rd October 2017
Abstract
N-Doped porous carbon with uniformly dispersed CoZn alloy nanoparticles has been synthesized through the pyrolysis of a bimetallic zeolitic imidazolate framework containing Zn and Co elements. The surface area, pore size distribution and graphitization of the composites can be modulated easily through changing the molar ratio of Zn to Co in the zeolitic imidazolate framework. Upon increasing the Zn content, the level of graphitization drops gradually and the surface area first increases and then decreases. The increased surface area results in the enhancement of dielectric loss and impedance matching. The sample with a Zn to Co molar ratio of 0.2 in its precursor has the most prominent electromagnetic wave absorption properties, due to appropriate surface area and graphitization properties. The minimum reflection loss reaches −59.7 dB and the widest bandwidth is up to 5.3 GHz. The composites can be good candidates for electromagnetic wave absorption and shielding applications, considering their outstanding performance and simple synthesis route. This study not only offers a simple and facile method for improving dielectric loss and impedance matching of carbon materials, but also sheds light on a new strategy for constructing porous structures, especially porous carbon.
1. Introduction
The wide application of electronic devices results in considerable electromagnetic (EM) interference, which produces negative effects on sensitive electronic equipment and the living environments of humans.1 EM wave absorbing materials can be a good alternative for shielding EM interference, through dissipating rather than reflecting EM waves, compared with conventional metallic materials.2,3 In past decades, carbon materials that are used as high-efficiency and lightweight electromagnetic wave absorbing materials have attracted much attention due to their low density, chemical stability and easy preparation.4–6 Various carbon materials, such as carbon nanotubes,6 mesoporous carbon7 and graphene,8 have been synthesized and investigated to fulfill the requirements for high-efficiency EM wave absorbers. However, limited EM wave absorption due to impedance mismatching in carbon materials restricts their further application.4–7Much effort has been made to improve the EM absorption properties of carbon materials. As is known, the EM wave absorption properties of an absorber depend on its dielectric loss, magnetic loss and impedance matching properties.9,10 It has been proven that combining magnetic materials with carbon materials is a good method for improving the impedance matching of carbon materials. Some ferrites, such as Fe3O4, Co3O4 and ZnFe2O4,11–13 and metal nanoparticles, such as Co and Fe nanoparticles,14,15 have been incorporated with carbon materials to enhance their EM wave absorbing properties. Among all the methods for the preparation of carbon/magnet composites, the most common one is decorating the prepared carbon materials with metal salts or oxides followed by further reduction treatment.16,17 Another is the pyrolysis of a mixture of organic polymers and metal salts or oxides.18,19 However, most strategies are complicated by tedious preparation procedures and are highly energy-consuming, with high pyrolysis temperatures.
Metal–organic frameworks (MOFs), which are a coordination of metal ions and organic ligands, have drawn great attention because of their high porosity, diverse structural topologies and versatility.20,21 Most fascinating is that the in situ pyrolysis of MOFs can be a good method for the preparation of carbon-based composites, which can retain the porosity and well-dispersed functional properties.22 MOF-derived carbon based composites have shown great potential in various application fields, such as energy storage and conversion,23,24 gas storage25 and catalysis.26 Recently, their application as EM wave absorbers has also been investigated in the literature because they provide a fast and facile approach for combining dielectric and magnetic materials. Qiang27et al. prepared Fe/C nanocubes derived from Prussian blue and studied their microwave absorption properties, which were dependent on the pyrolysis temperature. ZIF-67-derived Co/porous carbon nanocomposites and their electromagnetic wave absorption properties have also been investigated by Lü et al.28 Also, Yang et al.29 synthesized MOF-derived porous NiFe@C nanocube/graphene composites and optimized their microwave attenuation properties by varying the pyrolysis temperature.
This research has obtained good results, and has also revealed the relation between the pyrolysis temperature and EM properties of MOF-derived carbon-based composites. However, the direct effect of the porous structure inherited from MOFs on the EM wave absorption properties has rarely been investigated. This study constructs a CoZn alloy nanoparticle/N-doped porous carbon composite derived from zeolitic imidazolate frameworks (ZIFs) containing two metal elements, Zn and Co, and investigates the effects of its porous structure on the dielectric and magnetic properties. A carbon composite derived from a Zn-based ZIF can retain higher porosity than one derived from a Co-based ZIF,30 whereas Co can promote the graphitization of the porous carbon, leading to higher electrical conductivity in composites.31 Therefore, a carbon composite derived from a ZIF containing both Zn and Co may retain its porous structure, as well as showing considerable graphitization at low pyrolysis temperatures. As we estimated, the experiment shows that the graphitization, pore size distribution and surface area properties can be adjusted through modulating the molar ratio of Zn to Co in the bimetallic ZIF. The pyrolysis product of a bimetallic ZIF has a lower pore size distribution and higher surface area than that of ZIF67 containing a single metal element. A CoZn alloy/porous carbon composite with an optimized Zn/Co molar ratio shows enhanced EM wave absorption properties, due to its higher dielectric loss and better impedance matching. It can be a promising candidate for EM wave shielding applications. This article provides an effective method for improving the dielectric loss and impedance matching of carbon materials, proving that porous structures have great influence on the dielectric properties of carbon materials. Constructing a porous structure allows the fabrication of carbon-based EM wave absorption materials at low graphitization temperatures, which will contribute to energy-saving and simplification of the fabrication process. Moreover, this strategy can also be applied to the design of other materials for EM wave absorption and shielding.
2. Experimental section
2.1 Synthesis of composites
All chemicals were of analytical grade and used directly without further purification. 48 mmol of 2-methylimidazole was dissolved in 100 mL of methanol. Then a mixture of zinc nitrate hexahydrate (Zn(NO3)2·6H2O) and cobalt nitrate hexahydrate (Co(NO3)2·6H2O) with a certain molar ratio was dissolved in 100 mL of methanol. The total molar amount of Zn and Co was 6 mmol. The above two solutions were mixed and then kept for 6 hours under magnetic stirring. The product was separated via centrifugation and washed with methanol twice. Then the product was dried for 12 hours at 60 °C. Next the powder was heated to 500 °C at a heating rate of 5 °C min−1 and kept for 3 h at 500 °C under a flowing argon (40 mL min−1) atmosphere, and cooled to room temperature naturally. The obtained composites and corresponding ZIFs were denoted according to the molar ratio of Zn to Co, as shown in Table 1.| Sample | BM0 | BM0.2 | BM0.5 | BM1 | BM5 |
|---|---|---|---|---|---|
| Precursor ZIFs | ZIF67 | BMZIF0.2 | BMZIF0.5 | BMZIF1 | BMZIF5 |
| Molar ratio of Zn to Co | 0 | 0.2 | 0.5 | 1 | 5 |
| Content of Zn(NO3)2 | 0 | 1 mmol | 2 mmol | 3 mmol | 5 mmol |
| Content of Co(NO3)2 | 6 mmol | 5 mmol | 4 mmol | 3 mmol | 1 mmol |
2.2 Characterization
The morphologies and structures of the samples were examined using scanning electron microscopy (SEM; Nanolab600i, Helios, 20 kV, USA) and transmission electron microscopy (TEM; TecnaiF2 F30, FEI, 300 kV, USA). Energy dispersive X-ray (EDX) analysis was carried out using the scanning electron microscope. Powder X-ray diffraction (XRD) was carried out using an X-ray diffractomer (XRD, Empyrean, PANalytical, Netherlands) using Cu Kα (λ = 1.54 Å) radiation to study the phase composition of the composites before and after thermal treatment. X-ray photoelectron spectra of the composites were collected using an X-ray photoelectron spectrometer (XPS, K-alpha, Thermo Scientific, USA). Raman spectra were collected using a confocal Raman microscope (Confocal Raman Microscope, inVia, Renishaw, UK) equipped with a He–Ne laser (λ = 532 nm). Nitrogen adsorption–desorption measurements were carried out using specific surface area analyzers (ASAP-2000, Micromeritics, USA) at 77 K. Surface areas were calculated using the Brunauer–Emmett–Teller (BET) model. Pore size distributions were calculated using the Barrett–Joyner–Halenda (BJH) method. Magnetic hysteresis loops were measured using a vibrating sample magnetometer (JDAW-2000C&D, VSM, China). The complex permittivities (εr) and permeabilities (μr) of the samples were measured using a vector network analyzer (VNA, N5230A, Agilent, USA) in the 2–18 GHz band. The samples were mixed with molten paraffin and compressed into standard rings with an outer diameter of 7 mm, an inner diameter of 3 mm and a thickness of 3 mm to carry out the measurements. Microwave absorption properties were calculated according to transmission line theory using Matlab 2015 software.3. Results and discussion
3.1. Morphology and structure characterization
Fig. 1(a–e) shows the morphologies of the bimetallic ZIFs. With increasing Zn content, the particle diameter of the dodecahedrons decreases from ∼400 nm to ∼60 nm. According to previous literature studies,30 Co and Zn ions coexist and are highly dispersed in the bimetallic ZIF since they can coordinate with the 2-methylimidazole ligand with exactly the same topography. Fig. 1(f–j) represents the morphologies of the composites derived from different ZIFs. The pyrolysis products all show a kind of shrinkage, with coarse surfaces and irregular shapes. Some carbon nanowires resulting from Co catalysis can be seen in some of the composites with a small particle size, such as in BM0.5 and BM1 (shown in the inset images in Fig. 1(h) and (i)), which corresponds to observations in previous literature studies.24,32 EDX spectra are shown in Fig. S1 (ESI†) and the corresponding atomic percentages of different elements are listed in Table S1 (ESI†). The Zn/Co molar ratios in BM0.2, BM0.5, BM1 and BM5 are 0.14, 0.32, 0.81 and 3.4, which are lower than the ratios in the corresponding reactants. This difference can be attributed to the evaporation of Zn above its melting point (419.5 °C).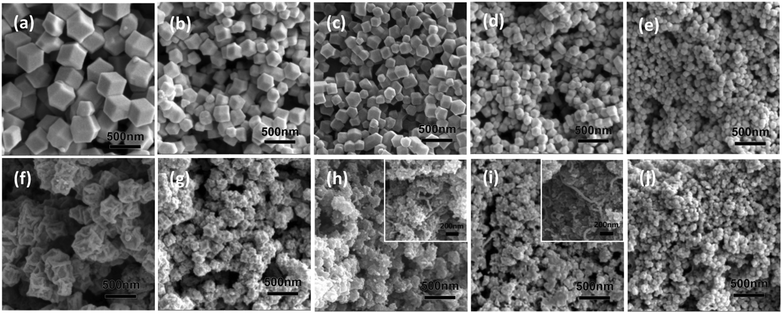 | ||
| Fig. 1 SEM images of BM0–BM5 samples before (a–e) and after (f–j) thermal treatment with the inserted images in (h) and (i) showing the corresponding magnification. | ||
TEM images of the samples BM0.2 and BM1 in Fig. 2 show that fine metal nanocrystals are distributed uniformly in the carbon matrix of the composites. The diffraction rings in the SAED pattern of BM0.2 can be attributed to Co, as labeled in Fig. 2(b). The HRTEM pattern of BM0.2 shows that clear stripes of graphitized carbon exist around the Co crystal, which should be ascribed to catalytic graphitization behavior of Co.24 The SAED pattern of BM1 shows similar diffraction rings except for the smallest one, which cannot be attributed to any known phases. It is estimated that this diffraction ring may be ascribed to an intermetallic compound of Zn and Co, which is stable and apt to form in a CoZn alloy.33,34 However, lattice fringes of the unknown phase cannot be observed in the HRTEM patterns of BM1, probably due to its low content.
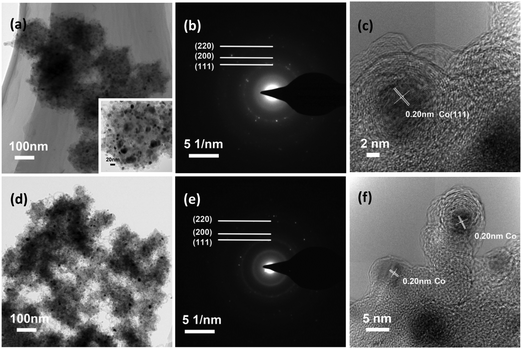 | ||
| Fig. 2 TEM images (a, d), and SAED (b, e) and HRTEM (c, f) patterns of BM0.2 ((a)–(c)) and BM1 ((d)–(f)), with a magnified inset of (a). | ||
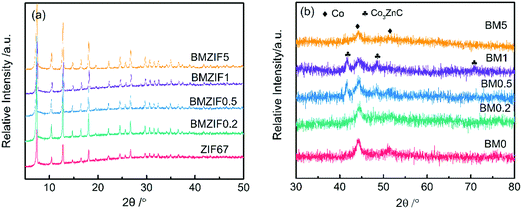
The powder XRD patterns of all the bimetallic ZIFs in Fig. 3(a) are identical to that of ZIF67, indicating that they have the same crystal structure. XRD patterns of BM0–BM5 composites all have two peaks at 44.2° and 51.5°, indexed to (111) and (200) diffraction peaks of cobalt (JCPDS 15-0806). Also, BM0.5 and BM1, with medium Zn content, show three diffraction peaks at about 41.5°, 48.3° and 71.1°, which can be ascribed to Co3ZnC (JCPDS 29-0524). Co3ZnC is an interstitial alloy that has metallic structures with carbon atoms in the interstitial voids.35 However, all peaks of Co3ZnC are shifted left about 0.4°, suggesting that the lattice constant has enlarged. Moreover, no peaks from zinc or zinc oxide are observed in the patterns of BM0.2 and BM5 containing a certain Zn content, suggesting that the existing Zn has dissolved in metallic Co or is in an amorphous state.
XPS survey scan spectra of BM0.2 and BM1 shown in Fig. 4(a) show the presence of Zn, Co, C, N, and O elements in the composites. The peaks from various orbital levels of Zn in BM1 are obviously higher than those for BM0.2. XPS spectra were fitted using a Gauss–Lorentzian peak shape after performing a Shirley background correction. The fitted high-resolution Co 2p spectra of the two samples present three forms of Co species, metallic Co (777.8 eV), CoOx or CoCxNy (779.2–779.5 eV), and Co–Nx (781.0–781.2 eV).30 The N 1s spectra can be split into four components corresponding to pyridinic (398.3–398.4 eV), pyrrolic (399.3–399.6 eV), graphitic (400.6–400.8 eV) and oxidized (404.3–404.5 eV) nitrogen respectively, revealing that most nitrogen is incorporated into carbon.36,37 The C 1s peak can be fitted into four components: the three peaks located at 284.6, 286.5 and 288.8 correspond to C–C, C![[double bond, length as m-dash]](https://www.rsc.org/images/entities/char_e001.gif) O and C–OH bonds,38 while the one at 285.2 eV should be assigned to a N–sp2 C bond.39 As the Zn 2p high-resolution spectra show, one peak at 1021.2 eV corresponds to the Zn 2p1/2 orbital level and the other peak at 1044.4 eV corresponds to the Zn 2p3/2 orbital level. The peaks in both samples are symmetrical, suggesting there is no other valence state of Zn present, other than the metallic and oxidation states.40
O and C–OH bonds,38 while the one at 285.2 eV should be assigned to a N–sp2 C bond.39 As the Zn 2p high-resolution spectra show, one peak at 1021.2 eV corresponds to the Zn 2p1/2 orbital level and the other peak at 1044.4 eV corresponds to the Zn 2p3/2 orbital level. The peaks in both samples are symmetrical, suggesting there is no other valence state of Zn present, other than the metallic and oxidation states.40
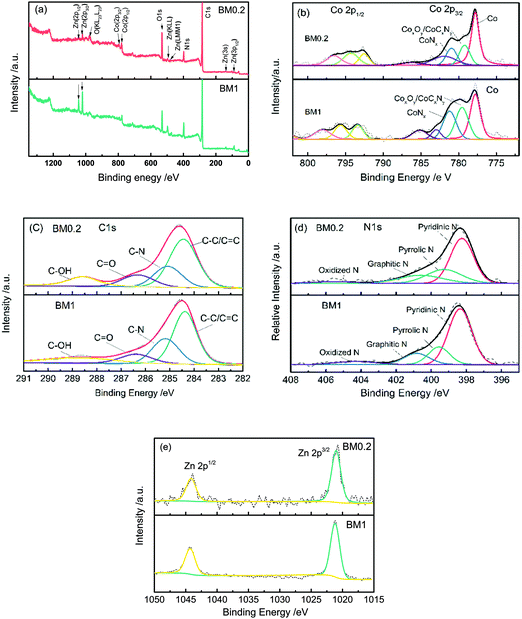 | ||
| Fig. 4 XPS survey scans (a) and high-resolution Co 2p (b), C 1s (c) N 1s (d), and Zn 2p (e) spectra for BM0.2 and BM1 samples. | ||
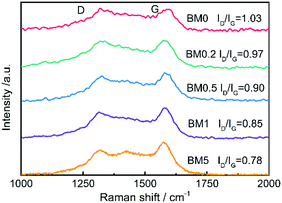
Raman spectra of the samples shown in Fig. 5 show two distinct peaks from carbon, one at ∼1354 cm−1 called the D band and the other at ∼1591 cm−1 called the G band. The former originates from the presence of defects and disorder, while the latter can be ascribed to the vibration of sp2 carbon atoms.41 According to the research of Ferrari and Robertson,42ID/IG will increase gradually when amorphous carbon transforms into nanocrystalline carbon. The calculated value of ID/IG for the composite rises from 0.78 to 1.03 as the Co content of the precursor increases, suggesting the increasing graphitization of carbon.
The porosity and surface areas of the composites are examined using N2 absorption and desorption tests. As shown in Fig. 6, ZIF67 and BMZIF0.2 both have type-I isotherms, which show a sharp increase at low relative pressure, indicating the presence of micropores. However, all the composites have type-IV isotherms with hysteresis loops at a relative pressure between 0.5–1.0, suggesting a mesoporous structure. Moreover, the rapid growth of relative pressure at about 0.95 shows the presence of macropores in the composites. The BJH pore distributions shown in Fig. S2 (ESI†) reveal that the precursors possess a large amount of micropores with an average diameter of 1.9 nm and a small quantity of mesopores and macropores. The pore size distributions for the composites vary as the Zn content changes. BM0.5 and BM1 both have mesopores and macropores with diameters ranging from 5 to 100 nm and the former has a larger proportion of mesopores under 5 nm. Other samples all have pores with diameters ranging from 10 to 100 nm. It can be concluded from Fig. S2 (ESI†) that the increase in Zn content in the precursor benefits the formation of mesopores in the carbon matrix. The BET surface areas of the composites first increase and then decline dramatically as the Zn content increases, as shown in Fig. 6. This trend does not conform with what has been described in previous literature studies,30 in which the surface area grows with increasing Zn content monotonically at high pyrolysis temperature (such as 1000 °C). This difference may be due to the low pyrolysis temperature which is adverse to the formation of a porous structured carbon skeleton with overly high Zn content. Thus a proper amount of Zn is crucial for constructing a composite with high surface area. Moreover, the values of surface area for the composites are much lower than for their precursor and ZIF-derived carbon produced at high temperature reported in other literature studies,28,36 indicating the temperature dependence of the formation of porous structures of a carbon matrix.
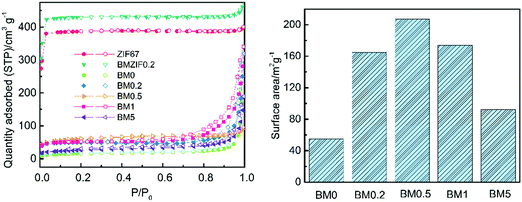 | ||
| Fig. 6 N2 absorption and desorption curves for ZIF67, BMZIF0.2, and BM0–BM5 samples; and the BET surface area of BM0–BM5 samples. | ||
As Fig. 7 shows, all the composites exhibit ferromagnetic hysteresis loops because of the existence of magnetic Co and CoZn alloy nanoparticles. The saturation magnetization values (Ms) for BM0, BM0.2, BM0.5, BM1 and BM5 are 53.4, 52.6, 29.1, 27.6, and 7.8 emu g−1, respectively, reducing as the nonmagnetic Zn content is elevated in the precursor. On the other hand, the Hc coercivity values decrease gradually with increasing Zn content, suggesting a gradual reduction in the particle size of the magnetic phase. The coercivity values for BM0, BM0.2 and BM0.5 are 142.5, 128.6 and 89.7 Oe, respectively. The BM1 and BM5 samples display quasi-superparamagnetic characteristics, with rather small remnant magnetization (1.62 and 0.33 emu g−1, respectively) and coercivity (25.0 and 19.3 Oe, respectively).
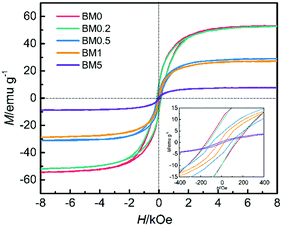 | ||
| Fig. 7 Magnetic hysteresis loops for BM0, BM0.2, BM0.5, BM1 and BM5 with an inset showing the corresponding plots at low applied magnetic fields. | ||
As is well known, the real parts of the complex permittivity (ε′) and permeability (μ′) represent storage ability for electrical and magnetic energy.1,8 The imaginary parts (ε′′ and μ′′) show dissipation capability for electrical and magnetic energy.1,9 EM wave absorption properties depend on the dissipation capability, as well as proper matching between ε and μ. Fig. 8 exhibits the frequency dependence of the real and imaginary parts of the permittivity and permeability of the BM0–BM5 samples and paraffin hybrids with a loading of 30 wt%. The ε′ values of all samples decrease with increasing frequency, except for BM0.2 and BM0.5, which have a valley at about 12 GHz. The ε′′ values for BM0 and BM5 first enhance and then drop at 12 and 14 GHz, respectively. The ε′′ values for BM0.2 and BM 0.1 show a similar tendency, with an additional small peak from 15 to 18 GHz. The ε′′ value for BM0.5 fluctuates much more than in the other samples, but shows a tendency to decrease with increasing frequency. All of the permittivity–frequency plots have a small resonance peak at about 12 GHz. Comparing the overall ε′′ values of all the composites over the range of 2–18 GHz, it is noticed that with increasing Zn content in the precursor, the ε′′ value first increases and then reduces. BM0.5 has the highest ε′ and ε′′ values, while BM5 has the lowest values. Most interestingly, this varying trend is exactly the same as the tendency of surface area values to change along with Zn content (as shown in Fig. 6). The value of tan![[thin space (1/6-em)]](https://www.rsc.org/images/entities/char_2009.gif) δ also shows a similar trend, except for the value for BM0.5 from 7 to 13 GHz. We can conclude that surface area or pore quantity have great influence on the complex permittivity values of the composites. This phenomenon reveals that polarization loss plays a leading role in the dielectric loss of the composites. It is widely known that dielectric loss comes from conductive loss and polarization loss, including ionic polarization, electronic polarization, dipole orientation polarization and interfacial polarization.14 For microwave frequencies (2–18 GHz), dipole orientation polarization and interfacial polarization contribute most, while the other two types work at much higher frequencies (103–106 GHz).14,43 Conductive loss depends on the electrical conductivity of the composites, which can be decided from their corresponding graphitization. The Raman spectra in Fig. 5 reveal that increasing the Zn content can reduce the graphitization of pyrolysis products, leading to a decrease in electrical conductivity. However, the dielectric loss still shows a sharp increase when the graphitization level drops, suggesting the leading role of polarization loss, especially interfacial polarization loss. The solid–air interfaces in the composites, provided by the abundant mesopores and macropores, will generate charge accumulation (known as the Maxwell–Wagner effect) under an electric field.16 This uneven charge distribution will dissipate electromagnetic energy through polarization relaxation. Besides, although BM5 has a much higher surface area than BM0, it shows lower permittivity, proving that some degree of graphitization is a prerequisite for the interfacial polarization of carbon/void interfaces.
δ also shows a similar trend, except for the value for BM0.5 from 7 to 13 GHz. We can conclude that surface area or pore quantity have great influence on the complex permittivity values of the composites. This phenomenon reveals that polarization loss plays a leading role in the dielectric loss of the composites. It is widely known that dielectric loss comes from conductive loss and polarization loss, including ionic polarization, electronic polarization, dipole orientation polarization and interfacial polarization.14 For microwave frequencies (2–18 GHz), dipole orientation polarization and interfacial polarization contribute most, while the other two types work at much higher frequencies (103–106 GHz).14,43 Conductive loss depends on the electrical conductivity of the composites, which can be decided from their corresponding graphitization. The Raman spectra in Fig. 5 reveal that increasing the Zn content can reduce the graphitization of pyrolysis products, leading to a decrease in electrical conductivity. However, the dielectric loss still shows a sharp increase when the graphitization level drops, suggesting the leading role of polarization loss, especially interfacial polarization loss. The solid–air interfaces in the composites, provided by the abundant mesopores and macropores, will generate charge accumulation (known as the Maxwell–Wagner effect) under an electric field.16 This uneven charge distribution will dissipate electromagnetic energy through polarization relaxation. Besides, although BM5 has a much higher surface area than BM0, it shows lower permittivity, proving that some degree of graphitization is a prerequisite for the interfacial polarization of carbon/void interfaces.
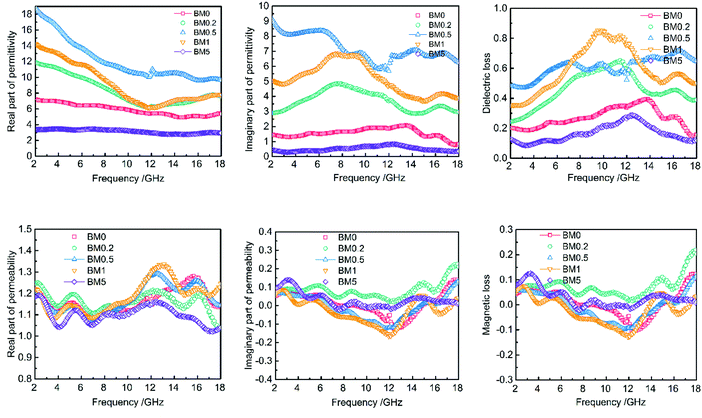 | ||
| Fig. 8 Frequency dependence of the complex permittivity and permeability values BM0–BM5 samples and paraffin hybrids with a loading of 30 wt%. | ||
The μ′ and μ′′ values of the composites show little difference over the range of 2–18 GHz, suggesting that magnetic loss is secondary in electromagnetic dissipation. The μ′ values vary from 1.0 to 1.35 with obvious fluctuation. All the samples have higher μ′ values at high frequencies (10–18 GHz) than at low frequencies, suggesting higher energy storage abilities. The μ′′-frequency curves for all the composites have a valley at about 12 GHz, which can be ascribed to Fabry–Pérot resonance.44 Besides, the μ′ and μ′′ values do not show a dependence on Zn content, although it affects the saturation magnetization and coercivity values of the composites.
The reflection loss (RL) was calculated according to transmission line theory and a metal back panel model, as the following equations show:1,28
 | (1) |
Z 0 and Zi are the characteristic impedance values of free space and the absorber, whose relation can be expressed through the following expression:
 | (2) |
μ r and εr are the relative complex permittivity and permeability of the absorber, f is the frequency of the electromagnetic wave, c is the velocity of light, and d is the thickness of the absorber. Fig. 9 displays the calculated RL values for samples with an optimized mass loading of 30 wt% at different thicknesses from 2 to 18 GHz. BM0, without the addition of Zn ions, shows limited EM wave absorption properties. The minimum RL value is −19.5 dB and the corresponding bandwidth with RL < −10 dB (effective bandwidth) is 4.5 GHz when the thickness is 3 mm. BM0.2, which has proper permittivity, exhibits the best properties. When the thickness is only 1.5 mm, the RL is up to −53.8 dB at 17.6 GHz. The largest effective bandwidth can reach 5.3 GHz with a minimum RL of −49.0 dB and an effective thickness of 2.0 mm. Besides, BM0.2 also shows excellent EM wave attenuation abilities at low frequencies. When the sample thickness is 4.5 mm, BM0.2 has a minimum RL of −59.7 at 4.9 GHz. BM0.5, with the highest surface area and permittivity values, shows weak EM wave absorption abilities due to an impedance mismatch. The RL values at different thicknesses are all above −20 dB. BM1 shows fair EM wave attenuation abilities at high frequencies, with a minimum RL of −50.7 dB, but weak absorption abilities at low frequencies. BM5 barely has EM wave absorption abilities across the whole microwave band, on account of its low graphitization and polarization loss. It can be seen from Fig. 9 that the EM wave absorption properties of the composites can be modulated through adjusting the molar ratio of Zn to Co in the precursor, which can effectively improve the complex permittivity of the composites through enhancing their surface area. However, an overly high Zn content has a negative effect on the formation of pore structure, resulting in low permittivity. Proper permittivity and impedance matching can be achieved through adding a certain amount of Zn into the precursor reaction. In addition, the minimum RL for all samples shifts towards lower frequencies with increasing thickness, due to quarter-wavelength attenuation,45 which results from the inverse phase angle of the reflected EM wave from the top and bottom surfaces of the absorber.
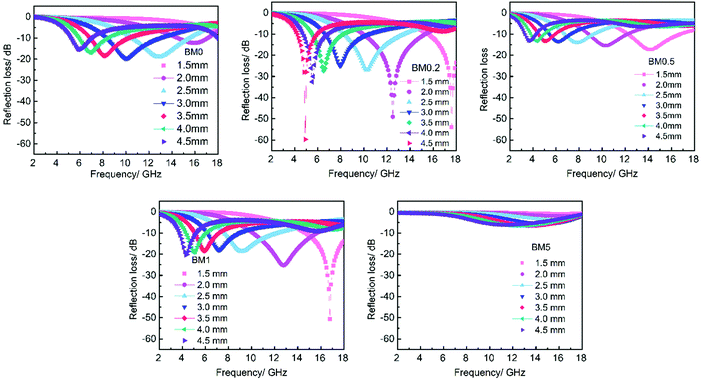 | ||
| Fig. 9 The frequency dependence of the reflection loss of BM0–BM5 samples and paraffin hybrid with a loading of 30 wt% at different thickness. | ||
Compared with the BM0 sample derived from ZIF67, the BM0.2 sample derived from a bimetallic ZIF containing Zn and Co shows more excellent EM wave absorption properties, mainly due to the presence of mesopores and macropores. The abundant pores improve the dielectric loss as well as impedance matching, which can be measured using the attenuation constant α and the modulus of normalized input impedance Z, respectively. The attenuation constant α can be expressed through eqn (S1) (ESI†). A higher α value represents better EM loss abilities.15 The modulus of normalized input impedance Z = |Zin/Z0| can be obtained by means of eqn (2). The impedance matching will be better if the Z value is much closer to 1. Fig. S3 (ESI†) shows the frequency dependence of the α and Z values of BM0 and BM0.2 at 2.0 mm. The α value for the BM0.2 sample is higher than that of BM0 over the range of 2–18 GHz, suggesting its more excellent integral EM loss abilities. Besides, the Z value of BM0.2 is closer to 1 over most of the wave band than it is for BM0, revealing its better impedance matching.
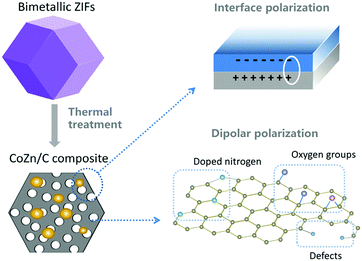
The CoZn alloy nanoparticle/N-doped porous carbon shows outstanding performance, with strong absorption and a large effective bandwidth, due to its multiple absorption mechanism. First of all, the carbon/void interfaces and carbon/metal interfaces in the porous composites contribute to interfacial polarization loss, as illustrated in Fig. 10. Secondly, the mesopores and macropores in the carbon matrix improve the impedance matching, so that more of the EM wave can enter into the absorber and dissipate. Thirdly, the residual oxygen functional groups, such as hydroxyl and carboxyl groups, the doped N atoms, and other defects in the graphite nanocrystals can act as polarized centers to attenuate EM wave energy (also shown in Fig. 10). Fourthly, the combination of dielectric material (carbon) and magnetic material (CoZn alloy) diversifies the attenuation mechanism.
4. Conclusion
CoZn alloy nanoparticle/N-doped porous carbon composites were synthesized through the pyrolysis of a bimetallic zeolitic imidazolate framework. The graphitization, porosity and surface areas of the composites can be modulated through adjusting the molar ratio of Zn to Co in the precursors. The dielectric loss and impedance matching can be enhanced through increasing the porosity and surface areas of the composites. The BM0.2 sample with appropriate surface area and graphitization shows the most prominent EM wave absorption properties. When the sample thickness is only 1.5 mm, the minimum RL can reach −53.2 GHz. The minimum RL is −59.7 dB at 4.5 mm and the maximum effective bandwidth is up to 5.3 GHz with a sample thickness of 2.0 mm. It can be manifested that the enhancement in EM wave absorption abilities should be ascribed to the abundant carbon–air interfaces in porous carbon. This study provides new ideas for the design of new EM wave absorption materials through an energy-saving and simple strategy.Conflicts of interest
There are no conflicts to declare.Acknowledgements
Partial support from NSFC grant no. 51571077, 51371071 and 51321061, the National Basic Science Research Program (2012CB933900), the Fundamental Research Funds for the Central Universities (HIT. BRETIII.201202) and the program for New Century Excellent Talents in the University of China (NCET-08-0166) are gratefully acknowledged.References
- R. C. Che, L. M. Peng, X. F. Duan, Q. Chen and X. L. Liang, Adv. Mater., 2004, 16, 401–405 CrossRef CAS.
- Z. Chen, C. Xu, C. Ma, W. Ren and H. M. Cheng, Adv. Mater., 2013, 25, 1296–1300 CrossRef CAS PubMed.
- Z. M. Dang, T. Zhou, S. H. Yao, J. K. Yuan and J. W. Zha, et al. , Adv. Mater., 2009, 21, 2077–2082 CrossRef CAS.
- R. Kumar, A. P. Singh, M. Chand, R. P. Pant and R. K. Kotnala, et al. , RSC Adv., 2014, 4, 23476–23484 RSC.
- M. S. Cao, W. L. Song, Z. L. Hou, B. Wen and J. Yuan, Carbon, 2010, 48, 788–796 CrossRef CAS.
- T. Zhao, C. Hou, H. Zhang, R. Zhu and S. She, et al. , Sci. Rep., 2014, 4, 5619–5625 CrossRef CAS PubMed.
- H. Zhou, J. Wang, J. Zhuang and Q. Liu, Nanoscale, 2013, 5, 12502–12511 RSC.
- B. Wen, M. Cao, M. Lu, W. Cao and H. Shi, et al. , Adv. Mater., 2014, 26, 3484–3489 CrossRef CAS PubMed.
- D. Sun, Q. Zou, Y. Wang, Y. Wang, W. Jiang and F. Li, Nanoscale, 2014, 6, 6557–6562 RSC.
- D. Chen, G. S. Wang, S. He, J. Liu and L. Guo, et al. , J. Mater. Chem. A, 2013, 1, 5996–6003 CAS.
- H. Chuangang, M. Zhongyu, L. Gewu, C. Nan and D. Zelin, et al. , Phys. Chem. Chem. Phys., 2013, 15, 13038–13043 RSC.
- X. Wang, J. Yu, H. Dong, M. Yu and B. Zhang, et al. , Appl. Phys. A: Mater. Sci. Process., 2015, 119, 1483–1490 CrossRef CAS.
- J. Feng, Y. Hou, Y. Wang and L. Li, ACS Appl. Mater. Interfaces, 2017, 9, 14103–14111 CAS.
- R. Qiang, Y. Du, D. Chen, W. Ma and Y. Wang, et al. , J. Alloys Compd., 2016, 681, 384–393 CrossRef CAS.
- B. Quan, X. Liang, G. Ji, J. Ma and P. Ouyang, et al. , ACS Appl. Mater. Interfaces, 2017, 9, 9964–9974 CAS.
- Z. Wang, L. Wu, J. Zhou, Z. Jiang and B. Shen, Nanoscale, 2014, 6, 12298–12302 RSC.
- T. S. Wang, Z. H. Liu, M. M. Lu, B. Wen and Q. Y. Ouyang, et al. , J. Appl. Physiol., 2013, 113, 024314 CrossRef.
- S. J. Yan, C. Y. Xu, J. T. Jiang, D. B. Liu and Z. Y. Wang, et al. , J. Magn. Magn. Mater., 2014, 349, 159–164 CrossRef CAS.
- T. Liu, X. Xie, Y. Pang and S. Kobayashi, J. Mater. Chem. C, 2016, 4, 1727–1735 RSC.
- A. U. Czaja, N. Trukhan and U. Muller, Chem. Soc. Rev., 2009, 38, 1284–1293 RSC.
- U. Mueller, M. Schubert, F. Teich, H. Puetter and K. Schierle-Arndt, et al. , J. Mater. Chem., 2006, 16, 626–636 RSC.
- W. Chaikittisilp, K. Ariga and Y. Yamauchi, J. Mater. Chem. A, 2013, 1, 14–19 CAS.
- S. Zhong, C. Zhan and D. Cao, Carbon, 2015, 85, 51–59 CrossRef CAS.
- R. Wu, D. P. Wang, X. Rui, B. Liu and K. Zhou, et al. , Adv. Mater., 2015, 27, 3038–3044 CrossRef CAS PubMed.
- S. J. Yang, T. Kim, J. H. Im, Y. S. Kim and K. Lee, et al. , Chem. Mater., 2012, 24, 464–470 CrossRef CAS.
- H. X. Zhong, J. Wang, Y. W. Zhang, W. L. Xu and W. Xing, et al. , Angew. Chem., 2014, 53, 14235–14239 CrossRef CAS PubMed.
- R. Qiang, Y. Du, H. Zhao, Y. Wang and C. Tian, et al. , J. Mater. Chem. A, 2015, 3, 13426–13434 CAS.
- Y. Lu, Y. Wang, H. Li, Y. Lin and Z. Jiang, et al. , ACS Appl. Mater. Interfaces, 2015, 7, 13604–13611 CAS.
- Z. Yang, H. Lv and R. Wu, Nano Res., 2016, 9, 3671–3682 CrossRef CAS.
- Y. Z. Chen, C. Wang, Z. Y. Wu, Y. Xiong and Q. Xu, et al. , Adv. Mater., 2015, 27, 5010–5016 CrossRef CAS PubMed.
- M. Huang, K. Mi, J. Zhang, H. Liu and T. Yu, et al. , J. Mater. Chem. A, 2017, 5, 266–274 CAS.
- W. Zhang, X. Jiang, X. Wang, Y. V. Kaneti and Y. Chen, et al. , Angew. Chem., 2017, 56, 8435–8440 CrossRef CAS PubMed.
- I. Isomaki and M. Hamalainen, J. Alloys Compd., 2004, 375, 191–195 CrossRef CAS.
- O. V. Duchenko, V. M. Vereshchaka and V. I. Dybkov, J. Alloys Compd., 1999, 288, 164–169 CrossRef CAS.
- P. S. Ying Xiao and M. Cao, ACS Nano, 2014, 8, 7846–7857 CrossRef PubMed.
- X. Wang, X. Fan, H. Lin, H. Fu and T. Wang, et al. , RSC Adv., 2016, 6, 37965–37973 RSC.
- W. Xia, J. Zhu, W. Guo, L. An and D. Xia, et al. , J. Mater. Chem. A, 2014, 2, 11606–11613 CAS.
- M. Han, X. Yin, L. Kong, M. Li and W. Duan, et al. , J. Mater. Chem. A, 2014, 2, 16403–16409 CAS.
- J. W. Jang, C. E. Lee, S. C. Lyu, T. J. Lee and C. J. Lee, Appl. Phys. Lett., 2004, 84, 2877–2879 CrossRef CAS.
- B. Szczygieł, A. Laszczyńska and W. Tylus, Surf. Coat. Technol., 2010, 204, 1438–1444 CrossRef.
- D. Yang, A. Velamakanni, G. Bozoklu, S. Park and M. Stoller, et al. , Carbon, 2009, 47, 145–152 CrossRef CAS.
- A. C. Ferrari and J. Robertson, Phys. Rev. B: Condens. Matter Mater. Phys., 2000, 61, 14095–14107 CrossRef CAS.
- X. Zhang, G. Ji, W. Liu, B. Quan and X. Liang, et al. , Nanoscale, 2015, 7, 12932–12942 RSC.
- Z. L. Hou, M. Zhang, L. B. Kong, H. M. Fang and Z. J. Li, et al. , Appl. Phys. Lett., 2013, 103, 335–338 Search PubMed.
- L. Kong, X. Yin, Y. Zhang, X. Yuan, Q. Li, F. Ye, L. Cheng and L. Zhang, J. Phys. Chem. C, 2013, 117, 19701–19711 CAS.
Footnote |
| † Electronic supplementary information (ESI) available: EDX spectra of BM0.2, BM0.5, BM1 and BM5 samples; atomic percentages and molar ratios of BM0.2, BM0.5, BM1 and BM5 samples; BJH desorption pore size distribution curves for ZIF67, BMZIF0.2 and the composites; the frequency dependence of reflection loss, the attenuation constant α and the modulus of normalized input impedance for BM0 and BM0.2 with a thickness of 2.0 mm; and an expression of the equation for the attenuation constant α. See DOI: 10.1039/c7tc03784h |
| This journal is © The Royal Society of Chemistry 2018 |

