MoS2 nanosheet–Au nanorod hybrids for highly sensitive amperometric detection of H2O2 in living cells†
Yun
Shu
 a,
Jingyuan
Chen
a,
Qin
Xu
a,
Zhen
Wei
a,
Fengping
Liu
a,
Rui
Lu
b,
Sheng
Xu
b and
Xiaoya
Hu
*a
a,
Jingyuan
Chen
a,
Qin
Xu
a,
Zhen
Wei
a,
Fengping
Liu
a,
Rui
Lu
b,
Sheng
Xu
b and
Xiaoya
Hu
*a
aSchool of Chemistry and Chemical Engineering, Yangzhou University, Yangzhou 225002, China. E-mail: xyhu@yzu.edu.cn
bCo-innovation Center for Prevention and Control of Important Animal Infectious Diseases and Zoonoses, School of Veterinary Medicine, Yangzhou University, Yangzhou 225002, China
First published on 4th January 2017
Abstract
MoS2 nanosheet–Au nanorod (MoS2–Au) hybrids were utilized to immobilize catalase (CAT) to construct a sensitive hydrogen peroxide (H2O2) electrochemical biosensor for the reliable determination of H2O2 released from living cells. The fabricated biosensor was characterized by transmission electron microscopy (TEM), UV-Vis spectroscopy, Fourier transform infrared spectroscopy (FT-IR) and Raman spectroscopy, it was observed that the MoS2–Au hybrid provides excellent matrixes for the adsorption of CAT and the entrapped CAT maintains its native structure and bioactivity. The results of direct electrochemical measurements indicate that on the CAT/MoS2–Au modified electrode, CAT exhibits a surface controlled and fast electron transfer process towards H2O2 reduction. The MoS2–Au hybrid has a large surface area and provides a biocompatible microenvironment for accelerating direct electron transfer between the enzyme and the electrode. The detection limit of the constructed H2O2 biosensor is 1 × 10⁻⁷ M (signal-to-noise = 3) with a wide linear range from 5 × 10⁻⁷ M to 2 × 10⁻⁴ M and a high sensitivity of 187.4 mA M−1 cm−2. The fabricated H2O2 biosensor also exhibits excellent selectivity, good reproducibility and long-time stability. Furthermore, the biosensor was used to perform real-time monitoring of H2O2 released from SP2/0 cells, indicating the MoS2–Au hybrid is an attractive material for application in the efficient immobilization of biomolecules and construction of high-performance biosensors.
Introduction
Reactive oxygen species (ROS) play an important role in the cell metabolism process and are the markers of cancer and progressive neurodegenerative disease such as Alzheimer disease, Parkinson's disease, etc.1–3 H2O2, which can diffuse through cell membranes freely, is a typical representative of ROS in living organisms.4,5 Keeping the amount of H2O2 at a proper level is important for the intracellular signalling pathways of normal cells.6,7 In order to have a better understanding of the biological effects of H2O2, it is of great importance to determine H2O2 levels in biological environments, especially in cellular environments.Until now, various methods such as fluorescence,8–10 chemiluminescence11,12 and electrochemical methods13–17 have been employed for H2O2 detection. Among these methods, the electrochemical technique is considered to be an efficient method, owing to its low detection limit, high selectivity, simple apparatus and low cost. Many nonenzymatic electrochemical sensors have been developed for real-time monitoring of H2O2 from living cells in recent years.18–22 However, the electrochemical methods based on enzyme-immobilized electrodes have captured significant attention, owing to their intrinsic advantages such as high selectivity and low detection limit due to the high specific activity of the enzyme toward H2O2 reduction.13,14,17 Unfortunately, because the redox centers of enzymes are deeply entrapped in proteins, it is difficult to realize direct electron transfer (DET) from the redox center of the enzyme to the bare electrodes.23,24 Thus, an electron transfer mediator is required to promote the DET between the redox center of the enzyme and the electrode. In the past decades, various nanomaterials have been used as electron mediators to enhance the DET of redox enzymes on the electrode surface.24–26 Furthermore, the amount of enzyme that can be effectively immobilized on an electrode is determined by the protein adsorption ability of the nanomaterials,27 thus affecting the concentration of electroactive enzymes on the electrode surface and the performance of the biosensor. The protein adsorption ability of nanomaterials is affected by its size,28 surface morphology29,30 and surface chemistry.31,32 Therefore, one of the major challenges is to find the desirable nanomaterials to accelerate the DET between the redox center of the enzyme and the electrode, increase the amount of enzyme adsorption, and retain enzyme activity.
MoS2, as a kind of two-dimensional layered material, has been widely applied in the fields of energy conversion and storage, due to its catalytic performance toward the hydrogen evolution reaction (HER)33–35 and oxygen reduction reaction (ORR).36 Recently, it has also attracted great attention in electrochemical biosensing, attributed to its fast heterogeneous electron-transfer rate at the edge sites of the MoS2 nanosheet, large specific surface area and good biocompatibility.37–39 With a structure similar to graphene, MoS2 is expected to be employed as a powerful atomic-scale scaffold for nanoparticles to form hybrid materials that can display novel and improved properties. The decoration of MoS2 nanosheets with metal nanoparticles can supply a larger electrochemically active surface area, thus effectively promoting the electron transfer between electrodes and analytes.33,40,41 Au nanoparticles and Au nanorods were decorated on the MoS2 nanosheet to improve its catalytic activity in photocatalytic water splitting and HER.33,40 However, research on the application of these hybrid materials in electrochemical biosensing has rarely been reported.
In this work, a H2O2 electrochemical biosensor was constructed based on MoS2 nanosheet–Au nanorod hybrids to measure the release of H2O2 from living cells (Scheme 1). The MoS2–Au hybrid, which combines the advantages of MoS2 and Au nanorods, was prepared to immobilize CAT on the glassy carbon electrode (GCE). Unsaturated sulfur atoms on the edge of MoS2 nanosheets control the decoration of nanoparticles without aggregation. FT-IR, UV-Vis and Raman spectra demonstrate that the immobilized CAT retains its native structure and bioactivity. Amperometric responses show that the biosensor has high sensitivity, selectivity and stability towards H2O2 detection. The trace concentrations of H2O2 released by SP2/0 cells can be determined by the constructed biosensor in our work, which makes the MoS2–Au hybrid a promising platform in direct, real-time biosensing.
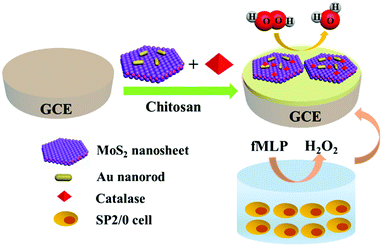 | ||
| Scheme 1 Schematic of the catalase/MoS2–Au/chitosan modified GCE used for detecting H2O2 released from cells stimulated with fMLP. | ||
Experimental section
Reagents and apparatus
Catalase from bovine liver, chloroauric acid (HAuCl4·4H2O) and fMLP (N-formylmethionyl-leucyl-phenylalanine) were bought from Sigma. Molybdenum disulfide (MoS2) was bought from JC NANO, Inc. (China). Phosphate buffered saline solution (PBS, 0.1 M, pH 7.0) comprising NaH2PO4 and Na2HPO4 was used as the supporting electrolyte. 1× PBS (pH 7.4) including KH2PO4 (1.76 mM), Na2HPO4 (10.14 mM), KCl (2.68 mM) and NaCl (136.75 mM) was utilized to wash and disperse SP2/0 cells. All other chemical reagents were bought from Sinopharm Chemical Reagent, Shanghai Co. Ltd.AuNRs synthesis
Au nanorods (AuNRs) were synthesized using the silver-assisted seed-mediated growth procedure.42,43 Typically, 0.25 mL HAuCl4 (0.01 M) was added into 9.75 mL cetyltrimethyl ammonium bromide (CTAB, 0.1 M) with gentle mixing to prepare the seed solution. Then, 0.2 mL of freshly prepared ice-cold NaBH4 solution (0.03 M) was added to the solution, and the mixture was rapidly stirred for 2 min. The seed solution was placed at room temperature and 2 h later, HAuCl4 (2.5 mL, 0.01 M), AgNO3 (0.45 mL, 0.01 M), HCl (1 mL, 1 M) and ascorbic acid (0.4 mL, 0.1 M) were successively added to CTAB (40 mL, 0.1 M). Finally, 350 μL of seed solution was added to the above solution, which was slowly stirred for 30 s and kept undisturbed overnight to grow Au nanorods. The products were collected and centrifuged at 12![[thin space (1/6-em)]](https://www.rsc.org/images/entities/char_2009.gif) 000 rpm for 20 min. Finally, the products were rinsed with double distilled water at least three times to wash the excess unbound CTAB molecules, and were redispersed in 2.5 mL of double distilled water for use. The extinction coefficient of AuNRs was assumed to be 4.6 × 10⁹ M−1 cm−1 at 785 nm.44 The concentration was measured to be 4.8 × 10⁻⁹ M using UV-Vis spectra.
000 rpm for 20 min. Finally, the products were rinsed with double distilled water at least three times to wash the excess unbound CTAB molecules, and were redispersed in 2.5 mL of double distilled water for use. The extinction coefficient of AuNRs was assumed to be 4.6 × 10⁹ M−1 cm−1 at 785 nm.44 The concentration was measured to be 4.8 × 10⁻⁹ M using UV-Vis spectra.
Preparation of the MoS2–Au hybrid
The MoS2–Au hybrid was prepared by mixing the MoS2 (2 mg mL−1) and AuNRs solutions with a volume ratio of 3![[thin space (1/6-em)]](https://www.rsc.org/images/entities/char_2009.gif) :
:![[thin space (1/6-em)]](https://www.rsc.org/images/entities/char_2009.gif) 1. Then, the mixture was sonicated for 1 h.
1. Then, the mixture was sonicated for 1 h.
Fabrication of different modified electrodes
The MoS2–Au hybrid solution was mixed with chitosan solution (0.5%, w/v) with a volume ratio of 2![[thin space (1/6-em)]](https://www.rsc.org/images/entities/char_2009.gif) :
:![[thin space (1/6-em)]](https://www.rsc.org/images/entities/char_2009.gif) 1. After the mixture was sonicated for 20 min to form a homogeneous dispersion, 50 μL of catalase solution (10 mg mL−1) was added to 50 μL of the MoS2–Au/chitosan suspension. After mixing for 1 min, it was stored at 4 °C overnight for adsorption of enzyme onto the MoS2–Au hybrid. The GCE (diameter 3 mm) was polished with 0.3 μm Al2O3 slurry and later cleaned by brief ultrasonication with ethanol and water, respectively. Then, 5 μL of the above mixture was added to the GCE surface and dried at 4 °C overnight as a working electrode.
1. After the mixture was sonicated for 20 min to form a homogeneous dispersion, 50 μL of catalase solution (10 mg mL−1) was added to 50 μL of the MoS2–Au/chitosan suspension. After mixing for 1 min, it was stored at 4 °C overnight for adsorption of enzyme onto the MoS2–Au hybrid. The GCE (diameter 3 mm) was polished with 0.3 μm Al2O3 slurry and later cleaned by brief ultrasonication with ethanol and water, respectively. Then, 5 μL of the above mixture was added to the GCE surface and dried at 4 °C overnight as a working electrode.
Apparatus and electrochemical tests
The morphology of nanomaterials was observed using TEM (JEM-2100) and field-emission scanning electron microscopy (FESEM, Supra 55, Zeiss). Fourier transform infrared spectra (FT-IR) were obtained with a Tensor 27 spectrometer (Bruker Co.). UV-Vis absorption spectra were obtained using a UV2550 spectrometer (SHIMADZU). Raman spectra were obtained using a Confocal Raman spectrometer (InVia, Renishaw Co.).Electrochemical tests were carried out using a CHI760D electrochemical workstation (CHI Co., Shanghai) with a three-electrode arrangement, equipped with a GCE as the working electrode, a platinum wire counter electrode and a saturated calomel electrode (SCE).
Cell culture
SP2/0 (mouse myeloma) cells were obtained from the School of Veterinary Medicine, Yangzhou University, and were cultivated in DMEM medium (Gibco) supplemented with 15% fetal bovine serum (Gibco), 100 mg mL−1 streptomycin (Sigma) and 100 U mL−1 penicillin (Sigma) with 5% CO2 at 37 °C.Electrochemical determination of H2O2 released by living cells
SP2/0 cells were centrifuged at 1500 rpm for 5 min to separate them from the DMEM medium. Afterwards, the cells were washed with 1× PBS solution (pH = 7.4) three times and dispersed in 4 mL of 1× PBS solution. The number of cells was counted using a cell counter and 5 μM of fMLP was injected into about 8.0 × 10⁷ cells in 4 mL of 1× PBS solution, which can stimulate cells to generate H2O2 endogenously.16 The amperometric current response of H2O2 released by SP2/0 cells was recorded at the catalase/MoS2–Au/chitosan modified GCE. The experiments were carried out in the 37 °C water bath.Results and discussion
Characterization of MoS2, MoS2–Au hybrid and CAT/MoS2–Au/chitosan
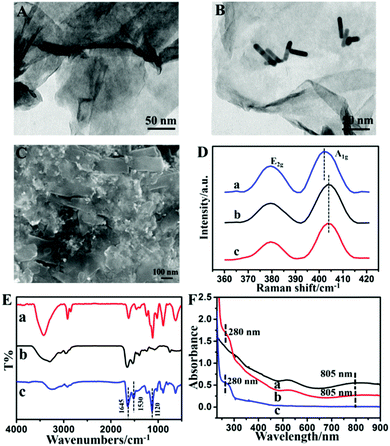
The TEM image in Fig. 1A shows the sheet structure of MoS2. Fig. 1B depicts that AuNRs are randomly dispersed on the surface of MoS2 nanosheets. The AuNRs are successfully assembled on MoS2 nanosheets to form the MoS2–Au hybrid, which should be attributed to the electrostatic interactions of MoS2 and AuNRs. The Au loading in the MoS2–Au hybrid is calculated as 11.48 atomic% (Fig. S1, ESI†). Chitosan, which has good biocompatibility and excellent capability for film formation, was used for dispersing the MoS2–Au hybrid. Fig. 1C shows the SEM image of CAT/MoS2–Au/chitosan, where aggregates of the loaded enzymes are distributed continuously and uniformly, indicating that the enzyme molecules are successfully immobilized in the MoS2–Au/chitosan nanocomposite film. The effect of assembled Au nanorods on the electronic properties of MoS2 is revealed by Raman spectroscopy (Fig. 1D). E2g and A1g peaks represent the in plane (2 S atoms in opposite direction to the Mo atom) and out of plane (S atoms in opposite directions) vibrations of MoS2, respectively.45 The interaction between Au nanorods and MoS2 affects the out of plane vibration of S atoms, thus leading to the A1g mode blue shifting by 2.43 cm−1.46The existing state of the catalase molecules loaded in the MoS2–Au hybrid was characterized by FT-IR. Fig. S2 (ESI†) displays the FT-IR spectra of MoS2 and AuNRs. FT-IR spectra of the MoS2–Au hybrid, CAT and CAT/MoS2–Au are shown in Fig. 1E. Two characteristic peaks at 1634 and 1554 cm−1 were found in the spectra of pure catalase, which are assigned to amide I and II bands of enzyme molecules (curve b). The FT-IR spectrum of CAT/MoS2–Au (curve c) also exhibits two characteristic absorption peaks at 1645 (amide I band) and 1530 (amide II band) cm−1, demonstrating that catalase molecules are successfully immobilized in the MoS2–Au hybrid matrix. UV-Vis spectroscopy is an efficient means to investigate the possible conformational changes of enzyme in the MoS2–Au hybrid. Fig. S3 (ESI†) displays the UV-Vis spectra of MoS2, AuNRs and the MoS2–Au hybrid. MoS2 nanosheets exhibit a clear near-UV absorption peak. The surface plasmon resonance (SPR) longitudinal band at 784 nm and transversal band at 520 nm are obviously observed in the UV-Vis spectrum of AuNRs. The spectrum of the MoS2–Au hybrid displays similar characteristic peaks to MoS2 nanosheets and a red-shift of the SPR longitudinal band at 805 nm (Fig. 1F), which might be due to the electronic interactions between MoS2 nanosheets and AuNRs. As seen in Fig. 1F, for the spectrum of native catalase (curve c), an absorption peak at about 280 nm is displayed, which is ascribed to the benzene ring conjugated double bonds of aromatic amino acids. A similar absorption peak also exists in CAT/MoS2–Au (curve b), indicating that the catalase immobilized in the MoS2–Au hybrid retains its native structure.
Direct electrochemical performance of CAT/MoS2–Au/chitosan GCE
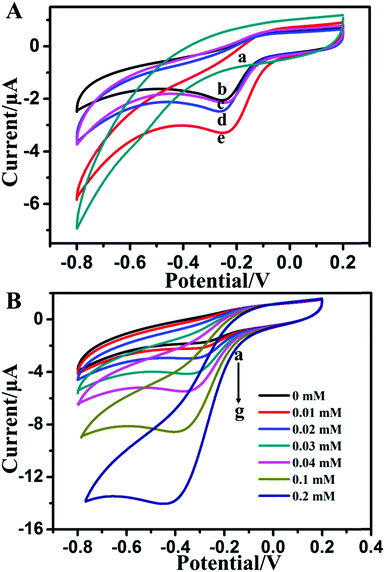
Cyclic voltammetry (CV) studies were conducted to investigate the direct electrochemical behavior of catalase immobilized in the MoS2–Au hybrid. Fig. 2A displays CV curves of MoS2–Au/chitosan/GCE, CAT/chitosan/GCE, CAT/MoS2/chitosan/GCE, CAT/Au/chitosan/GCE and CAT/MoS2–Au/chitosan/GCE in 0.1 M PBS (pH 7.0) at the scan rate of 100 mV s−1. No redox peak appeared at the MoS2–Au/chitosan electrode (curve a), indicating that electrodes cannot undergo redox reactions in the absence of catalase. However, CAT/chitosan/GCE exhibits a pair of obvious and well-defined redox peaks (curve b). The cathodic peak potential is −![[thin space (1/6-em)]](https://www.rsc.org/images/entities/char_2009.gif) 0.26 mV vs. SCE, which is consistent with the reported values for other nanomaterial modified electrodes.26,47 The peaks might be due to the redox reaction of the Fe(III)/Fe(IV) redox couple of the heme group in catalase. CAT/MoS2/chitosan/GCE (curve c), CAT/Au/chitosan/GCE (curve d) and CAT/MoS2–Au/chitosan/GCE (curve e) show a pair of more distinct redox peaks than CAT/chitosan/GCE, and CAT/MoS2–Au/chitosan/GCE offers the strongest peak current among these modified electrodes. This suggests that the MoS2–Au hybrid has enhanced direct electron transfer from the redox-active centers of catalase to the electrode surface, thus facilitating direct electrochemistry of catalase. It is possible that the electronic interactions between MoS2 nanosheets and AuNRs favored the direct electron transfer between the active centers of catalase and the electrode.
0.26 mV vs. SCE, which is consistent with the reported values for other nanomaterial modified electrodes.26,47 The peaks might be due to the redox reaction of the Fe(III)/Fe(IV) redox couple of the heme group in catalase. CAT/MoS2/chitosan/GCE (curve c), CAT/Au/chitosan/GCE (curve d) and CAT/MoS2–Au/chitosan/GCE (curve e) show a pair of more distinct redox peaks than CAT/chitosan/GCE, and CAT/MoS2–Au/chitosan/GCE offers the strongest peak current among these modified electrodes. This suggests that the MoS2–Au hybrid has enhanced direct electron transfer from the redox-active centers of catalase to the electrode surface, thus facilitating direct electrochemistry of catalase. It is possible that the electronic interactions between MoS2 nanosheets and AuNRs favored the direct electron transfer between the active centers of catalase and the electrode.
Fig. S4(A) (ESI†) shows the CV curves of CAT/MoS2–Au/chitosan/GCE at different scan rates. The peak currents change linearly with scan rates ranging from 25–500 mV s−1, demonstrating that the redox reaction of catalase at the MoS2–Au modified GCE is a surface controlled redox process. According to the Laviron equation, the electron transfer rate constant (ks) could be evaluated by measuring the variation in peak potential with scan rate.48 The electron transfer rate constant is calculated to be 1.07 s−1. The surface coverage Γ of the catalase molecule can be calculated from the equation Γ = Q/nFA, where Q is the charge consumed in the reaction, n is the number of electrons transferred, F is the Faraday constant, A is the effective surface area of the modified electrode. The surface coverage Γ of catalase was estimated to be 3.61 × 10⁻¹⁰ mol cm−2 using the charge integration of the cathodic peak in the CV curve at 100 mV s−1, indicating an approximate monolayer of catalase immobilized on the MoS2–Au hybrid modified GCE. The value is comparable to 1.53 × 10⁻¹⁰ mol cm−2 at catalase/NiO/MWCNTs/GCE,47 3.33 × 10⁻¹⁰ mol cm−2 at catalase/AuNPs/graphene-NH2/GCE,49 1.64 × 10⁻¹⁰ mol cm−2 at catalase/SWCNTs/GCE,50 reported previously. The large surface coverage may be attributed to the two-dimensional sheet structure of MoS2 nanomaterial, thus giving rise to the large surface area of the modified electrode.
The influence of pH value on the peak potentials of CAT/MoS2–Au/chitosan/GCE was also discussed using CV curves. As shown in Fig. S4(B) (ESI†), both the cathodic and anodic peak potentials shifted negatively with increasing pH values. The redox potentials of CAT/MoS2–Au/chitosan/GCE exhibit a linear relationship vs. the solution pH in the range of 5.0–8.5, with a slope of 43.5 mV per pH. This value is close to the theoretical value of 58 mV per pH (20 °C), indicating one-electron joining a single-proton in this electron transfer process.51
Electrocatalytic reduction of H2O2 at CAT/MoS2–Au/chitosan GCE
Owing to the high electron transfer rate of enzyme at the CAT/MoS2–Au/chitosan/GCE, and the well known fact that proteins, such as HRP, cytochrome c, myoglobin and catalase, which contain the heme groups, can bring about the electrocatalytic reduction of H2O2,52 CV studies were conducted to testify the electrocatalytic reduction activity of CAT/MoS2–Au/chitosan/GCE towards H2O2. Fig. 2B shows the CV curves of CAT/MoS2–Au/chitosan/GCE in 0.1 M PBS (pH = 7.0) when in the absence (curve a) and presence of H2O2 (curve b–g). Larger cathodic peak currents appear when in the presence of H2O2, indicating that the catalase shows excellent electrocatalytic activity for the reduction of H2O2. It is also found that when the concentration of H2O2 increased, the cathodic current response increased correspondingly. The reaction mechanism could be represented as follows:53H2O2 + Cat-Fe(III) → H2O + Cat-Fe(IV)![[double bond, length as m-dash]](https://www.rsc.org/images/entities/char_e001.gif) O O | (R1) |
(Compound 1)
H2O2 + Cat-Fe(IV)![[double bond, length as m-dash]](https://www.rsc.org/images/entities/char_e001.gif) O → H2O + O2 + Cat-Fe(III) O → H2O + O2 + Cat-Fe(III) | (R2) |
Firstly, there was electron transfer from the enzyme to the substrate to form compound 1. Then, compound 1 rapidly reacted with another H2O2 to generate H2O and O2. Reaction (1) is the rate-limiting step, thus playing an important role in the electron transfer process.
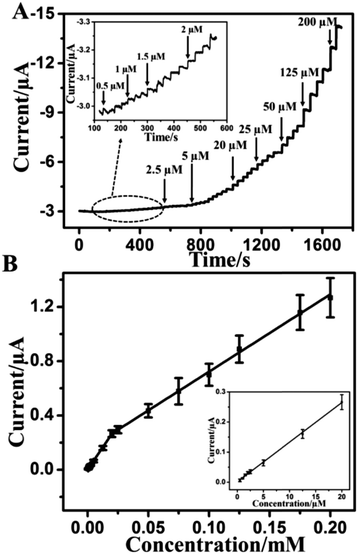
A real-time amperometric study was carried out to explore the detection sensitivity on the CAT/MoS2–Au/chitosan modified electrode. Fig. S5 (ESI†) displays the influences of pH value and applied potential on the amperometric response of CAT/MoS2–Au/chitosan GCE towards H2O2 determination. The optimal pH value and applied potential are chosen as pH 7.0 and −0.55 V. Fig. S6 (ESI†) shows the amperometric response for the successive injections of different amounts of H2O2 at −0.55 V for different electrodes. It is observed that CAT/MoS2–Au/chitosan/GCE exhibits enhanced amperometric response for H2O2 detection, compared with CAT/Au/chitosan/GCE, CAT/MoS2/chitosan/GCE and CAT/chitosan/GCE, demonstrating the superiority of CAT/MoS2–Au/chitosan/GCE for electrocatalytic reduction of H2O2. Fig. 3A shows the amperometric response of the CAT/MoS2–Au/chitosan modified electrode for the successive injection of various amounts of H2O2 into N2-saturated 0.1 M PBS (pH = 7.0) solution at −0.55 V. After H2O2 is added, it takes 2.5 s to achieve the maximum steady-state current, indicating the fast response to H2O2. This fast response is caused through the rapid absorption and activation of H2O2 on the surface of the CAT/MoS2–Au/chitosan modified electrode. Fig. 3B shows the corresponding calibration plots of current vs. concentration. The linear range for the H2O2 detection contains two segments: 5 × 10⁻⁷–2 × 10⁻⁵ M (correlation coefficient R2 = 0.998) and 2 × 10⁻⁵–2 × 10⁻⁴ M (R2 = 0.998). The sensitivity is 187.4 mA M−1 cm−2, based on five parallel electrodes. The detection limit for the H2O2 sensor reached 0.1 μM (ratio of signal-to-noise S/N = 3). Compared with other reported electrochemical sensors (Table 1), our sensor shows a low detection limit and wide linear range, which indicates a bright future in practical applications.
| Electrode materials | Linear range (μM) | Detection limit (μM) | Ref. |
|---|---|---|---|
| ND-NS(HRP) | 1000–45![[thin space (1/6-em)]](https://www.rsc.org/images/entities/char_2009.gif) 000 000 |
59 | 15 |
| HRP/Ag@C/ITO | 0.5–140 | 0.02 | 55 |
| HRP–Au–chitosan–clay | 39–3100 | 3.1 | 56 |
| HRP/TiO2/ITO | 1780 | 0.5 | 57 |
| Fe3O4–Au-HRP/GS-Nafion/SPCE | 20–2500 | 12 | 17 |
| Hb/CS@Fe3O4/Au | 2.3–9600 | 1.1 | 58 |
| HRP/BSA/SPCNTS | 5–100 | 0.85 | 59 |
| GNP-TNT/HIL/HRP | 15–750 | 2.2 | 60 |
| HRP/gold nanoseeds-TiO2 | 41–630 | 5.9 | 61 |
| Catalase/MoS2–Au/chitosan/GCE | 0.5–200 | 0.1 | This work |
The Michaelis–Menten constant (KM) can reflect the reaction kinetics of the enzyme and substrate and characterize the affinity between enzyme and substrate, according to the Lineweaver–Burk equation:54 1/Iss = (1/Imax) + (KM/ImaxC), where Iss is the steady-state current after the addition of substrate, Imax is the maximum current measured at saturated substrate solution and C is the bulk concentration of substrate. The apparent KM value was estimated to be 0.1 mM, which is lower than the value for catalase reported by other modified electrodes,47,49,62 showing that the CAT/MoS2–Au/chitosan modified electrode exhibits a high affinity for H2O2.
Reproducibility, stability and interference study of the H2O2 biosensor
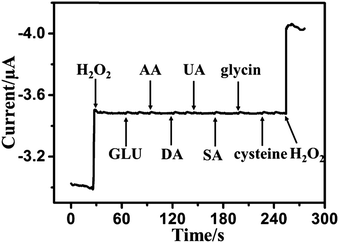
The reproducibility of the biosensor was tested by five measurements of the current response to 50 μM H2O2 under the same conditions for the same electrode. The relative standard deviation (RSD) of the current response to H2O2 sensing was less than 4.3%. Five parallel modified electrodes were used for detecting 50 μM of H2O2 under the same conditions. The RSD was estimated as 3.5%. All the above results indicate that the biosensor has good reproducibility. To investigate the stability of the sensor, the current response to H2O2 for the modified electrode was determined every two days for 2 weeks. The modified electrode was stored at 4 °C when not use. The current response to H2O2 was retained at 93% of the initial current after two weeks (Fig. S7, ESI†), demonstrating that the biosensor has good stability. The loss of the current response to H2O2 might be attributed to the following: (1) the environmental instability of enzyme biomolecules; (2) the electroactive-species absorption on the surface of the electrode, thus blocking contact of the CAT/MoS2–Au/chitosan/GCE with H2O2 and disturbing the electron transfer between the electrode and solution.The capability of distinguishing the target molecule from the interferences normally present in a complex biological environment is extremely important for a biosensor. Thus, we further discuss the impact of some electroactive species on the current response of CAT/MoS2–Au/chitosan/GCE. The amperometric response of the modified electrode was tested by adding 80 μM H2O2, 0.1 mM β-D(+) glucose (GLU), 0.1 mM ascorbic acid (AA), 0.1 mM dopamine (DA), 0.1 mM uric acid (UA), 0.1 mM salicylic acid (SA), 0.1 mM glycine, 0.1 mM L-cysteine and a second addition of 80 μM H2O2 (Fig. 4). This indicates that GLU, AA, DA, UA, SA, glycine and L-cysteine generate little current response at the CAT/MoS2–Au/chitosan/GCE under the applied potential, which means that the sensor has good selectivity.
Determination of H2O2 released from living cells
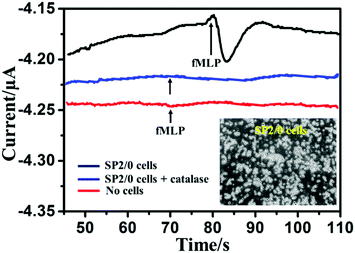
The CAT/MoS2–Au/chitosan/GCE was applied to perform real-time monitoring of H2O2 released from SP2/0 cells. fMLP was selected as a stimulant for the cell to generate H2O2. Fig. 5 shows the amperometric responses of the CAT/MoS2–Au/chitosan/GCE in the presence of about 8.0 × 10⁷ SP2/0 cells suspended in 4 mL 1× PBS solution (pH 7.4) upon the addition of 5 μM fMLP at −0.55 V versus SCE. After the addition of fMLP, a significantly increased current was observed at the CAT/MoS2–Au/chitosan/GCE electrode. The current gradually decreased and reached a plateau after 15 s. The maximum current change was around 44 nA, corresponding to 3.26 μM of H2O2 in cell solution (calculated from the calibration curve in Fig. 3B). The H2O2 released from each cell was estimated to be about 160 amol, which is consistent with previously reported results.16,63–65 The 1× PBS buffer solution without cells (red line in Fig. 5) and 1× PBS buffer solution with cells and catalase (blue line in Fig. 5) were set as controls under the same conditions. No current change was observed, further suggesting that H2O2 was released from cells under the stimulation of fMLP. Fig. S8 (ESI†) shows the corresponding current responses obtained from the amperometric curves shown in Fig. 5. These results demonstrate that the constructed biosensor is sensitive and reliable for intracellular H2O2 detection.Conclusions
A sensitive H2O2 electrochemical biosensor was constructed by immobilizing CAT on the MoS2–Au hybrid modified GCE to monitor the H2O2 released from living cells. The results of FT-IR, UV-Vis and Raman spectral characterizations indicate that the immobilized CAT molecule retains its native structure and bioactivity. Direct electrochemical results show that on the MoS2–Au hybrid electrode, CAT exhibits a surface controlled and fast electron transfer process towards H2O2 reduction. All the above results suggest that the MoS2–Au hybrid has a large surface area for the adsorption of enzyme and provides an excellent matrix for accelerating DET between the enzyme and electrode. The constructed H2O2 biosensor shows high performance, such as a wide linear range from 5 × 10⁻⁷ M to 2 × 10⁻⁴ M, a high sensitivity (187.4 mA M−1 cm−2) and a low detection limit (1 × 10⁻⁷ M). Furthermore, the biosensor was applied to achieve the real-time determination of a trace amount of H2O2 released from SP2/0 cells, indicating that the MoS2–Au hybrid is an attractive material for application in the efficient immobilization of biomolecules and the construction of high-performance biosensors.Acknowledgements
We gratefully acknowledge the financial support from the NSFC (No. 21275124, 21275125, 21575124 and 21675140), Postdoctoral Science Foundation of China (2016M601897), Jiangsu Planned Projects for Postdoctoral Research Funds (1601075C), Natural Science Research Projects of Jiangsu Higher Education (16KJB150044), PAPD of Jiangsu Higher Education Institutions, Fund of Yangzhou City of Environmental Protection Bureau (YHK1409, and YHK1410), Graduate Innovation Project Foundation of Jiangsu province (KYLX 1333 and KYLX 1334), the high-end talent project of Yangzhou University.Notes and references
- H. Barry, Am. J. Med., 1991, 91, S14–S22 CrossRef.
- S. Rajagopalan, X. P. Meng, S. Ramasamy, D. G. Harrison and Z. S. Galis, J. Clin. Invest., 1996, 98, 2572 CrossRef CAS PubMed.
- K. Apel and H. Hirt, Annu. Rev. Plant Biol., 2004, 55, 373–399 CrossRef CAS PubMed.
- T. J. Preston, W. J. Muller and G. Singh, J. Biol. Chem., 2001, 276, 9558–9564 CrossRef CAS PubMed.
- G. Miller, K. Schlauch, R. Tam, D. Cortes, M. A. Torres, V. Shulaev, J. L. Dangl and R. Mittler, Sci. Signaling, 2009, 2, ra45 Search PubMed.
- R. S. Arnold, J. Shi, E. Murad, A. M. Whalen, C. Q. Sun, R. Polavarapu, S. Parthasarathy, J. A. Petros and J. D. Lambeth, Proc. Natl. Acad. Sci. U. S. A., 2001, 98, 5550–5555 CrossRef CAS PubMed.
- G. J. DeYulia, J. M. Cárcamo, O. Bórquez-Ojeda, C. C. Shelton and D. W. Golde, Proc. Natl. Acad. Sci. U. S. A., 2005, 102, 5044–5049 CrossRef CAS PubMed.
- B. C. Dickinson and C. J. Chang, J. Am. Chem. Soc., 2008, 130, 9638–9639 CrossRef CAS PubMed.
- F. Wen, Y. Dong, L. Feng, S. Wang, S. Zhang and X. Zhang, Anal. Chem., 2011, 83, 1193–1196 CrossRef CAS PubMed.
- E. W. Miller, A. E. Albers, A. Pralle, E. Y. Isacoff and C. J. Chang, J. Am. Chem. Soc., 2005, 127, 16652–16659 CrossRef CAS PubMed.
- A. Tahirović, A. Čopra, E. Omanović-Mikličanin and K. Kalcher, Talanta, 2007, 72, 1378–1385 CrossRef PubMed.
- C. K. Lim, Y. D. Lee, J. Na, J. M. Oh, S. Her, K. Kim, K. Choi, S. Kim and I. C. Kwon, Adv. Funct. Mater., 2010, 20, 2644–2648 CrossRef CAS.
- C. Li, H. Zhang, P. Wu, Z. Gong, G. Xu and C. Cai, Analyst, 2011, 136, 1116–1123 RSC.
- P. Wu, Z. Cai, J. Chen, H. Zhang and C. Cai, Biosens. Bioelectron., 2011, 26, 4012–4017 CrossRef CAS PubMed.
- A. I. Gopalan, S. Komathi, G. Sai Anand and K.-P. Lee, Biosens. Bioelectron., 2013, 46, 136–141 CrossRef CAS PubMed.
- X. Sun, S. Guo, Y. Liu and S. Sun, Nano Lett., 2012, 12, 4859–4863 CrossRef CAS PubMed.
- Y. Xin, X. Fu-bing, L. Hong-wei, W. Feng, C. Di-zhao and W. Zhao-yang, Electrochim. Acta, 2013, 109, 750–755 CrossRef CAS.
- F. Ai, H. Chen, S.-H. Zhang, S.-Y. Liu, F. Wei, X.-Y. Dong, J.-K. Cheng and W.-H. Huang, Anal. Chem., 2009, 81, 8453–8458 CrossRef CAS PubMed.
- C. Amatore, S. Arbault, M. Guille and F. Lemaître, Chem. Rev., 2008, 108, 2585–2621 CrossRef CAS PubMed.
- C. X. Guo, X. T. Zheng, Z. S. Lu, X. W. Lou and C. M. Li, Adv. Mater., 2010, 22, 5164–5167 CrossRef CAS PubMed.
- Y. Wang, J.-M. Noel, J. Velmurugan, W. Nogala, M. V. Mirkin, C. Lu, M. G. Collignon, F. Lemaitre and C. Amatore, Proc. Natl. Acad. Sci. U. S. A., 2012, 109, 11534–11539 CrossRef CAS PubMed.
- C. Xiao, Y.-L. Liu, J.-Q. Xu, S.-W. Lv, S. Guo and W.-H. Huang, Analyst, 2015, 140, 3753–3758 RSC.
- C. Mu, Q. Zhao, D. Xu, Q. Zhuang and Y. Shao, J. Phys. Chem. B, 2007, 111, 1491–1495 CrossRef CAS PubMed.
- Z. J. Yang, Y. Tang, J. Li, Y. C. Zhang and X. Y. Hu, Biosens. Bioelectron., 2014, 54, 528–533 CrossRef CAS PubMed.
- I. M. Feigel, H. Vedala and A. Star, J. Mater. Chem., 2011, 21, 8940–8954 RSC.
- Q. Xu, L. J. Cai, H. J. Zhao, J. Q. Tang, Y. Y. Shen, X. Y. Hu and H. B. Zeng, Biosens. Bioelectron., 2015, 63, 294–300 CrossRef CAS PubMed.
- H. Y. Liu and N. F. Hu, J. Phys. Chem. B, 2005, 109, 10464–10473 CrossRef CAS PubMed.
- A. A. Vertegel, R. W. Siegel and J. S. Dordick, Langmuir, 2004, 20, 6800–6807 CrossRef CAS PubMed.
- I. Lynch and K. A. Dawson, Nano Today, 2008, 3, 40–47 CrossRef CAS.
- P. E. Scopelliti, A. Borgonovo, M. Indrieri, L. Giorgetti, G. Bongiorno, R. Carbone, A. Podesta and P. Milani, PLoS One, 2010, 5, e11862 Search PubMed.
- S. Srivastava, A. Verma, B. L. Frankamp and V. M. Rotello, Adv. Mater., 2005, 17, 617–621 CrossRef CAS.
- F. A. Denis, P. Hanarp, D. S. Sutherland, J. Gold, C. Mustin, P. G. Rouxhet and Y. F. Dufrene, Langmuir, 2002, 18, 819–828 CrossRef CAS.
- Y. Shi, J. Wang, C. Wang, T. T. Zhai, W. J. Bao, J. J. Xu, X. H. Xia and H. Y. Chen, J. Am. Chem. Soc., 2015, 137, 7365–7370 CrossRef CAS PubMed.
- M. A. Lukowski, A. S. Daniel, F. Meng, A. Forticaux, L. S. Li and S. Jin, J. Am. Chem. Soc., 2013, 135, 10274–10277 CrossRef CAS PubMed.
- J. F. Xie, J. J. Zhang, S. Li, F. Grote, X. D. Zhang, H. Zhang, R. X. Wang, Y. Lei, B. C. Pan and Y. Xie, J. Am. Chem. Soc., 2014, 136, 1680 CrossRef CAS.
- T. Y. Wang, D. L. Gao, J. Q. Zhuo, Z. W. Zhu, P. Papakonstantinou, Y. Li and M. X. Li, Chem. – Eur. J., 2013, 19, 11939–11948 CrossRef CAS PubMed.
- T. Y. Wang, R. Z. Zhu, J. Q. Zhuo, Z. W. Zhu, Y. H. Shao and M. X. Li, Anal. Chem., 2014, 86, 12064–12069 CrossRef CAS PubMed.
- T. Y. Wang, H. C. Zhu, J. Q. Zhuo, Z. W. Zhu, P. Papakonstantinou, G. Lubarsky, J. Lin and M. X. Li, Anal. Chem., 2013, 85, 10289–10295 CrossRef CAS PubMed.
- S. X. Wu, Z. Y. Zeng, Q. Y. He, Z. J. Wang, S. J. Wang, Y. P. Du, Z. Y. Yin, X. P. Sun, W. Chen and H. Zhang, Small, 2012, 8, 2264–2270 CrossRef CAS PubMed.
- Z. Y. Yin, B. Chen, M. Bosman, X. H. Cao, J. Z. Chen, B. Zheng and H. Zhang, Small, 2014, 10, 3537–3543 CrossRef CAS PubMed.
- J. S. Miao, W. D. Hu, Y. L. Jing, W. J. Luo, L. Liao, A. L. Pan, S. W. Wu, J. X. Cheng, X. S. Chen and W. Lu, Small, 2015, 11, 2392–2398 CrossRef CAS PubMed.
- B. Nikoobakht and M. A. El-Sayed, Chem. Mater., 2003, 15, 1957–1962 CrossRef CAS.
- W. Ni, X. Kou, Z. Yang and J. Wang, ACS Nano, 2008, 2, 677–686 CrossRef CAS PubMed.
- C. J. Orendorff and C. J. Murphy, J. Phys. Chem. B, 2006, 110, 3990–3994 CrossRef CAS PubMed.
- P. A. Bertrand, Phys. Rev. B: Condens. Matter Mater. Phys., 1991, 44, 5745–5749 CrossRef CAS.
- T. S. Sreeprasad, P. Nguyen, N. Kim and V. Berry, Nano Lett., 2013, 13, 4434–4441 CrossRef CAS PubMed.
- M. Shamsipur, M. Asgari, M. F. Mousavi and R. Davarkhah, Electroanalysis, 2012, 24, 357–367 CrossRef CAS.
- E. Laviron, J. Electroanal. Chem. Interfacial Electrochem., 1979, 101, 19–28 CrossRef CAS.
- K.-J. Huang, D.-J. Niu, X. Liu, Z.-W. Wu, Y. Fan, Y.-F. Chang and Y.-Y. Wu, Electrochim. Acta, 2011, 56, 2947–2953 CrossRef CAS.
- H.-J. Jiang, H. Yang and D. L. Akins, J. Electroanal. Chem., 2008, 623, 181–186 CrossRef CAS.
- A. M. Bond, Modern polarographic methods in analytical chemistry, 1980, vol. 4 Search PubMed.
- H.-Y. Gu, A.-M. Yu and H.-Y. Chen, J. Electroanal. Chem., 2001, 516, 119–126 CrossRef CAS.
- S. Varma and B. Mattiasson, J. Biotechnol., 2005, 119, 172–180 CrossRef CAS PubMed.
- D. L. Scott and E. F. Bowden, Anal. Chem., 1994, 66, 1217–1223 CrossRef CAS.
- S. Mao, Y. Long, W. Li, Y. Tu and A. Deng, Biosens. Bioelectron., 2013, 48, 258–262 CrossRef CAS PubMed.
- X. Zhao, Z. Mai, X. Kang and X. Zou, Biosens. Bioelectron., 2008, 23, 1032–1038 CrossRef CAS PubMed.
- Q. Li, K. Cheng, W. Weng, P. Du and G. Han, J. Mater. Chem., 2012, 22, 9019–9026 RSC.
- Y.-H. Wang, C.-M. Yu, Z.-Q. Pan, Y.-F. Wang, J.-W. Guo and H.-Y. Gu, Microchim. Acta, 2013, 180, 659–667 CrossRef CAS.
- S. Xu, X. Qin, X. Zhang and C. Zhang, Microchim. Acta, 2015, 182, 1241–1246 CrossRef CAS.
- X. Q. Liu, H. Q. Feng, J. M. Zhang, R. X. Zhao, X. H. Liu and D. K. Y. Wong, Biosens. Bioelectron., 2012, 32, 188–194 CrossRef CAS PubMed.
- Y. Wang, X. L. Ma, Y. Wen, Y. Y. Xing, Z. R. Zhang and H. F. Yang, Biosens. Bioelectron., 2010, 25, 2442–2446 CrossRef CAS PubMed.
- A. T. Ezhil Vilian, S.-M. Chen and B.-S. Lou, Biosens. Bioelectron., 2014, 61, 639–647 CrossRef CAS PubMed.
- Y. Zhang, X. Bai, X. Wang, K.-K. Shiu, Y. Zhu and H. Jiang, Anal. Chem., 2014, 86, 9459–9465 CrossRef CAS PubMed.
- Y. Zhang, C. Wu, X. Zhou, X. Wu, Y. Yang, H. Wu, S. Guo and J. Zhang, Nanoscale, 2013, 5, 1816–1819 RSC.
- C. Yu, Z. Zhu, Q. Wang, W. Gu, N. Bao and H. Gu, Chem. Commun., 2014, 50, 7329–7331 RSC.
Footnote |
| † Electronic supplementary information (ESI) available. See DOI: 10.1039/c6tb02886a |
| This journal is © The Royal Society of Chemistry 2017 |

