Enhanced green fluorescence protein/layered double hydroxide composite ultrathin films: bio-hybrid assembly and potential application as a fluorescent biosensor†
Received
9th October 2016
, Accepted 19th November 2016
First published on 21st November 2016
Abstract
Protein immobilization is of significant interest for applications in biosensing, drug delivery and bioconversion, and challenges still remain for the in vitro immobilization and application of proteins. Due to it being non-specific to species, easy to express in cells and able to exhibit fluorescence after expression without the need for cofactors or chaperones, green fluorescent protein (GFP), together with its differently colored mutants, has been widely studied and applied. This article reports the fabrication of enhanced green fluorescent protein (EGFP)/layered double hydroxide nanosheet (EGFP/LDH)n ultrathin films (UTFs) via a layer-by-layer assembly technique based on electrostatic and hydrogen-bond interactions, and this realized the immobilization of EGFP. The obtained UTFs show a long-range-ordered periodic layered stacking structure and strong fluorescence originating from EGFP, which also retains its predominant β-barrel structure well in the LDH laminates. The inorganic LDH laminates play an important role in protecting and improving the structure and properties of the EGFP in the UTFs. Furthermore, the UTFs exhibit a reversible fluorescence response between different pH environments or different wet or dry environments, and also could detect some small biological medicine molecules such as protoporphyrin, and thus they have the potential to be a novel type of biological fluorescence sensor.
1. Introduction
Proteins, which are one of the elemental bases of living organisms, play important roles in processes that are essential for life, and also are widely used in medicine and biotechnology. Protein immobilization is of significant interest for applications in biosensing, drug delivery and bioconversion due to proteins’ exquisite biological functions, and challenges still remain in their in vitro immobilization and application due to their vulnerable and sophisticated 3D structures. In the past two decades, green fluorescent protein (GFP), together with its different mutants, has been widely studied and applied.1–3 The GFP from the jellyfish Aequorea victoria is a bioluminescent protein consisting of 238 amino acids, with a molecular weight of 27 kDa and a β-barrel structure that consists of 11 β-sheet strands, an α-helix inside and short helical segments on the barrel end (Scheme 1).4,5 GFP emits bright green fluorescence with a peak at 509 nm upon exposure to ultraviolet or blue light, and the fluorophore is encapsulated in the barrel center. Due to it being non-specific to species, easy to express in cells and able to attain fluorescence after expression without the need for cofactors or chaperones, GFP has been widely applied in life science research as a fluorescence marker.6–8 However, there are still many problems in the research and application of fluorescent proteins. Firstly, a clear understanding of the structure–function relationships of fluorescent proteins (FPs) remains elusive.2 Secondly, genetically encoded fluorescent proteins are easily expressed in living cells, but they are usually photolabile compared to organic fluorescent dyes and fluorescent nanoparticles,8 which greatly limits their widespread application. Thirdly, some fluorescent proteins easily form dimers or tetramers,9 which makes them more complex in their function applications. Recently, the entrapment of FPs with different matrices was reported, which provided further insight into the structure and application of FPs. Kharlampieva10 reported a nanostructured protein–polyelectrolyte film obtained through the localized incorporation of GFP within poly(styrene sulfonate)/poly(allylamine hydrochloride) matrices. This was assembled via a spin-assisted layer-by-layer method, and the architecture of the films both in the vertical and lateral directions was deduced, which provided a remarkable example of nanoscopically-controlled protein localization inside polymeric materials. Cao11 reported a facile method to encapsulate His-tagged FPs using biocompatible silica nanoparticles and used it to form a robust and safe fluorescent probe to detect Ca2+. Kameta12 described asymmetric amphiphilic nanotube hydrogel encapsulated FPs, where the nanotube could be an artificial chaperone for the encapsulated proteins and assist in refolding of the encapsulated proteins and release/recovery of the refolded proteins without the addition of specific agents. Therefore, the immobilization of FP is of great significance, however, there are still certain limitations for study of the wide applications of FPs.
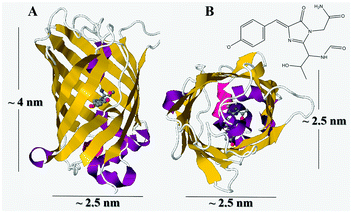 |
| | Scheme 1 (A) “Side view” and (B) “top view” of the three-dimensional structure of EGFP (PDB code: 2Y0G), and inset: the molecule structure of its chromophore. The secondary structure of the protein is in a different color: β-strands in yellow, α-helices in violet and loops in white. The chromophore in the interior of the protein is shown as a mesh surface, with carbon atoms in grey, nitrogen atoms in blue and oxygen atoms in red; the phenolic hydroxyl group is located near the surface of the protein. | |
Layered double hydroxides (LDHs) are a large class of layered inorganic solid solution materials that can be described by the general formula [MII1−xMIIIx(OH)2]z+Az/nn−·yH2O (MII and MIII are divalent and trivalent metals respectively; An− is the anion).13,14 The synthesis and intercalation assembly of LDHs, especially the preparation and the development of assembled films based on LDHs, has attracted widespread interest and attention within research in the field of functional materials.15 As a typical anionic inorganic layered material, LDH crystallites can be exfoliated into nanosheets due to their facile swelling characteristics in organic solvents,16–18 and this provides the building blocks for the construction of multifunctional composite ultrathin film (UTF) materials. The LDH nanosheets are transparent, biocompatible and visible-light proof,19,20 therefore LDHs can be used as molecular containers to stabilize and immobilize biological molecules within the interlayer spaces. Recently, research about biological molecules intercalated using LDHs has drawn more and more attention, and many biological materials including enzymes, amino acids and proteins,21,22 bacteria,23 DNA and nucleotides24 and so on have been intercalated into LDH interlayers and displayed novel functions.
In this work, we chose enhanced green fluorescent protein (EGFP) (PDB code: 2Y0G, Scheme 1) to assemble with LDH nanosheets through a layer by layer technique and successfully formed (EGFP/LDH)n UTFs, to achieve the immobilization of EGFP. The structure and properties of the UTFs were studied, and it was found that the (EGFP/LDH)n UTFs showed a long-range-ordered stacking structure, and retained the well-defined 3D structure and fluorescence properties originating from EGFP. Furthermore, the (EGFP/LDH)n UTFs exhibited a reversible fluorescence response between different pH environments (4–8), and significantly different fluorescence intensities for wet and dry environments, which was useful in order to further study the effect of H2O molecules on the fluorescence of EGFP. Furthermore, the UTFs could detect some small biological medicine molecules such as protoporphyrin. Therefore, the (EGFP/LDH)n UTFs have the potential to be a novel type of biological sensor.
2. Materials and methods
2.1 Materials
Enhanced green fluorescent protein (EGFP) (>90% as determined by SDS-PAGE, pI = 5.99. The recombinant Aequorea victoria GFP consists of 253 amino acids and has a calculated molecular mass of 28.7 kDa. It migrates as a 35 kDa band in SDS-PAGE under reducing conditions as predicted. Its sequence is shown in the ESI.†) was purchased from Shanghai Integrated Biotech Solutions Co. Ltd. Analytical grade NaOH, Mg(NO3)2·6H2O, Al(NO3)3·9H2O, ethanol, NH3·H2O, H2O2, H2SO4, NaH2PO4, Na2HPO4 and NaCl were purchased from Beijing Chemical Co. Ltd. Protoporphyrin was purchased from Shanghai Aladdin biochemical Technology Co. Ltd. All of these reagents were used without further purification. Deionized and decarbonated water was used throughout the experimental process. Ultrapure water was made using the Ultra-pure Water Purifier from Rephile Bioscience Co. Ltd.
2.2 Synthesis of the LDH colloidal suspension
A colloidal LDH suspension was prepared according to the separate nucleation and aging steps (SNAS) method as reported previously.25 Solution A: Mg(NO3)2·6H2O (0.06 mol) and Al(NO3)3·9H2O (0.03 mol) were dissolved in 70 mL of deionized and decarbonated water. Solution B: NaOH (0.18 mol) was dissolved in 80 mL of deionized and decarbonated water. Solution A and solution B were simultaneously added to a colloid mill and mixed for 1 min using a rotor speed of 3000 rpm. The resulting slurry was removed from the colloid mill and sealed in a Teflon-lined stainless steel autoclave, purged with a nitrogen atmosphere and heated at 100 °C for 24 hours. The product was washed three times with 200 mL of deionized and decarbonated water every time, and a stable homogeneous MgAl–LDH suspension with a narrow size distribution was obtained when the product was centrifuged four times. The rest of the colloidal product was dried and ground for structure characterization. Then the MgAl–LDH suspension was treated for two hours via ultrasonication and the concentration of the LDH colloidal particles was adjusted to 1 g L−1 for fabrication of the UTF materials.
2.3 Preparation of (EGFP/LDH)n UTFs
Quartz glass substrates were cleaned in a mixed solution of concentrated H2SO4/30% H2O2 (vol![[thin space (1/6-em)]](https://www.rsc.org/images/entities/char_2009.gif) :vol = 7:3) for 30 min and then washed with anhydrous alcohol and deionized water thoroughly. The quartz glass substrate was immersed in the LDH colloidal suspension (1 g L−1) for 15 min followed by washing with deionized water and drying under a nitrogen gas flow at room temperature. Then the substrate was immersed in the EGFP solution (10 mg L−1, pH = 8) for 15 min, washed several times with deionized water and dried under a nitrogen gas flow for 2 min at room temperature. The (EGFP/LDH)n UTFs were fabricated through alternate deposition of the LDH colloidal suspension and the EGFP solution for n cycles, and after every deposition the UTFs were washed several times with deionized water and dried under a nitrogen gas flow for 2 min at room temperature.
:vol = 7:3) for 30 min and then washed with anhydrous alcohol and deionized water thoroughly. The quartz glass substrate was immersed in the LDH colloidal suspension (1 g L−1) for 15 min followed by washing with deionized water and drying under a nitrogen gas flow at room temperature. Then the substrate was immersed in the EGFP solution (10 mg L−1, pH = 8) for 15 min, washed several times with deionized water and dried under a nitrogen gas flow for 2 min at room temperature. The (EGFP/LDH)n UTFs were fabricated through alternate deposition of the LDH colloidal suspension and the EGFP solution for n cycles, and after every deposition the UTFs were washed several times with deionized water and dried under a nitrogen gas flow for 2 min at room temperature.
2.4 Characterization
UV-vis absorption spectra were collected using a Shimadzu U-3600 spectrophotometer with a slit width of 1.0 nm. Circular dichroism (CD) spectra were recorded using a JASCO J-815 circular dichroism spectrometer with a slit width of 1.0 nm. Fluorescence spectra were obtained using a Hitachi F-4600 fluorospectrophotometer under identical conditions. Powder X-ray diffraction (XRD) pattern measurement was performed using a Rigaku XRD-6000 diffractometer with Cu Kα radiation (λ = 1.541844 Å, 2θ = 3–80°) at 40 kV and 30 mA, with a scanning rate of 10.00° min−1. Small-angle XRD patterns of the film were obtained using a Rigaku 2500VB2+ PC diffractometer with Cu Kα radiation (λ = 1.541844 Å, 2θ = 0.5–8°) at 40 kV and 50 mA, with the step-scanned mode in 0.04° (2θ) per step and a count time of 10 s per step. A scanning electron microscope (SEM Zeiss Supra 55) was used to investigate the morphology of the UTFs. Atomic force microscope (AFM) software (Digital Instruments, Version 6.12) was used to obtain surface roughness data. Dynamic light scattering (DLS) diameter measurement was conducted using photon correlation spectroscopy (PCS, Nanosizer Nano ZS, MALVERN Instruments). A vacuum freeze drying plant was used to dry the UTFs.
3. Results and discussion
3.1 Preparation of the LDH colloidal suspension
Traditionally, LDH nanosheets used for assembly with guest molecules have been obtained through organic solvent delamination.15–18,24 In this study, the LDH nanosheets were prepared through the SANS method as reported previously,25 and the obtained LDH nanosheets were dispersed in pure water, which avoided traditional organic solvents damaging the activity of biomacromolecules. The XRD pattern of the dry Mg2Al–NO3 LDH powder is shown in Fig. 1A, and it was found that d003 and d006 present a good multiple relationship for the basal and second-order reflections. The 003 reflection of the Mg2Al–NO3 LDH appears at 2θ = 10° with an interlayer distance of 8.81 Å, which is consistent with that of NO3–LDH reported in the literature,26 confirming the intercalation of nitrate. The SEM image (Fig. 1A inset) shows a nanoplate LDH morphology with a diameter ranging from 80–150 nm and a thickness of about 10 nm. Moreover, the lateral size of the LDH in the colloidal suspension was determined to be 105 nm (Fig. 1B). The LDH colloidal suspension showed an obvious Tyndall effect (Fig. 1B inset), which further confirmed the colloidal nature of the LDH nanosheets.
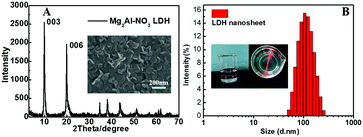 |
| | Fig. 1 Structure and morphology characterization of the Mg2Al–NO3 LDH: (A) XRD pattern and SEM image (inset) and (B) particle size distribution of the LDH nanosheets as determined using DLS, where the inset is the LDH nanosheet colloidal suspension showing the Tyndall effect. | |
3.2 The assembly of (EGFP/LDH)n UTFs
Green fluorescent protein (GFP) is a water soluble biomacromolecule, that is charged negatively under appropriate pH conditions and has some polar groups (–COOH, –NH) attached, and these are all features conducive to its assembly with LDH nanosheets through electrostatic interaction and hydrogen-bond interaction. The assembly process of the (EGFP/LDH)n UTFs deposited on quartz substrates was similar to the ordinary electrostatic assembly of small anions with LDH nanosheets, except that the LDH nanosheets were prepared through the SNAS method, and the assembly process was monitored using UV-vis absorption spectra (Fig. 2A) and fluorescence spectra (Fig. 2B). The absorption intensities of the bands at 490, 279 and 195 nm correlate nearly linearly with the number of bilayers n (Fig. 2A inset), indicating that the UTFs were LbL linearly grown. The absorption bands at 490 and 279 nm of the UTFs are attributed to the characteristic absorption of EGFP, and the absorption band at 195 nm of the (EGFP/LDH)n UTFs may be attributed to both EGFP and LDH, which corresponds to the pristine EGFP solution and LDH colloidal suspension (Fig. S1A and S5, ESI†). The intensity of the sharp luminescence peak with a maximum at 509 nm of the (EGFP/LDH)n (n = 5–25) UTFs also displays a monotonic increase with n, as shown in Fig. 1B, which further suggests a stepwise and regular deposition procedure with almost equal amounts of EGFP and LDH incorporated in each cycle. The fluorescence emission wavelength of the (EGFP/LDH)n UTFs was similar to that of the original EGFP solution (Fig. S1B, ESI†), suggesting the absence of aggregates of EGFP in the (EGFP/LDH)n UTFs throughout the whole assembly. The absorption and fluorescence spectra indicated the successful assembly of EGFP with LDH nanosheets on the quartz substrate and regular growth during the assembly process, and the error bars are based on three groups of films prepared under the same conditions, which showed that the film preparation displayed good reproducibility. The small angle XRD pattern shows a sharp Bragg peak at 2θ = 0.68° for (EGFP/LDH)50 UTFs (Fig. 2C), indicating an ordered periodical structure, perpendicular to the substrate with a period length of 12.98 nm.
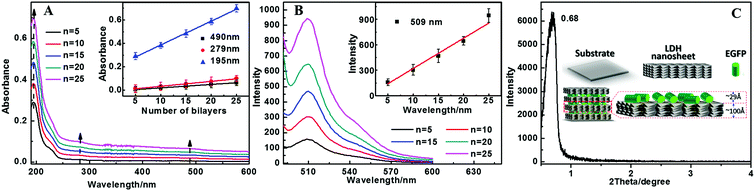 |
| | Fig. 2 (A) Absorption spectra of (EGFP/LDH)n (n = 5–25) UTFs, and inset: a plot of the absorbance vs. n at 490, 279 and 195 nm of the UTFs. (B) Fluorescence spectra of (EGFP/LDH)n (n = 5–25, λex = 480 nm) UTFs, and inset: a plot of the fluorescence intensity vs. n at 509 nm of the UTFs. (C) Small-angle XRD pattern of the (EGFP/LDHs)40 UTF, and inset: schematic illustration of the layer structure and bilayer structure of the (EGFP/LDH)n UTF. The error bars are based on three films prepared under the same conditions. | |
3.3 Morphology and structure characterization of the (EGFP/LDH)n UTFs
The CD spectrum measurements were used to characterize the secondary structure of the embedded EGFP in the (EGFP/LDH)n UTFs. Fig. 3B shows the CD spectra of (EGFP/LDH)n (n = 5–25) UTFs. The strong negative band at 216 nm and the positive band at 195 nm, corresponding to the EGFP solution (Fig. 3A), indicate that the predominant β-barrel structure of the EGFP in solution was preserved in the (EGFP/LDH)n UTFs.
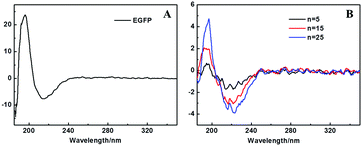 |
| | Fig. 3 CD spectra of (A) the EGFP solution (0.1 mg mL−1) and (B) the (EGFP/LDH)n (n = 5–25) UTFs. | |
The SEM and AFM measurements were used to explore the surface morphology and the thickness of the (EGFP/LDH)n UTFs. The top-view SEM image (Fig. 4A) shows that the film surface is microscopically continuous and homogenous and the surface roughness of the UTFs increases with the bilayer number n (Fig. S3A, ESI†). The side view SEM images (Fig. 4B and Fig. S3B, ESI†) show that the thickness of the (EGFP/LDH)n UTFs approximately linearly increases upon increasing the bilayer number n, and the average thickness of one bilayer of the (EGFP/LDH)1 UTF can be estimated to be 12.6 nm (Fig. 4B and Fig. S2B, ESI†), which is approximately close to the basal spacing observed using small-angle XRD (ca. 12.98 nm) (Fig. 2C). This further confirms that the (EGFP/LDH)n UTFs present a uniform and periodic layered structure, which is in agreement with the properties revealed by the absorption and fluorescence spectra above. The top view AFM images (Fig. 4C and D) show that the surface of the UTFs is uniform, and the root mean square (RMS) roughness increases with the increasing bilayer number of (EGFP/LDH)n (Fig. S2C, ESI†). These results imply that the LbL assembly based on electrostatic interaction and hydrogen-bond interaction between EGFP and LDH nanosheets can preserve the β-barrel structure of the protein and retain the integrality of UTFs. Moreover, the surface morphology remains homogenous and continuous and the bilayer number n can be increased up to at least 40.
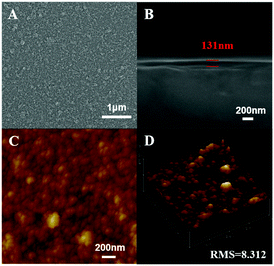 |
| | Fig. 4 Morphology characterization of the (EGFP/LDH)10 UTF: (A) top-view SEM image, (B) side-view SEM image, and (C) and (D) tapping-mode AFM images. | |
3.4 Thickness of the (EGFP/LDH)n UTFs
Generally, GFP is an almost perfect cylinder that is about 2.5 nm in diameter and 4 nm in height.1 In these EGFP/LDH UTFs the bilayer thickness is about 12.9 nm, derived from small angle XRD data, and the thickness of the LDH nanosheet is about 10 nm, thus the thickness of the EGFP layer is about 2.9 nm, illustrating that the EGFP forms a molecular monolayer upon adsorption (Fig. 2C inset). Moreover, it's worth noting that the thickness of the EGFP layer is less than the height of EGFP, but greater than the diameter of EGFP, so it can be speculated that the EGFP in the LDH laminates of the UTF is mostly lying on the LDH laminates rather than standing on them, as shown in the inset of Fig. 2C. This phenomenon can likely be attributed to the fact that the periphery of the EGFP β-barrel has lots of polar amino acid residues or dangling negative charges, and it is easy to form stable electrostatic and hydrogen-bond interactions between the side surface of the EGFP β-barrel and the LDH laminates.
3.5 Reversible pH detection with the (EGFP/LDH)n UTFs
The chromophore of EGFP is based on a phenyl ring and imidazole ring linked by a double bond that is derived from the tyrosine–glycine dipeptide, which can exist in an anionic or neutral state. Therefore, the environmental pH value can affect the chromophore and fluorescence properties of EGFP. Meanwhile the properties of LDH are stable under an environment of pH = 4–10, and thus the EGFP/LDH UTF can be used as a pH sensor in theory. Experimentally, these (EGFP/LDH)n UTFs exhibit a significantly different fluorescence intensity in different solution pH values. Taking the (EGFP/LDH)20 UTF as an example, the UTF displays the strongest fluorescence intensity under pH = 8, and it decreases upon decreasing the pH value (Fig. 5A). Moreover, the UTF displays a reversible fluorescence response between pH = 8 and pH = 4 (Fig. 5B), and after five cycles of alternate treatment with pH = 4 solution and pH = 8 solution, it still presents strong fluorescence emission, confirming the reusability of the (EGFP/LDH)n UTF, which indicates that this film has the potential to be a pH sensor in vitro. However there is a slight progressive decrease of the fluorescence intensity upon cycling, which may be due to the fact that EGFP in the UTF was protonated under the acidic conditions, but we cannot make it recover absolutely in the actual experiments. This may require some special skills for the experiments, and this is a challenge for us to work out in the future.
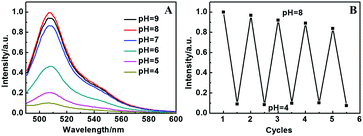 |
| | Fig. 5 (A) Fluorescence emission spectra of the (EGFP/LDH)20 UTF in solutions of different pHs (4–9), normalized against the initial fluorescence intensity value at pH = 8, λex = 480 nm; (B) the reversible fluorescence response over five consecutive cycles between pH = 8 and pH = 4. | |
To further understand the influence of pH value on the fluorescence properties of the (EGFP/LDH)n UTFs, the optical absorbance of EGFP at different pH values was measured. It was found that there are three main absorbance bands of EGFP at different pH values (Fig. S3, ESI†): the characteristic absorption of the protein at about 279 nm, the neutral protonated EGFP absorption at about 395 nm and the deprotonated anion absorption at about 490 nm. Obviously the characteristic absorption peak at about 279 nm does not change with the different pH values, but the 395 nm absorption disappears gradually and the 490 nm absorption appears gradually with the increasing pH value, indicating that the pH value can influence the protonation state of the EGFP and its chromophore. This result is in accordance with the general rule that only the anionic state is fluorescent, and protonation of the chromophore quenches fluorescence in most fluorescent proteins.1,2
3.6 Reversible fluorescence response of the (EGFP/LDH)n UTFs for wet and dry environments
It was reported that the chromophore located at the center of the β-barrel engaged in a wide range of interactions, such as hydrogen bonding27,28 and charge29 or stacking interactions,30 with surrounding amino acids and possibly highly ordered water molecules observed in the crystalline structures, forming an intrinsic part of an interaction network that encompasses the entire protein.2 The water molecules may have a remarkable influence on the properties of the EGFP chromophore. Therefore we studied the fluorescence properties of (EGFP/LDH)n UTFs in different environments. It was found that the (EGFP/LDH)n UTFs displayed different fluorescence intensities in air and water, and after low-temperature vacuum drying (Fig. 6). They exhibited the strongest fluorescence intensity in the wet environment (in water) and the intensity was significantly reduced after low-temperature vacuum drying for one hour. In addition, the fluorescence intensity can be recovered in water after low-temperature vacuum drying, and even after five cycles of alternate treatments with low-temperature vacuum drying and room temperature placement (more than one hour) the film still presents strong fluorescence emission (Fig. 6B). This confirms the reusability of the (EGFP/LDH)n UTF for wet and dry environments, which means that this film can be a kind of fluorescence sensor for wet or dry environments.
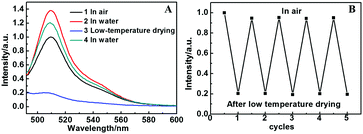 |
| | Fig. 6 (A) Fluorescence spectra of the (EGFP/LDH)20 UTF in different environments, normalized against the initial fluorescence intensity value in air, λex = 480 nm. (B) The reversible fluorescence response over five consecutive cycles in air and after low-temperature drying. | |
Furthermore, the water molecules in the LDH laminates may play an important role in the EGFP. There are many water molecules on the surface of the LDH nanosheets and these water molecules are relatively stable, which means that they will not be removed under high temperature conditions (more than 100 °C). This provides a hydrophilic environment for the EGFP molecules in the interlayers of the (EGFP/LDH)n UTF and protects the fluorescence properties of these EGFP molecules. Compared with the solution of only EGFP, whose fluorescence was almost quenched at 80 °C, the (EGFP/LDH)n UTF retained about 20% of its fluorescence at 80 °C and was only quenched when the temperature got to 90 °C (Fig. 7). The (EGFP/LDH)n UTF displayed a higher thermal stability compared to the solution of only EGFP on the whole, which may be due to the existence of the LDH nanosheets and stable water molecules within the interlayer spaces.
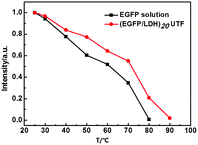 |
| | Fig. 7 Decay of the normalized maximal fluorescence intensity with temperature, normalized against the initial fluorescence intensity value; λex = 480 nm was used to compare the thermal stability of the EGFP solution (10 μg mL−1) and the (EGFP/LDHs)20 UTF. | |
3.7 Reversible fluorescence response of the (EGFP/LDH)n UTFs for protoporphyrin
The EGFP/LDH UTFs can also exhibit a fluorescence response to some biological drug molecules. As an example of a bioactive small molecule, protoporphyrin is the main ingredient of hemoglobin, which is critically important in oxygen transportation-associated energy metabolism and various inflammatory lesions.31,32 At the same time, protoporphyrin has played a significant role in the biological and photophysical field due to the special optical properties from its extended electronic π-conjugated macrocyclic structure.33,34 Taking the (EGFP/LDH)10 UTF as an example, the film exhibited a significant decrease in fluorescence intensity upon increasing the protoporphyrin concentration. Fig. 8 shows the fluorescence emission of the UTF in protoporphyrin solutions with different concentrations (0–22 μg mL−1), and a linear relationship between the fluorescence intensity of the UTF and the protoporphyrin concentration is shown (I = 411.35–16.64C (μg mL−1), r2 = 0.996) (Fig. 8B). Furthermore, the UTFs displayed a reversible fluorescence response between protoporphyrin (22 μg mL−1, pH = 7) and pure water (Fig. 8C) and after five cycles of alternate treatment with protoporphyrin solution and pure water, the film still presents strong fluorescence emission, confirming the reusability of the (EGFP/LDH)n UTF for detecting protoporphyrin, which indicates that these UTFs can be a novel type of biological sensor.
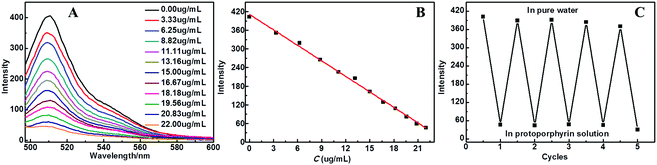 |
| | Fig. 8 (A) Fluorescence spectra of the (EGFP/LDH)10 UTF in different protoporphyrin concentrations (pH = 7), (B) plot of the fluorescence intensity at 509 nm versus the corresponding protoporphyrin concentration and (C) the reversible fluorescence response over five consecutive cycles of alternate treatment with pure water and protoporphyrin solution (22 μg mL−1, pH = 7). | |
To understand the detection mechanism of the (EGFP/LDH)n UTF for protoporphyrin, the absorption of protoporphyrin was measured (Fig. S5, ESI†). It was speculated that the mechanism was an inner-filter effect (IFE) on the fluorescence of the (EGFP/LDH)n UTF by the protoporphyrin molecules. The IFE refers to a phenomenon of fluorescence quenching resulting from the absorption of the excitation and/or emission light of fluorophores by absorbers in the detection system.35,36 Compared to conventional fluorescence resonance energy transfer-based fluorescence methods, IFE does not require a chemical linkage between the absorber and fluorophore and it has been applied for various analytes’ detection.37,38 In this system, the (EGFP/LDH)n UTFs were used as fluorescent sensors and the protoporphyrin was used as a fluorescence quencher. Because the absorption of protoporphyrin is in a relatively wide range (300–540 nm), which almost includes the excitation and emission wavelengths of the UTF, it is possible for this to be explained by the IFE between the UTF and protoporphyrin. The fluorescence intensity of the UTFs was greatly quenched with the increasing protoporphyrin, which further supported the fact that this quenching was based on IFE.
4. Conclusion
In summary, the alternate assembly of EGFP biomacromolecules with LDH nanosheets results in ordered stacking to form (EGFP/LDH)n UTFs, which realized the immobilization of EGFP. Inorganic LDH laminates provided a good hydrophilic environment for the EGFP molecules, which made the UTF retain the well-defined structure and fluorescence properties originating from EGFP. It was found that the bilayer thickness of the as-prepared UTFs was about 12.9 nm and the surface roughness of the UTFs increased upon increasing the number of bilayers. The (EGFP/LDH)n UTFs exhibited a reversible fluorescence response between different pH values (4–8), which is due to changes in the protonated states of the EGFP chromophore. At the same time, the (EGFP/LDH)n UTFs have significantly different fluorescence intensities in wet and dry environments, which is useful to further study the effect of water molecules on the fluorescence of EGFP. Furthermore, the UTFs could detect some small biological medicine molecules, such as protoporphyrin, through IFE. Therefore, the (EGFP/LDH)n UTFs have the potential to be a novel type of biological sensor. This work shows great promise for developing advanced bio-hybrid films with well-organized structures and controllable functions, a crucial requirement for advanced sensing applications.
Acknowledgements
This work was supported by the 973 Program (grant no. 2014CB932101), the National Natural Science Foundation of China, 111 Project (grant no. B07004) and Program for Changjiang Scholars and Innovative Research Team in University (IRT 1205) and Central University Research Funds of China (buctrc201527).
References
- S. J. Remington, Protein Sci., 2011, 20, 1509–1519 CrossRef CAS PubMed.
- P. Dedecker, F. C. De Schryver and J. Hofkens, J. Am. Chem. Soc., 2013, 135, 2387–2402 CrossRef CAS PubMed.
- D. M. Chudakov, M. V. Matz, S. Lukyanov and K. A. Lukyanov, Physiol. Rev., 2010, 90, 1103–1163 CrossRef CAS PubMed.
- F. Yang, L. G. Moss and G. N. Phillips, Jr., Nat. Biotechnol., 1996, 14, 1246–1251 CrossRef CAS PubMed.
- M. Ormo, A. B. Cubitt, K. Kallio, L. A. Gross, R. Y. Tsien and S. J. Remington, Science, 1996, 273, 1392–1395 CAS.
- R. H. Newman, M. D. Fosbrink and J. Zhang, Chem. Rev., 2011, 111, 3614–3666 CrossRef CAS PubMed.
- O. Griesbeck, Curr. Opin. Neurobiol., 2004, 14, 636–641 CrossRef CAS PubMed.
- T. Ozawa, H. Yoshimura and S. B. Kim, Anal. Chem., 2013, 85, 590–609 CrossRef CAS PubMed.
- R. Y. Tsien, FEBS Lett., 2005, 579, 927–932 CrossRef CAS PubMed.
- V. Kozlovskaya, J. F. Ankner, H. O'Neill, Q. Zhang and E. Kharlampieva, Soft Matter, 2011, 7, 11453–11463 RSC.
- A. Cao, Z. Ye, Z. Cai, E. Dong, X. Yang, G. Liu, X. Deng, Y. Wang, S. Yang, H. Wang, M. Wu and Y. Liu, Angew. Chem., Int. Ed., 2010, 49, 3022–3025 CrossRef CAS PubMed.
- N. Kameta, M. Masuda and T. Shimizu, ACS Nano, 2012, 6, 5249–5258 CrossRef CAS PubMed.
- G. R. Williams and D. O’Hare, J. Mater. Chem., 2006, 16, 3065–3074 RSC.
- A. M. Fogg, A. J. Freij and G. M. Parkinson, Chem. Mater., 2002, 14, 232–234 CrossRef CAS.
- Q. Wang and D. O'Hare, Chem. Rev., 2012, 12, 4124–4155 CrossRef PubMed.
- M. Adachi-Pagano, C. Forano and J. P. Besse, Chem. Commun., 2000, 91–92 RSC.
- R. Z. Ma and T. Sasaki, Recent Pat. Nanotechnol., 2012, 6, 159–168 CrossRef CAS PubMed.
- L. Li, R. Z. Ma, Y. Ebina, N. Iyi and T. Sasaki, Chem. Mater., 2005, 17, 4386–4391 CrossRef CAS.
- E. Gardner, K. M. Huntoon and T. J. Pinnavaia, Adv. Mater., 2001, 13, 1263–1266 CrossRef CAS.
- S. Li, J. Li, C. J. Wang, Q. Wang, M. Z. Cader, J. Lu, D. G. Evans, X. Duan and D. O'Hare, J. Mater. Chem. B, 2013, 1, 61–68 RSC.
- X. Kong, X. Rao, J. Han, M. Wei and X. Duan, Biosens. Bioelectron., 2010, 26, 549–554 CrossRef CAS PubMed.
- M. Shao, F. Ning, J. Zhao, M. Wei, D. G. Evans and X. Duan, J. Am. Chem. Soc., 2012, 134, 1071–1077 CrossRef CAS PubMed.
- M. Halma, A. Khenifi, M. Sancelme, P. Besse-Hoggan, P.-O. Bussière, V. Prévot and C. Mousty, J. Colloid Interface Sci., 2016, 474, 151–158 CrossRef CAS PubMed.
- W. Y. Shi, Y. K. Jia, S. M. Xu, Z. X. Li, Y. Fu, M. Wei and S. X. Shi, Langmuir, 2014, 30, 12916–12922 CrossRef CAS PubMed.
- Y. Zhao, F. Li, R. Zhang, D. G. Evans and X. Duan, Chem. Mater., 2002, 14, 4286–4291 CrossRef CAS.
- S. Cadars, G. Layrac, C. Gerardin, M. Deschamps, J. R. Yates, D. Tichit and D. Massiot, Chem. Mater., 2011, 23, 2821–2831 CrossRef CAS.
- T. Laino, R. Nifosì and V. Tozzini, Chem. Phys., 2004, 298, 17–28 CrossRef CAS.
- D. Morozov and G. Groenhof, Angew. Chem., Int. Ed., 2016, 55, 576–578 CrossRef CAS PubMed.
- J. N. Henderson and S. J. Remington, Proc. Natl. Acad. Sci. U. S. A., 2005, 102, 12712–12717 CrossRef CAS PubMed.
- X. He, A. Bell and P. Tonge, J. Phys. Chem. B, 2002, 106, 6056–6066 CrossRef CAS.
- Q. Peng, K. Berg, J. Moan, M. Kongshaug and J. M. Nesland, Photochem. Photobiol., 1997, 65, 235–251 CrossRef CAS PubMed.
- M. Wachowska, A. Muchowicz, M. Firczuk, M. Gabrysiak, M. Winiarska, M. Wanczyk, K. Bojarczuk and J. Golab, Molecules, 2011, 16, 4140–4164 CrossRef CAS.
- X. Dong, C. Wei, T. Liu and F. Lv, RSC Adv., 2015, 5, 96336–96344 RSC.
- Y. Xu, L. Wang, X. Zhu and C. Q. Wang, RSC Adv., 2016, 6, 31053–31058 RSC.
- J. W. Li, X. M. Li, X. J. Shi, X. W. He, W. Wei, N. Ma and H. Chen, ACS Appl. Mater. Interfaces, 2013, 5, 9798–9802 CAS.
- S. Yang, C. Wang, C. Liu, Y. Wang, Y. Xiao, J. Li, Y. Li and R. Yang, Anal. Chem., 2014, 86, 7931–7938 CrossRef CAS PubMed.
- L. Shang and S. J. Dong, Anal. Chem., 2009, 81, 1465–1467 CrossRef CAS PubMed.
- Y. M. Zhai, L. H. Jin, P. Wang and S. J. Dong, Chem. Commun., 2011, 47, 8268–8270 RSC.
Footnote |
| † Electronic supplementary information (ESI) available: Sequence of EGFP; absorption spectra and fluorescence spectra of the EGFP solution (pH = 8); morphology characterization of (EGFP/LDH)n UTF: top-view SEM images, side-view SEM images and tapping-mode AFM images; absorption spectra of the EGFP solution with different pHs; absorption spectra of the porphyrin solution. Absorption spectra of the LDH colloidal suspension. See DOI: 10.1039/c6tb02638a |
|
| This journal is © The Royal Society of Chemistry 2017 |


