
 Open Access Article
 This Open Access Article is licensed under a
 Creative Commons Attribution 3.0 Unported Licence
Heteroatom functionalized activated porous biocarbons and their excellent performance for CO2 capture at high pressure†
Gurwinder
Singh
 ab,
In Young
Kim
*a,
Kripal S.
Lakhi
a,
Stalin
Joseph
a,
Prashant
Srivastava
ab,
Ravi
Naidu
*bc and
Ajayan
Vinu
*a
ab,
In Young
Kim
*a,
Kripal S.
Lakhi
a,
Stalin
Joseph
a,
Prashant
Srivastava
ab,
Ravi
Naidu
*bc and
Ajayan
Vinu
*a
aFuture Industries Institute, Division of Information Technology, Engineering and Environment, University of South Australia, Mawson Lakes, South Australia 5095, Australia. E-mail: Ajayan.Vinu@newcastle.edu.au
bCooperative Research Centre for Contamination Assessment and Remediation of the Environment, University of South Australia, Mawson Lakes, South Australia 5095, Australia. E-mail: Ravi.Naidu@newcastle.edu.au
cGlobal Centre for Environmental Remediation (GCER), The University of Newcastle, ATC Building, Callaghan, New South Wales, Australia
First published on 4th September 2017
Abstract
Activated biocarbons with a porous structure and nitrogen functionalities are synthesized from the prolific waste biomass, Arundo donax, and an organic material, chitosan, by a simple one step chemical activation with ZnCl2. The nitrogen functional groups in the porous activated biocarbons are significantly increased by the addition of chitosan in the synthesis mixture. The textural properties and N content can easily be tuned by varying the amount of activating agent and the carbonization temperature. The optimized biocarbon sample was obtained at a fairly low carbonization temperature of 500 °C by employing an impregnation mass ratio of ZnCl2 to Arundo donax/chitosan of 3. This optimized material exhibits the best specific surface area of 1863 m2 g−1, pore volume of 1.0 cm3 g−1 and nitrogen content of 5.4 wt%. The presence of nitrogen functionalities on the materials provides a negatively charged surface which is critical for the adsorption of CO2 molecules which are acidic in nature. The sample shows remarkable adsorption capacities of 18.2 mmol g−1 at 0 °C/30 bar and 13.1 mmol g−1 at 25 °C/30 bar under the conditions corresponding to pre-combustion CO2 capture from flue gas streams. High CO2 adsorption values of 3.6 mmol g−1 at 0 °C/1 bar and 2.1 mmol g−1 at 25 °C/1 bar are also observed under post-combustion CO2 capture conditions of the material. The N-doped activated biocarbon shows an exceptionally high value of isoelectric heat of adsorption (32.2 kJ mol−1), indicating that the surface polarity generated by N dopant plays a crucial role in enhancing interactions between CO2 and porous N-doped activated biocarbons.
1. Introduction
The increasing additions of CO2 produced by anthropogenic sources into the atmosphere have led to alteration in its chemistry, resulting in global warming accompanied by unexpected climate changes all around the world.1 Hence, it becomes highly imperative to focus more towards the research and development for finding potential materials or solutions to tackle this global problem. Carbon capture and storage is regarded as one of the encouraging technologies for reducing CO2 emissions. Conventionally, industrial based CO2 capture is done using a simple absorption technique using aqueous amine solutions, which can absorb a large quantity of CO2 through chemical interactions. However, this process suffers from major drawbacks in terms of enormous energy consumption for the regeneration of sorbent, degradation of the sorbent, equipment corrosion, release of toxic amine vapours, etc.2,3 On the other hand, solid adsorbent based technologies were found to be one of the effective methods for CO2 capture as they have the potential to overcome the drawbacks encountered by the amine based absorption process owing to their high CO2 uptakes, lower energy consumption and non-toxic nature. The adsorbents including zeolites,4 amine modified materials,5 metal–organic frameworks,6 porous polymers,7 carbon nanotubes,8 silicon carbide,9 mesoporous carbon nitrides,10etc. have been widely used for the capture of CO2. However, the long and complex synthetic procedures and expensive chemicals required for their preparation put a major hurdle in their path of commercialization. Therefore, there is an urgent need for designing sophisticated porous sorbents that possess high CO2 adsorption capacities, easy regeneration and high chemical/thermal stability, and most importantly the overall cost of the adsorbents should be low.Among the porous adsorbents, porous carbonaceous materials have been preferred for CO2 capture owing to their enhanced surface chemistry, porous texture, good chemical and thermal stability, hydrophobic nature and physical adsorption mechanism.11–13 Various preparation methods including carbonization of polymers, catalytic activation and soft and hard templating approaches are available for the preparation of these porous carbon materials. These preparation conditions or the nature of the precursors can easily be tuned for varying the surface chemistry of these porous carbon materials. For example, heteroatoms such as nitrogen are doped into the porous carbon matrix as they can offer basic functional groups,14 which are highly favourable for the adsorption of CO2 molecules.15 However, it is a big challenge to devise a combination of both N-doping and a high surface area in the porous carbons. In general, nitrogen can be incorporated into the carbon structure by two methods: by direct carbonization of N-rich precursors such as acrylonitrile/acrylamide,16 polyimine,17 dicyandiamide,18etc. that are incorporated into the porous inorganic templates, or post treatment of the carbonized precursor with chemicals such as NH3 (ref. 19) or C2H3N.20 Although the in situ process generates an orderly distribution of nitrogen in the porous structure, it suffers from the high cost of precursors. Additionally, it requires a significant amount of work involving the preparation of precursors and the templates, incorporation of precursors into the templates, carbonization and subsequent removal of the templates using toxic chemicals such as HF or NaOH.21 On the other hand, the post synthetic treatment process involves a thermal treatment of the carbonized material with ammonia or acetonitrile, which always leads to the structural collapse of the porous carbons leading to the diminished amount of CO2 adsorption and is also accompanied by the release of toxic amine vapours.
These drawbacks can however be overcome by devising a suitable one-step strategy without the use of expensive precursors and templates. Although there have been several reports in the literature on the activation of biomass using ZnCl2,22,23 there have been no reports available on the single step preparation of N-doped porous activated biocarbons. Here, we describe the synthesis of highly porous activated biocarbons with nitrogen functionalities using a low cost natural biomass of Arundo donax and natural organic matter of chitosan, as a source of carbon and nitrogen, respectively, and zinc chloride (ZnCl2) as a mild activating agent through a simple one step dry mixing activation approach. Our one-step activation cum pyrolysis strategy involved a quick and simultaneous carbonization, activation and N-doping in the same vessel using the mixture of natural precursors Arundo donax and chitosan, which resulted in the production of N-doped porous carbons with extremely high surface areas and appreciable amount of N dopant in the structure. The whole process is quite simple and easy to implement in an industrial setup. It has also been demonstrated that the textural parameters of the resultant activated biocarbons can easily be controlled by varying either the carbonization temperature or the amount of the activator, ZnCl2. As such, a complete range of activated porous materials with desired micro or mesoporosity could be obtained which further exhibit significant CO2 adsorption capacities. This is the first instance of using a novel one step dry mixing activation cum pyrolysis approach to synthesize N-doped porous biocarbons where both carbon and nitrogen precursors are relatively inexpensive and come from naturally available biomass Arundo donax and organic matter chitosan.
2. Experimental
2.1 Synthesis of N-doped activated biocarbons
The N-doped activated porous biocarbons were derived from the natural biomass of Arundo donax, and natural organic matter, chitosan (88% deacetylated), by direct chemical activation with ZnCl2 (purchased from Sigma Aldrich). To start with, Arundo donax was milled into a fine powder (particle size < 150 μm) and then the required amount of chitosan and ZnCl2 were added and thoroughly mixed (the mass ratio of the mixture of Arundo donax and chitosan was fixed as 1). Thereafter, the mixture was carbonized under the nitrogen atmosphere in a tubular furnace at a temperature range of 500–700 °C with a residence time of 2 h at the set target temperature. The heating rate of the furnace was maintained at 10 °C min−1. The obtained carbonaceous black powder was washed with hydrochloric acid and deionized water at room temperature to clear away all inorganic residues and was confirmed by the absence of any related peaks in the X-ray diffraction (XRD) measurements. The after-wash materials were oven dried at 100 °C overnight. The obtained N-doped activated biocarbons were denoted as NDABn-T where n = 0–3 which represents the impregnation mass ratio of ZnCl2 to Arundo donax/chitosan whereas T denotes the carbonization temperature (500–700 °C). The weight ratio of Arundo donax/chitosan is always set as 1.2.2 Characterization of N-doped activated biocarbons
The crystalline structure of N-doped activated biocarbons was investigated using powder XRD analysis carried out on a PANalytical Empyrean XRD instrument with Cu Kα radiation (λ = 1.5418 Å) produced at 40 kV and 40 mA. The materials were measured in the 2θ angle range of 10–80° with a step size of 0.06°. A Leco CNS analyzer was used to ascertain the amount of carbon and nitrogen in the activated porous biocarbons. The X-ray photoelectron spectroscopy (XPS) spectra of the biocarbon materials were recorded using a Kratos Axis ULTRA X-ray photoelectron spectrometer. A monochromatic Al Kα X-ray source of incident radiation operating at 225 W (15 kV, 15 mA) was used. The samples were subjected to degassing under vacuum overnight before the measurements. Survey scans were recorded using a pass energy of 160 eV in a binding energy range of 1200–0 eV using 1.0 eV steps with a dwell time of 100 ms. The pass energy was changed to 20 eV while recording the high-resolution spectra. The Zeiss Merlin scanning electron microscope (SEM) was used at 2 kV to record the field emission SEM images. The textural parameters and porosity of the materials were investigated with a N2 sorption analyzer (Micromeritics ASAP 2420). Samples were degassed overnight at a set temperature of 250 °C prior to analysis, which was carried out at −196 °C. The specific surface area (SSA) was calculated using the Brunauer–Emmett–Teller (BET) method in the relative pressure range of 0.01–0.15 for microporous materials, and the total pore volume (Vt) was collected at P/P0 of 0.99. The t-plot method was used to calculate the total micropore area (Smicro) and micropore volume (Vmicro).2.3 High pressure CO2 adsorption measurements
High pressure CO2 adsorption experiments were carried out using a Quantachrome Isorb HP1 instrument fitted with an external water circulator. Prior to CO2 adsorption measurements, the samples were put on overnight degassing under vacuum at 250 °C. Adsorption isotherms were obtained at two different set temperatures of 0 °C and 25 °C and a pressure range of 0 bar to 30 bar. The isoelectric heat of adsorption was computed using the Clausius Clapeyron equation to ascertain the nature of interactions between the adsorbent and the adsorbate.3. Results and discussion
3.1 Crystal structure analysis
The XRD patterns of NDAB3-T materials are depicted in Fig. 1. Two broad peaks centred at 2θ = 23° (002) and 43° (101) are observed in the XRD patterns of all samples, suggesting that the carbon framework exhibits the graphitic phase. These results are consistent with the carbonaceous materials previously reported in the literature.24,25 It is worth mentioning here that there is a gradual shift in the lower angle peak from 23° to 26° with increasing temperature from 500 °C to 700 °C, indicating a shrinkage of the (002) plane at high carbonization temperature. This experimental finding also reveals that the calcination at an elevated temperature promotes the removal of functional groups in carbon. As expected, the intensity of both the peaks at 2θ angle of 23° (002) and 43° (101) increases with increasing the carbonization temperature, revealing that the degree of graphitization is improved at higher temperatures.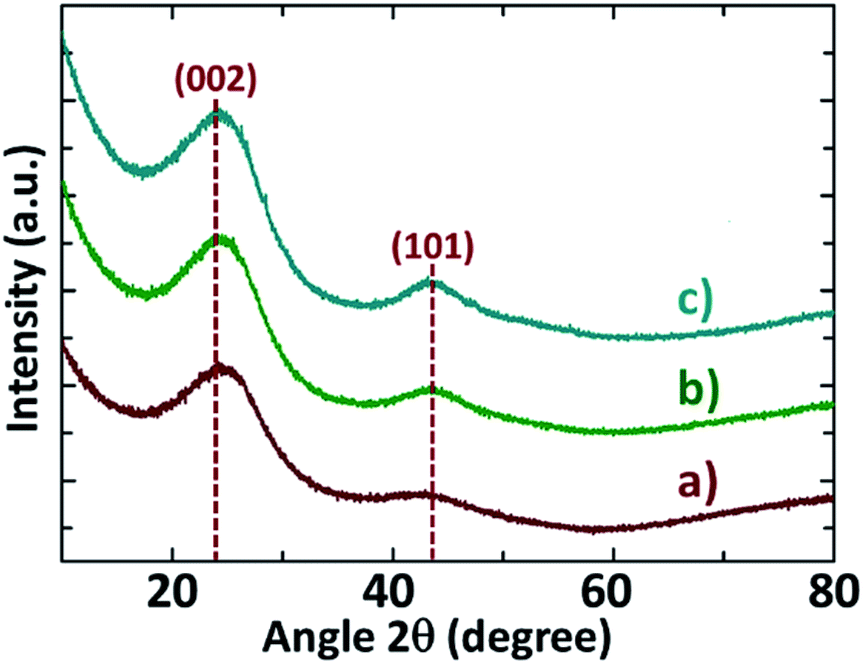 | ||
| Fig. 1 XRD patterns of NDAB3-T, where T = (a) 500, (b) 600 and (c) 700 °C. | ||
The XRD patterns of the materials prepared using all other impregnation ratios of ZnCl2 to Arundo donax/chitosan (0–2) at all temperatures are shown in Fig. S1 (see the ESI†). All the samples exhibit the diffraction peaks at 2θ = 23° (002) and 43° (101) which confirm again the graphitic nature of carbon walls. At any given temperature, the intensity of these two peaks becomes progressively more distinct when the amount of ZnCl2 was increased from 0 to 3 leading to an increase in graphitization.
3.2 Chemical composition and chemical bonding analysis
As depicted in Table S1 (see the ESI†), all synthesized N-doped activated biocarbons contain high amounts of carbon (68–82 wt%) and an appreciable amount of nitrogen (3.3–6.5 wt%) based on CNS analysis. At any given temperature, the N/C ratio decreases as the activation amount of ZnCl2 is increased from 0 to 3. A similar trend is also noticed when the pyrolysis temperature was elevated from 500 °C to 700 °C. The loss of N with increasing the amount of activating agent and temperature is attributed to poor thermodynamic stability of nitrogen in the carbon matrix, as the nitrogen prefers to stay as nitrogen molecules rather than C–N. This experimental finding highlights that the N content in N-doped activated biocarbons can be controlled by tailoring the amount of the activating agent and the carbonization temperature.The surface chemical composition of N-doped activated biocarbons was investigated by using XPS survey spectra. As shown in Fig. S2 and Table S2,† N-doped activated and non-activated biocarbons exhibit the presence of C, N and O elements (see the ESI†). Both NDAB3-T and NDAB(0–2)-T show the dominant presence of carbon along with a small amount of nitrogen and oxygen. Considering the large atomic size of oxygen, it is predicted that the oxygen atom is functionalized on the surface of carbon rather than that it being substituted on the carbon site. Based on XPS and CNS results, the identical trends are observed in N content for surface and bulk compositions, suggesting the successful N-doping in activated porous biocarbons.
Further information on the position of C, N and O atoms in N-doped activated biocarbons was examined by deconvoluting the high resolution C 1s, N 1s and O 1s spectra of the NDAB3-T sample, as illustrated in Fig. 2 and S3 (see the ESI†). All C 1s spectra are deconvoluted into three peaks centred at 284.3–284.7, 285.0–285.3 and 288.0–289.0 eV corresponding to sp2 C–C bonding,26 sp2 carbon bonded with nitrogen inside the aromatic ring and the carbon bonded with the nitrogen outside the cyclic ring,27 respectively. The N 1s spectra exhibit two main peaks at 398.5–398.7 eV and 400.5–400.7 eV upon the deconvolution, and these are ascribed to pyridinic N and pyrrolic N bonding, respectively.28 This result strongly demonstrates the successful incorporation of nitrogen atoms into the graphitic structure of the carbon.29 The third wide N 1s peak appearing in the region around 406.0 eV indicates the attachment of the nitrogen atom to oxygen on the surface of carbon.30 From the O 1s spectra as shown in Fig. S3 (see the ESI†), two peaks can be fitted at 531.0 eV and 532.5 eV that correspond to the C![[double bond, length as m-dash]](https://www.rsc.org/images/entities/char_e001.gif) O and C–O bonding of the carbonyl group, respectively.31 Based on these observations, the structure of N-doped activated biocarbons is proposed in Fig. 3. These results indicate that the materials are composed of several carbonyl and nitrogen functionalities that are useful for enhancing the adsorption of CO2 molecules.
O and C–O bonding of the carbonyl group, respectively.31 Based on these observations, the structure of N-doped activated biocarbons is proposed in Fig. 3. These results indicate that the materials are composed of several carbonyl and nitrogen functionalities that are useful for enhancing the adsorption of CO2 molecules.
 | ||
| Fig. 2 High resolution XPS C 1s and N 1s spectra of NDAB3-T, where T = (A) 500, (B) 600 and (C) 700 °C. | ||
 | ||
| Fig. 3 Proposed structure of N-doped activated biocarbons derived from Arundo donax and chitosan. | ||
3.3 Surface morphology analysis
The SEM images of NDAB3-T are presented in Fig. 4. It can be observed that N-doped activated biocarbons possess irregular morphology in the form of scattered lumps. NDAB3-500 shows macropores of size ∼1–5 μm. With an increase in carbonization temperature, the amount of macropores increases and the pore size reaches close to 10 μm for NDAB3-600 and NDAB3-700 samples. These morphological differences are attributed to the different release degree of volatiles at each temperature, which oxidizes a part of the graphitic carbon framework, leaving large macropores. EDS analysis (Fig. S5 and Table S3†) confirms the presence of N, O and C in the materials. The intensity of the N peaks increases with a decrease in carbonization temperature. The amount of N calculated from the EDS analysis was almost similar to that obtained from XPS and CNS analysis.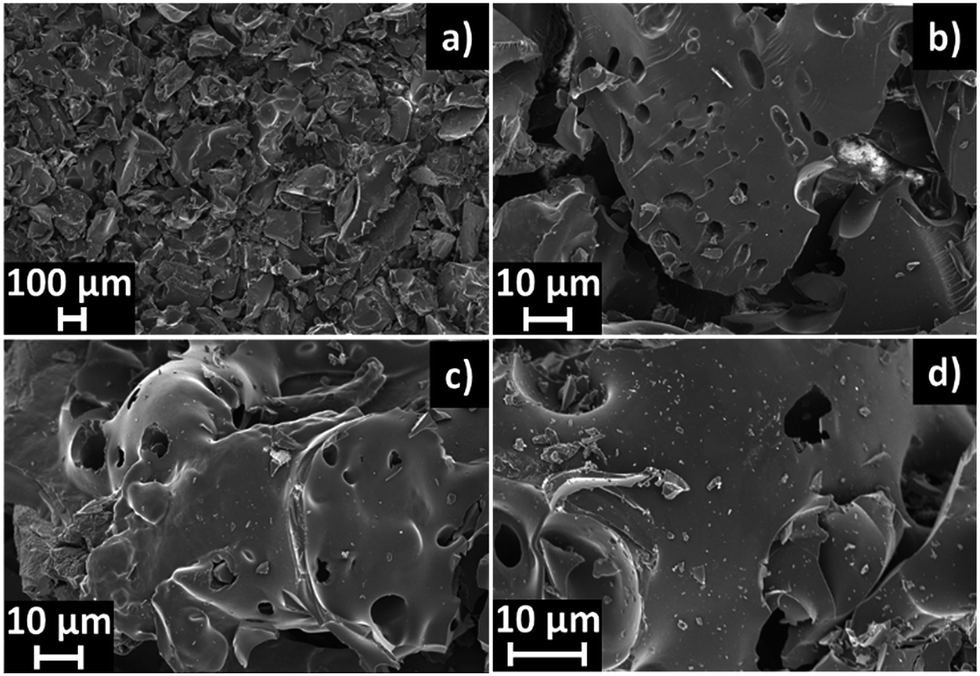 | ||
| Fig. 4 SEM images of NDAB3-T, where T = (a, b) 500, (c) 600 and (d) 700 °C. | ||
3.4 Textural parameter analysis
The micro and mesoporous features of NDAB3-T are investigated based on N2 sorption isotherms and DFT pore size distribution curves as presented in Fig. 5. The shape of isotherms of the samples is similar and correspond to type I as per the IUPAC classification.32 | ||
| Fig. 5 (A) N2 sorption isotherms and (B) DFT pore size distribution of NDAB3-T, where T = (a) 500, (b) 600 and (c) 700 °C. | ||
As shown in Fig. 5A, there is a significant amount of N2 adsorbed at a low-pressure range (P/P0 = 0–0.1) and the linear adsorption at the pressure range of P/P0 = 0.1–0.3. These results suggest the presence of micro and mesopores in the biocarbon materials.33 At any given temperature, it was observed that NDAB3-T samples possess micro and mesopores with pore widths of 1.6 and 2.1 nm, respectively (Fig. 5B). These analysis results imply that the one-step strategy using ZnCl2 for activation of biomass and chitosan was successful in generating the porous channels in N-doped biocarbons. The textural parameters of NDAB3-T are summarised in Table 1. As can be seen in Table 1, NDAB3-500 exhibits a larger specific surface area and higher total pore volume as compared to those of NDAB3-600 and NDAB3-700. This may be attributed to the fact that the strong dehydrating effect of ZnCl2 at high temperature tends to cause shrinkage of the carbon structure, thereby reducing porosity and resulting in reduced values of the specific surface areas and pore volumes.34 This is consistent with the published literature where a temperature of 500 °C has been reported as the ideal temperature for achieving the highest degree of textural characteristics in ZnCl2 activated biomass.35
| Sample | SABET (m2 g−1) | SAmicro (%) /SAmeso (%) | PVtotal (cm3 g−1) | PVmicro (%) /PVmeso (%) | PW (nm) |
|---|---|---|---|---|---|
| a SABET – BET surface area, SAmicro – micropore surface area, SAmeso –mesopore surface area, PVtotal – total pore volume, PVmicro – micropore volume, PVmeso – mesopore volume and PW – pore width calculated using the DFT method. | |||||
| NDAB3-500 | 1863 | 33/67 | 1.00 | 27/73 | 2.1 |
| NDAB3-600 | 1340 | 37/63 | 0.68 | 32/68 | 2.1 |
| NDAB3-700 | 1420 | 27/73 | 0.76 | 24/76 | 2.1 |
The N2 sorption isotherms and textural parameters for NDABn-T (n = 0–2, T = 500–700 °C) are shown in Fig. S4 and Table S4 (see the ESI†). N-doped non-activated biocarbons, NDAB0-T, show almost negligible adsorption of N2, which indicates that they are of non-porous nature. However, upon activation, pore channels are generated which allow higher adsorption of N2 in the materials as presented in N2 sorption isotherms for NDAB1-T and NDAB2-T. It was also observed that the micro- and meso-porosity could be easily tuned by adjusting the amount of ZnCl2 used. The mesoporosity of materials increases when the amount of ZnCl2 impregnation was enhanced from 1 to 3. This is due to the fact that ZnCl2 penetrates the interior of biomass causing its hydrolysis during heat treatment, resulting in the production of volatiles accompanied by a corresponding weight loss.36 These volatiles tend to escape through and undergo further oxidation reactions with biomass carbon to generate further products that help in inducing the formation of pores. It is worth mentioning that the highest values of the specific surface area of 1863 m2 g−1 and pore volume of 1.0 cm3 g−1 were obtained for NDAB3-500 among all the present NDABn-T (n = 0–3, T = 500–700 °C) materials. These excellent textural values imply that the incoming CO2 molecules can be effectively adsorbed on the surface and better facilitated inside the porous carbonaceous structure of the activated materials.
3.5 CO2 adsorption analysis
CO2 adsorption capacities of NDAB3-T determined at two different temperatures of 0 °C and 25 °C under a pressure range of 0–30 bar are displayed in Fig. 6, and the amount of CO2 adsorbed on these materials is given in Table 2. As shown in Fig. 6, NDAB3-T materials show a significant CO2 uptake at low pressure and the linear adsorption at high pressure. This happens as the initial adsorption takes place due to the quick filling of the micropores present inside the N-doped activated biocarbons by the circulating CO2 molecules. Afterwards, the adsorption occurs on the surface-active sites and the mesopores. NDAB3-500 adsorbs a high amount of CO2 at 0 °C/30 bar (18.2 mmol g−1) and at 25 °C/30 bar (13.1 mmol g−1). These conditions mimic the CO2 capture from the pre-combustion of flue gas streams and the observed adsorption capacities are comparatively higher than the reported CO2 adsorption capacities for materials such as ordered mesoporous carbon nitrides,1 zeolite 13X37 and carbon nanofibres.38 | ||
| Fig. 6 CO2 adsorption isotherms of NDAB3-T, where T = (a) 500, (b) 600 and (c) 700 °C. | ||
| Sample | CO2 uptake (mmol g−1) at 0 °C | CO2 uptake (mmol g−1) at 25 °C | ||
|---|---|---|---|---|
| 1 bar | 30 bar | 1 bar | 30 bar | |
| NDAB3-500 | 3.6 | 18.2 | 2.1 | 13.1 |
| NDAB3-600 | 3.3 | 15.0 | 1.7 | 11.1 |
| NDAB3-700 | 3.3 | 15.6 | 2.0 | 11.3 |
High CO2 adsorption values of 3.6 mmol g−1 and 2.1 mmol g−1 are observed at 0 °C and 25 °C under ambient pressure conditions that represent the post combustion adsorption of CO2 from the flue gas streams. These values closely match/are higher than those of the previously reported solid carbonaceous adsorbents,39–41 zeolites42,43 and nitrogen containing materials such as amine coated commercial activated carbon,44 polyethylene, functionalised single walled nanotubes45 and 1,5-diazabicyclo [4.3.0] non-5-ene-modified styrene.46 It is worth noting that the N-doped activated carbons synthesized in our present study come from relatively inexpensive precursors and can be synthesized in the simple and quicker one step process with the negligible generation of waste, while all the above-mentioned materials are synthesized using expensive starting chemicals and complex and long procedures often accompanied by large waste disposal considerations.
Among the samples studied under the optimized adsorption conditions, NDAB3-500 exhibits the highest CO2 adsorption capacity. The excellent CO2 adsorption capacity of NDAB3-500 is directly related to its highest specific surface area (1863 m2 g−1), the largest specific pore volume (1.0 cm3 g−1) and considerably a high amount of nitrogen content (5.4 wt%). It was observed that the surface area plays a dominant role in CO2 adsorption and a direct correlation was found between the surface area and CO2 adsorption, as shown in Fig. 7A. A similar trend was also observed between the amount of N content and CO2 uptake of the materials, as plotted in Fig. 7B.
 | ||
| Fig. 7 The relationship between CO2 adsorption measured under different conditions with (A) the BET surface area and (B) nitrogen content of the NDAB3-T materials. | ||
The presence of basic nitrogen sites is an important factor that leads to improvement in the absorption of acidic CO2 molecules due to stronger acid–base attractions between the adsorbate and the adsorbent.47,48 This assumption is strongly supported in our current investigations from the calculated values of isoelectric heats of adsorption, as shown in Fig. 8A and B. The materials NDAB3-600 and NDAB3-700 possess lower nitrogen content (3.5–4.1 wt%) and their corresponding isoelectric heats of adsorption are 26.5 kJ mol−1 and 24.6 kJ mol−1, respectively. These values of isoelectric heat of adsorption are higher than those of many activated carbons without any N-doping.49,50 However, the value of isoelectric heat of adsorption is lower than that of chemisorption (60–90 kJ mol−1),51 which indicates that the CO2 adsorption onto the activated carbons was purely physical in nature. An increased nitrogen content in NDAB3-500 (5.41 wt%) leads to a further enhancement in the isoelectric heat of adsorption to a high value of 32.2 kJ mol−1. The presence of nitrogen enhances the interactions between activated porous biocarbon and CO2 resulting in higher isoelectric heats of adsorption.18,52,53 It is proposed that a higher content of nitrogen tends to shift the process of CO2 adsorption from just van der Waal's interactions to somewhat stronger physical forces such as pole–pole interactions54 and hydrogen bonding.55
 | ||
| Fig. 8 (A) Isoelectric heat of adsorption calculated at 0 °C and 25 °C and (B) relationship between isoelectric heat of adsorption and nitrogen content of NDAB3-T, where T = (a) 500, (b) 600 and (c) 700 °C. | ||
After the CO2 adsorption, the spent activated porous biocarbon materials were easily regenerated by heating under vacuum up to a temperature of 250 °C and then retested for CO2 uptake. The recyclability test experiments (RTEs) carried out over a period of three adsorption cycles showed no significant alterations in the CO2 uptake, which was recorded as 18.2 mmol g−1, 18.1 mmol g−1 and 18.0 mmol g−1 (Fig. 9). This shows the excellent recycling ability of the synthesized N-doped porous activated biocarbons. These results reveal that the adsorbents are highly stable and the nitrogen functionalities are strongly bonded with the carbon matrix.
 | ||
| Fig. 9 CO2 adsorption isotherms of NDAB3-500 measured over three cycles of adsorption at 0 °C. | ||
4. Conclusions
In summary, N-doped activated biocarbons with controlled porosity were synthesized from a combination of the waste biomass Arundo donax and the organic material chitosan by a direct one-step activation process. It was found that the carbonization temperature and the amount of the chemical activating agent used are two key factors affecting the generation of porosity and the nitrogen content in the biocarbon structure. The material prepared using a low carbonization temperature of 500 °C and a high impregnation ratio of 3 for ZnCl2 to Arundo donax/chitosan (NDAB3-500) exhibited the best surface parameters with a high specific surface area of 1863 m2 g−1, a high specific pore volume of 1.0 cm3 g−1 and a high content of N (5.4 wt%). According to the isoelectric heat of adsorption study, the high performance of NDAB3-500 for CO2 capture (13.1 mmol g−1 at 25 °C/30 bar and 2.1 mmol g−1 at 25 °C/1 bar) is attributed to its excellent textural parameters and enhanced surface polarity due to the presence of N dopant. Considering its excellent CO2 adsorption capacity at both low and high pressures, this material could be utilized for pre- and post-combustion capture of CO2 from flue gas streams. This quick one-step synthesis strategy is quite promising as it has the potential to be easily upscaled for large-scale pilot operations in various industries and could be extended for the preparation of several nitrogen doped and activated biocarbons from various other biomass resources.Conflicts of interest
There are no conflicts of interest to declare.Acknowledgements
The work reported in this manuscript was financially supported by the Cooperative Research Centre for Contamination Assessment and Remediation of the Environment (CRC CARE) through grant no. (3.3.02-15/16), whose activities are funded by the Australian Government's Cooperative Research Centres Programme. A. Vinu also acknowledges the research support and laboratory facilities provided by Future Industries Institute, University of South Australia, and Australian Research Council for the Future Fellowship and Discovery Grants.Notes and references
- K. S. Lakhi, D.-H. Park, G. Singh, S. N. Talapaneni, U. Ravon, K. Al-Bahily and A. Vinu, J. Mater. Chem. A, 2017, 5, 16220–16230 CAS.
- Y. Li, G. Ruan, A. S. Jalilov, Y. R. Tarkunde, H. Fei and J. M. Tour, Carbon, 2016, 107, 344–351 CrossRef CAS.
- G. Singh, I. Y. Kim, K. S. Lakhi, P. Srivastava, R. Naidu and A. Vinu, Carbon, 2017, 116, 448–455 CrossRef CAS.
- H. Prats, D. Bahamon, G. Alonso, X. Gimenez, P. Gamallo and R. Sayos, J. CO2 Util., 2017, 19, 100–111 CrossRef CAS.
- H. He, L. Zhuang, S. Chen, H. Liu and Q. Li, Green Chem., 2016, 18, 5859–5869 RSC.
- Y. Pan, Y. Zhao, S. Mu, Y. Wang, C. Jiang, Q. Liu, Q. Fang, M. Xue and S. Qiu, J. Mater. Chem. A, 2017, 5, 9544–9552 CAS.
- M. G. Rabbani, T. Islamoglu and H. M. El-Kaderi, J. Mater. Chem. A, 2017, 5, 258–265 CAS.
- F. Su, C. Lu, W. Cnen, H. Bai and J. F. Hwang, Sci. Total Environ., 2009, 407, 3017–3023 CrossRef CAS PubMed.
- A. Shahtalebi, M. Mar, K. Guerin and S. K. Bhatia, Carbon, 2016, 96, 565–577 CrossRef CAS.
- K. S. Lakhi, W. S. Cha, S. Joseph, B. J. Wood, S. S. Aldeyab, G. Lawrence, J.-H. Choy and A. Vinu, Catal. Today, 2015, 243, 209–217 CrossRef CAS.
- N. Diez, P. Alvarez, M. Granda, C. Blanco, R. Santamaria and R. Menendez, Microporous Mesoporous Mater., 2015, 201, 10–16 CrossRef CAS.
- Z. Liu, Y. Yang, Z. Du, W. Xing, S. Komarneni, Z. Zhang, X. Gao and Z. Yan, Nanoscale Res. Lett., 2015, 10, 1–11 CrossRef CAS PubMed.
- W. Tian, H. Zhang, H. Sun, A. Suvorova, M. Saunders, M. Tade and S. Wang, Adv. Funct. Mater., 2016, 26, 8651–8661 CrossRef CAS.
- A. H. Khan, S. Ghosh, B. Pradhan, A. Dalui, L. K. Shrestha, S. Acharya and K. Ariga, Bull. Chem. Soc. Jpn., 2017, 90, 627–648 CrossRef.
- W. Wang, M. Zhou and D. Yuan, J. Mater. Chem. A, 2017, 5, 1334–1347 CAS.
- B. Zhu, K. Li, J. Liu, H. Liu, C. Sun, C. E. Snape and Z. Guo, J. Mater. Chem. A, 2014, 2, 5481–5489 CAS.
- A. Alabadi, H. A. Abbood, Q. Li, N. Jing and B. Tan, Sci. Rep., 2016, 6, 38614 CrossRef CAS PubMed.
- J. Wei, D. Zhou, Z. Sun, Y. Deng, Y. Xia and D. Zhao, Adv. Funct. Mater., 2013, 23, 2322–2328 CrossRef CAS.
- T. Horikawa, N. Sakao, T. Sekida, J. I. Hayashi, D. D. Do and M. Katoh, Carbon, 2012, 50, 1833–1842 CrossRef CAS.
- A. Castro-Muñiz, Y. Hoshikawa, T. Kasukabe, H. Komiyama and T. Kyotani, Langmuir, 2016, 32, 2127–2135 CrossRef PubMed.
- Q. Li, J. Yang, D. Feng, Z. Wu, Q. Wu, S. S. Park, C.-S. Ha and D. Zhao, Nano Res., 2010, 3, 632–642 CrossRef CAS.
- T. Yang and A. C. Lua, Mater. Chem. Phys., 2006, 100, 438–444 CrossRef CAS.
- T. Aysu and M. M. Kucuk, Int. J. Environ. Sci. Technol., 2015, 12, 2273–2284 CrossRef CAS.
- Y.-Y. Wang, B.-H. Hou, H.-Y. Lu, F. Wan, J. Wang and X.-L. Wu, RSC Adv., 2015, 5, 97427–97434 RSC.
- J. Zhang, X. Wang, G. Qi, B. Li, Z. Song, H. Jiang, X. Zhang and J. Qiao, Carbon, 2016, 96, 864–870 CrossRef CAS.
- E. Raymundo-Piñero, D. Cazorla-Amorós, A. Linares-Solano, J. Find, U. Wild and R. Schlögl, Carbon, 2002, 40, 597–608 CrossRef.
- J.-H. Zhou, Z.-J. Sui, J. Zhu, P. Li, D. Chen, Y.-C. Dai and W.-K. Yuan, Carbon, 2007, 45, 785–796 CrossRef CAS.
- Y. Wang, Y. Shao, D. W. Matson, J. Li and Y. Lin, ACS Nano, 2010, 4, 1790–1798 CrossRef CAS PubMed.
- L.-F. Chen, X.-D. Zhang, H.-W. Liang, M. Kong, Q.-F. Guan, P. Chen, Z.-Y. Wu and S.-H. Yu, ACS Nano, 2012, 6, 7092–7102 CrossRef CAS PubMed.
- J. Baltrusaitis, P. M. Jayaweera and V. H. Grassian, Phys. Chem. Chem. Phys., 2009, 11, 8295–8305 RSC.
- W. Deng, Y. Zhang, L. Yang, Y. Tan, M. Ma and Q. Xie, RSC Adv., 2015, 5, 13046–13051 RSC.
- J. H. Bang, H.-M. Lee, K.-H. An and B.-J. Kim, Appl. Surf. Sci., 2017, 415, 61–66 CrossRef CAS.
- M. P. Adhikari, R. Adhikari, R. G. Shrestha, R. Rajendran, L. Adhikari, P. Bairi, R. R. Pradhananga, L. K. Shrestha and K. Ariga, Bull. Chem. Soc. Jpn., 2015, 88, 1108–1115 CrossRef CAS.
- H. Sayğılı and F. Güzel, J. Cleaner Prod., 2016, 113, 995–1004 CrossRef.
- E. Koseoglu and C. Akmil-Basar, Adv. Powder Technol., 2015, 26, 811–818 CrossRef CAS.
- F. Caturla, M. Molina-Sabio and F. Rodriguez-Reinoso, Carbon, 1991, 29, 999–1007 CrossRef CAS.
- S. Cavenati, C. A. Grande and A. E. Rodrigues, J. Chem. Eng. Data, 2004, 49, 1095–1101 CrossRef CAS.
- V. Jiménez, A. Ramírez-Lucas, J. A. Díaz, P. Sánchez and A. Romero, Environ. Sci. Technol., 2012, 46, 7407–7414 CrossRef PubMed.
- F. Dreisbach, R. Staudt and J. U. Keller, Adsorption, 1999, 5, 215–227 CrossRef CAS.
- C. Pevida, M. G. Plaza, B. Arias, J. Fermoso, F. Rubiera and J. J. Pis, Appl. Surf. Sci., 2008, 254, 7165–7172 CrossRef CAS.
- J. Przepiórski, M. Skrodzewicz and A. W. Morawski, Appl. Surf. Sci., 2004, 225, 235–242 CrossRef.
- R. V. Siriwardane, M.-S. Shen and E. P. Fisher, Energy Fuels, 2003, 17, 571–576 CrossRef CAS.
- E. Díaz, E. Muñoz, A. Vega and S. Ordóñez, Ind. Eng. Chem. Res., 2008, 47, 412–418 CrossRef.
- M. G. Plaza, C. Pevida, A. Arenillas, F. Rubiera and J. J. Pis, Fuel, 2007, 86, 2204–2212 CrossRef CAS.
- E. P. Dillon, C. A. Crouse and A. R. Barron, ACS Nano, 2008, 2, 156–164 CrossRef CAS PubMed.
- B. Ochiai, K. Yokota, A. Fujii, D. Nagai and T. Endo, Macromolecules, 2008, 41, 1229–1236 CrossRef CAS.
- L. Wang and R. T. Yang, J. Phys. Chem. C, 2012, 116, 1099–1106 CAS.
- N. P. Wickramaratne, J. Xu, M. Wang, L. Zhu, L. Dai and M. Jaroniec, Chem. Mater., 2014, 26, 2820–2828 CrossRef CAS.
- M. D. Hornbostel, J. Bao, G. Krishnan, A. Nagar, I. Jayaweera, T. Kobayashi, A. Sanjurjo, J. Sweeney, D. Carruthers, M. A. Petruska and L. Dubois, Carbon, 2013, 56, 77–85 CrossRef CAS.
- S. Himeno, T. Komatsu and S. Fujita, J. Chem. Eng. Data, 2005, 50, 369–376 CrossRef CAS.
- A. Samanta, A. Zhao, G. K. H. Shimizu, P. Sarkar and R. Gupta, Ind. Eng. Chem. Res., 2012, 51, 1438–1463 CrossRef CAS.
- J. Fujiki and K. Yogo, Chem. Commun., 2016, 52, 186–189 RSC.
- X. Fan, L. Zhang, G. Zhang, Z. Shu and J. Shi, Carbon, 2013, 61, 423–430 CrossRef CAS.
- J. He, J. To, J. Mei, Z. Bao and J. Wilcox, Energy Procedia, 2014, 63, 2144–2151 CrossRef CAS.
- W. Xing, C. Liu, Z. Zhou, L. Zhang, J. Zhou, S. Zhuo, Z. Yan, H. Gao, G. Wang and S. Z. Qiao, Energy Environ. Sci., 2012, 5, 7323–7327 CAS.
Footnote |
| † Electronic supplementary information (ESI) available: XRD of NDABn-T, XPS survey of NDAB0-T and NDAB3-T, EDS and high resolution XPS of NDAB3-T, N2 sorption of NDABn-T, CNS, XPS and EDS elemental composition, CO2 uptake error bars and textural properties of NDAB0-2 (500–700 °C). See DOI: 10.1039/c7ta07186h |
| This journal is © The Royal Society of Chemistry 2017 |