 Open Access Article
Creative Commons Attribution 3.0 Unported Licence
Influence of the Ca/Si ratio on the compressive strength of cementitious calcium–silicate–hydrate binders
Wolfgang
Kunther
 a,
Sergio
Ferreiro
b and
Jørgen
Skibsted
 *a
*a
aDepartment of Chemistry and Interdisciplinary Nanoscience Center (iNANO), Aarhus University, DK-8000 Aarhus C, Denmark. E-mail: jskib@chem.au.dk; Tel: +45 8715 5946
bAalborg Portland A/S, Cementir Holding, DK-9100 Aalborg, Denmark
First published on 26th July 2017
Abstract
The relation between the chemical composition of calcium–silicate–hydrate (C–S–H) phases and its influence on the compressive strength of cementitious materials is investigated by a new approach where prisms of C–S–H phases have been synthesized directly by the reaction of calcium hydroxide, amorphous SiO2 and water. The synthesized samples employ molar Ca/Si ratios of 0.83, 1.0, 1.25 and 1.50, and the compressive strengths and age-depending changes of the pastes have been followed for up to three months of hydration, after which the microstructures were characterized. The model pastes feature most characteristics of hydrated cements, including zones of different density but similar chemical composition. The experimental data demonstrates that the compressive strengths of the C–S–H pastes increase for decreasing Ca/Si ratio for all synthesized samples and testing ages. The molar volumes of the C–S–H phases decrease with decreasing Ca/Si ratio, which along with the related higher surface areas may partly explain the differences in strength development.
Introduction
Portland cement is the principal binding component, ‘the glue’, in concrete which is the most widely used building material globally. The world-wide Portland cement production is continuously increasing and reached 4.1 billion tons cement in 2015,1 and its extremely large-scale production implies that it is responsible for approx. 7% of the anthropogenic CO2 emissions.2 A reduction of this CO2 emission represents probably one of the most important and urgent research challenges for the cement industry. A materials chemistry approach to reduce the CO2 footprint of cementitious materials is to partially replace the cement by latent hydraulic supplementary cementitious materials (SCMs), such as fly ashes, slags, silica fume and calcined clays, although this may affect the strength of the material and the composition of the principal hydration product.Portland cement is mainly made up of the four clinker phases, alite (Ca3SiO5), belite (Ca2SiO4), tricalcium aluminate (Ca3Al2O6) and ferrite (Ca2(AlxFe2–x)O5) along with small additions of gypsum (CaSO4·2H2O) and limestone (CaCO3). The principal hydration product of hydrated Portland cement, and the main component responsible for the strength of Portland cement-based concrete, is a less-ordered/amorphous calcium–silicate–hydrate (C–S–H) phase with variable composition, often expressed by its average Ca/Si ratio and water content. Hydration of pure Portland cement results in a C–S–H phase with a Ca/Si ratio of approx. 1.7 (ref. 3) whereas this ratio decreases for increasing replacement with SCMs. This is schematically illustrated in Fig. 1 by the changes in hydrate phase assemblages for a white Portland cement with increasing amounts of SiO2, e.g. silica fume – a by-product from the ferrosilicon industry. An increasing amount of C–S–H phase is formed as long as portlandite (Ca(OH)2) still is present. After the depletion of portlandite, the quantity of C–S–H is nearly constant, however, a significant lowering of the Ca/Si ratio of the C–S–H occurs as the SiO2 replacement increases. The Ca/Si ratio of the C–S–H can range from approx. 0.67 to 2.0 (ref. 4 and 5) and thus, it represents one of the most crucial parameters from a material chemistry view in the design of new sustainable Portland cement – SCMs blends with low embodied CO2 footprint. In particular, this holds for the development of new binders which go beyond the upper limit for Portland cement replacement in building standards for most SCMs (i.e., 35 wt% in Europe6).
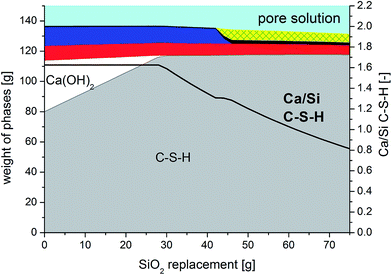 | ||
| Fig. 1 Changes in the hydrate phase assemblage and C–S–H Ca/Si ratio for a white Portland cement with increasing replacements by SiO2 (e.g. silica fume), as estimated by thermodynamic modelling.19,20 The cement is composed of 70 wt% alite, 15 wt% belite, 8 wt% tricalcium aluminate, 4 wt% gypsum and 3 wt% calcite and the calculation assumes full degree of reaction for SiO2 and the clinker phases. The most prominent phases are the C–S–H phase (grey; 0.8 < Ca/Si C–S–H < 1.6), the calcium-aluminate hydrate phases (red: ettringite, Ca6Al2(OH)12(SO4)3·26H2O; blue: monocarbonate, Ca4Al2(OH)12CO3·5H2O; checkered yellow: strätlingite, 2CaO·Al2O3·SiO2·8H2O) and calcite (black). | ||
The compressive strength is one of the most frequently used measures in the evaluation of the performance and reactivity of Portland cement-based materials. However, the relation between the chemical composition of the C–S–H phase and the compressive strength of the hardened material is not well understood, despite much research has been conducted on C–S–H phases in hydrated Portland cements.7 This includes studies of the materials micromechanical/elastic properties,8,9 which have indicated favourable properties for C–S–H phases with low Ca/Si ratios, although the results cannot be directly translated into macroscopic mechanical properties since the compressive strength depends not only elastic properties, but also on the chemical composition, the specimen geometry,10–12 the test conditions like the loading rate,13,14 or the used materials and mix design.15–18
Three main hypotheses have been developed to explain the differences in strength for cement materials:
(1) “The porosity of the sample determines the strength”. This statement accounts for differences in strength for otherwise similar, conventional concretes21 and it can be supported experimentally by variations of the air content22 or removal of large pores from the cement pastes.23 Pores, voids and cracks are identified as the weakest links in the material and thought to provide starting points for crack initiation and growth. However, this hypothesis does not provide an explanation for the cohesiveness of the material.
(2) “The phase assemblage of the hardened material determines the strength”. An empirical approach is used on the macro-scale and describes the strength of a material by the space-filling capabilities of the hydrate assemblage described as the gel-space ratio.24,25 The research on the nano- to micrometer scale focuses on the elastic properties of the individual phases,9,26–28 and it has been compared with data generated by molecular modelling.29–31 However, the atomic structure of the C–S–H phase is not fully explored and there are some significant disagreements about the nano-scale atomic structure that provides the best representation of the C–S–H phase in cementitious systems.4 The mechanical properties of crystalline minerals with similar structures as the C–S–H phase have been investigated on small length scales experimentally and by modelling, such as tobermorite (Ca5Si6O16(OH)2·8H2O),32,33 jennite (Ca9Si6O18(OH)6·8H2O),32,34 and portlandite (Ca(OH)2),35–37 where the latter may be tightly intermixed with C–S–H for Ca/Si ≥ 1.5.
(3) The third hypothesis focusses on the space between the solid particles by modelling the interactions between two surfaces38 or a surface and its interactions with ions in solution combined with experimental surface-force measurements.39–41 Such forces have been identified as the origin of cohesiveness for these materials and they provide an explanation for the mechanical properties of minerals that have been synthesized in excess of water and subsequently used to produce compacted specimens that resemble model systems for cement pastes.9,35,42–44
To our knowledge, no approach takes into account that the chemical composition of the C–S–H may differ and may have an impact on the structure and cohesion of the C–S–H phase across all relevant length scales. Two main approaches have been used to investigate the mechanical properties of C–S–H phases with different Ca/Si ratios: (i) reduction of the Ca/Si ratio by accelerated leaching of Portland cement pastes.26,27 This procedure increases also the porosity of the leached samples26,27 and the pastes contain calcium aluminate hydrate phases in addition to C–S–H. (ii) The use of compacted specimens produced from synthesized C–S–H phases.9,42–44 This approach has the advantage that the porosity of the compacted material and the chemical composition of the hydrates can be modified in a controlled manner. However, it is unclear how the microstructure, cohesion and aging of the C–S–H phase in the compacts differ from those present in cement materials formed by hydration under conventional conditions.
In this work, a direct and new approach to produce C–S–H specimens with different Ca/Si ratios is used, where the C–S–H pastes are formed directly by the reaction between portlandite and silica (amorphous SiO2) employing a relatively small quantity of water. Thus, we investigate for the first time the compressive strength of pure C–S–H monoliths with Ca/Si ratios ranging from the tobermorite-like ratio of 0.83, found in the oldest concrete structures,45 to the ratio of 1.5 found in conventional Portland cement – silica fume blends.46 The principal goal is to investigate the influence of the chemical composition of C–S–H phases on the compressive strength, which has not been studied before for pure materials that do not also contain calcium aluminate hydrate phases and aggregates or unreacted clinker. The analysed paste specimens consist only of C–S–H phases and small amounts of calcium hydroxide for the high Ca/Si-ratio samples. The age-depending changes of the pastes are followed up to three months of hydration, after which their microstructures were characterized.
Experimental section
Materials
C–S–H paste samples were prepared from stoichiometric mixtures of Ca(OH)2 (Sigma Aldrich, USA) and silica (Fluka silica gel 60, particle size 40–63 μm, Sigma Aldrich, USA) and deionized water. In addition, a polycarboxylate superplasticizer was used (Glenium Sky 631, BASF, Germany).The pastes were produced at ambient pressure and a temperature of 20 ± 1 °C for Ca/Si molar ratios of 0.83, 1.00, 1.25, and 1.50 (Table 1), using a fixed water/solid ratio of 1.1 by volume to obtain mixes with similar initial porosity. The densities used in the mix design to calculate the expected volumes were 2.21 g cm−3 and 1.43 g cm−3 for Ca(OH)2 and silica, respectively. Trials revealed that the water demand depends critically on the amount of silica. To achieve a workable paste, the amount of super-plasticizer was adjusted to 20 wt% of the mass of silica, which consequently leads to a small deviation from the targeted water/solid volume ratio (see Table 1). Thus, the actual water/solid ratios by weight range from 0.63 to 0.68. The powders were homogenized before addition of water, and the superplasticizer was added with a delay of 30 seconds after water addition. The total mixing time was 5 minutes, after which the pastes were filled into miniRilem molds (19 × 19 × 144 mm3) in two layers. The molds were vibrated for 2 minutes for each layer to remove air bubbles efficiently. Bleeding or segregation of the pastes was not observed. The bars were demolded carefully after one day of hydration in a humidity chamber (T = 20.0 ± 1.0 °C and RH ≥ 90%) and afterwards stored at 20 ± 2 °C in sealed plastic bags until testing.
Parallel to the samples for the compressive strength experiments, approx. 10 ml of the excess pastes were filled into centrifuge tubes, one for each investigated hydration time. The tubes were sealed and vibrated to remove air bubbles from the paste and stored in a nitrogen-filled glovebox. At the selected hydration times, one tube per Ca/Si paste was ground. The hydration was stopped by stirring the crushed paste in isopropanol for 1 hour. The filtered residue was stored in a glove box filled with nitrogen. Subsequently, the samples were investigated by 29Si MAS NMR, thermogravimetric analyses (TGA) and powder X-ray diffraction (XRD).
Approximately 1 cm thin slices were cut off one end of the paste bars after 91 days of hydration, before testing their compressive strength. The slices were dried for 2 days at 40 ± 2 °C, then impregnated with epoxy, polished, and carbon coated for the microstructural investigations using a scanning electron microscope with an EDS detector.
Methods
Results and discussion
i. Compressive strength development and micro-structural characterization
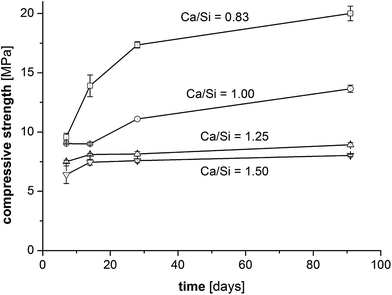
The compressive strengths as a function of curing time (7–91 days) and Ca/Si ratio are shown in Fig. 2 and clearly reveal that the prisms with the lowest Ca/Si ratios exhibit the highest strength at all studied hydration times. A significant increase in compressive strength with curing time is observed for the low Ca/Si C–S–H pastes (Ca/Si = 0.83 and 1.00) whereas only small increases in strength are observed for the two high Ca/Si C–S–H pastes. After 3 months of curing, the compressive strength of the Ca/Si = 0.83 binder is more than double the value of the highest Ca/Si ratio. In comparison to Portland cement mortars, the compressive strengths for the C–S–H paste samples (Fig. 2) are generally low, however, they are comparable to the strengths of other model binders.50–52 Portland cement-based concretes and mortars containing silica fume also display improved strengths compared to the plain cements when a good dispersion of the silica fume is achieved.53 However, for binders with silica fume, this is often ascribed to microstructural changes and improvements in the particle-size distribution.Contrary to silica fume containing binders, the model binders investigated here display very similar microstructures, as indicated by Fig. 3, which shows representative microstructures for each C–S–H composition. These micrographs are remarkably similar, the main difference being the appearance of μm-sized portlandite domains for the Ca/Si ratios of 1.25 and 1.50 (only visible in full-sized micrographs, not shown here). All four microstructures are characterized by a dark matrix with embedded lighter grey particles. Larger pores are represented as black areas. The brighter grey domains appear well dispersed and have dimensions similar to the particle size of the silica source (40–63 μm). The good dispersion may be related to the dispersing influence of the superplasticizer and its impact on the nucleation of the C–S–H phases.54 In analogy to hydrated Portland cements, two morphologies are identified and denoted in the following as inner and outer C–S–H, respectively. Image analysis procedures have been used to separate and quantify the inner and outer C–S–H product areas.
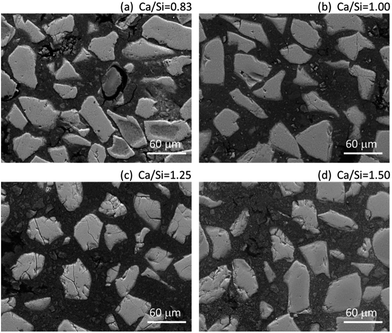 | ||
| Fig. 3 Representative micrographs (backscattered electron mode, BSE) of the four C–S–H pastes after 91 days of hydration. | ||
Fig. 4 contains a representative example for the area distribution between inner and outer products for each C–S–H paste. The images show the increase in space between the inner C–S–H domains with increasing Ca/Si ratio. This illustrates the change in composition and the good dispersion between the original silica particles.
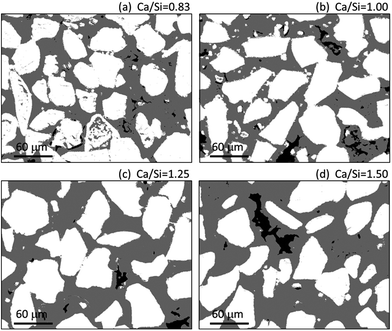 | ||
| Fig. 4 Representative area distribution between the inner (white) and outer (grey) C–S–H domains of the four C–S–H pastes according to image segmentation. Black areas correspond to pores. | ||
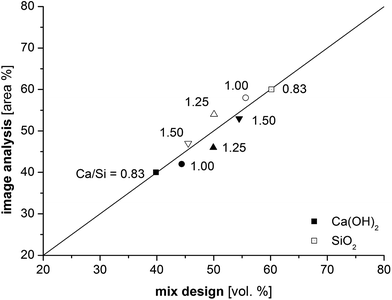
The porosity was not considered in the image analysis procedure since the samples displayed different levels of cracking after the drying of the samples in an oven at 40 °C. The drying step is required before the samples can be impregnated with epoxy resin. Therefore, it is difficult to distinguish between original porosity and shrinkage cracks, unless the cracks propagate in the image plane. The severity of cracking of the dried samples was observed to increase with decreasing Ca/Si ratio. Fig. 5 compares the area percentage obtained from image analysis for the inner and outer C–S–H domains with the volumetric proportions of silica and calcium hydroxide in the mix design, assuming that the water and superplasticizer distribute equally between the two solid fractions. The data shows good correlations between the volume of the inner C–S–H and the silica content as well as between the fraction of outer C–S–H and the calcium hydroxide content.
The lighter grey areas in the BSE micrographs indicate a higher average of atomic numbers55 and thereby a higher density considering the similarity in chemical compositions. Moreover, Fig. 3 and 4 show that the inner C–S–H domains, despite being well dispersed, are likely to contain a few contact points with a limited number of neighbouring inner C–S–H domains. An increase in such particle contacts could explain the slightly higher compressive strength for increasing silica contents. However, these effects would only explain the slightly higher strengths for the low Ca/Si binders at early ages. Thus, such an interpretation cannot explain the increase in compressive strength after the first few days of hydration for the C–S–H pastes with Ca/Si ratios of 0.83 and 1.00.
Fig. 6 shows the distribution of the Ca/Si ratios for each EDS measurement as a function of the measurement location for the paste with the bulk ratio Ca/Si = 1.25 and thus provides an overview of the variations in Ca/Si ratios in the microstructure of the paste. The Ca/Si = 1.25 sample was chosen since it has a relatively large compositional variability as compared to the two pastes with lower Ca/Si ratio. Generally, all pastes display a similar behavior for each bulk Ca/Si ratio. The BSE micrograph in the background provides microstructural orientation by allowing a distinction of the pores from the inner and outer product C–S–H domains. For this purpose, the contrast of the background image was adjusted to improve the clarity of the graphic. The Ca/Si ratios are categorized in five Ca/Si classes, labelled by its upper or lower value. A few data points have been omitted when the total counts were very low, indicating the location of pores. Measurements with Ca/Si ratios below 0.15 indicate largely unreacted silica and these points have also been removed. The dominating group of Ca/Si ratios agrees with the bulk Ca/Si ratio for all pastes and they are evenly distributed in the microstructure, however, with the outer product C–S–H being somewhat richer in calcium compared to the inner product C–S–H. The highest Ca/Si ratios are systematically found in proximities of the grain boundaries for the inner product C–S–H domains (Fig. 6, red squares). This observation is analogous to calcium-rich domains on the boundary of the original cement grains that have been reported for conventional Portland cement blended with silica fume.56 However, the difference between a clinker grain and the model binder studied in the present work is that the calcium content is higher in the unreacted clinker grains compared to the outer hydration products, whereas the calcium content is higher in the outer hydration products compared to the inner products for the model binder.
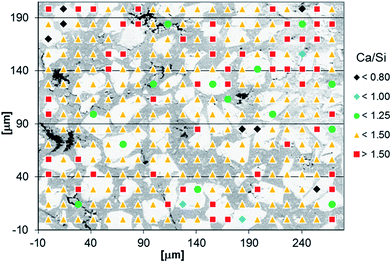 | ||
| Fig. 6 Distribution of Ca/Si ratios according to the EDS measurements over the microstructure for the C–S–H paste with a bulk Ca/Si ratio of 1.25 and hydrated for 91 days. | ||
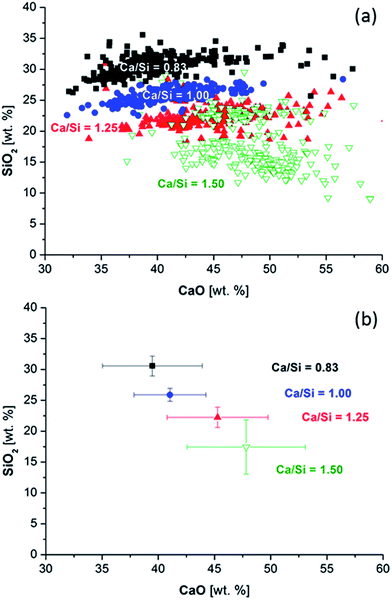
Fig. 7a compares the CaO and SiO2 contents as calculated from the EDS data for each paste for all measured, randomly distributed points as illustrated in Fig. 6 for the paste with the bulk Ca/Si ratio of 1.25. The distribution of the silicon oxide contents is much smaller compared to the variation in calcium oxide content. The clusters of data can clearly be distinguished for the bulk Ca/Si ratios of 0.83, 1.00 and 1.25. The data for the highest Ca/Si ratio (1.50) is split in two domains of which one overlaps with the Ca/Si = 1.25 data. The other fraction of data, corresponding to a lower SiO2 content, represents the outer product C–S–H containing excess portlandite. The median Ca/Si ratios are displayed in Fig. 7b where the standard deviations reflect the distribution in Ca/Si ratios for the individual pastes. The Ca/Si ratios of the EDS data align nearly to the straight line that would be expected from the bulk Ca/Si ratios used in the mix design.
ii. Characterization of the different C–S–H phases during aging
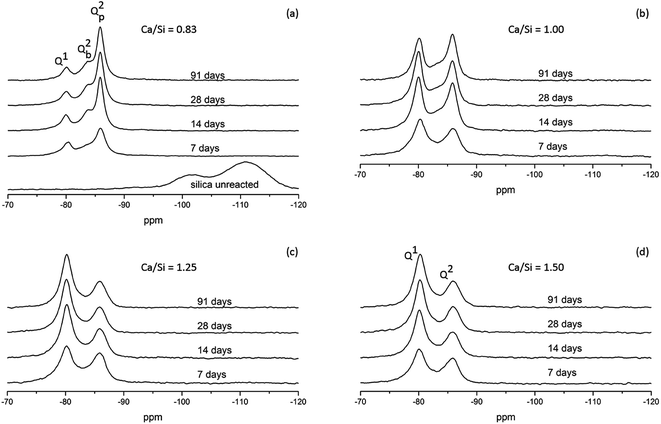
Parallel to the compressive strengths, samples have been prepared where the hydration of the model binders has been stopped at the same ages at which the strengths were measured. These samples are used to characterize phase changes in the materials using 29Si MAS NMR, TGA and XRD. 29Si MAS NMR spectra for all C–S–H samples at hydration times of 7, 14, 28 and 91 days are shown in Fig. 8.The 29Si NMR spectra of the C–S–H samples with the bulk Ca/Si = 0.83 (Fig. 8a) display for all hydration times three partly overlapping resonances at −79.3 ppm (dimers and silicate end groups Q1), −83.2 ppm (bridging site of the dreierketten of silicate chains, Qb2), and −85.4 ppm (paired sites of the dreierketten of silicate chains, Qp2). The intensities of the Qb2 and Qp2 peaks increase with increasing hydration time, which is most clearly seen by the changes from 7 to 14 days. The spectra also reveal a high reactivity of the silica in the Ca/Si = 0.83 paste since the broad Q3 and Q4 resonances, between −97 and −118 ppm, from unreacted silica are absent in the spectra even after seven days of hydration. The absence of intensity for the two peaks from silica is also apparent from the 29Si NMR spectra of the samples with higher Ca/Si ratio (Fig. 8b–d), demonstrating that the amount of unreacted material is very low in all samples. The spectra of the samples with higher Ca/Si ratios (Fig. 8b–d) exhibit higher intensities for the Q1 resonance coupled with lower intensities for the Q2 peaks and the contributions from the Qb2 and Qp2 sites are visually difficult to distinguish. The spectra for the Ca/Si = 1.25 and 1.50 samples are very similar at all times, which corresponds well with the EDS analyses that show an overlap in chemical composition for the inner product C–S–H for these samples. This supports further that the silicate ordering in the C–S–H phases is closely related to the Ca/Si ratio.4,20,48,57,58 The ordering of the silicate chains in the C–S–H phases increases slightly with the hydration time and it can be evaluated by a determination of the mean chain lengths ( ) of the SiO4 tetrahedra from the variation in Q1, Qb2 and Qp2 intensities. These intensities (I) are obtained from spectral deconvolutions of the 29Si MAS NMR spectra and the mean chain lengths are calculated according to:
  .59 The data are given in Table 2 for each C–S–H phase and time of hydration. The
  values increase with increasing hydration time for the Ca/Si = 0.83 and 1.0 pastes, in accordance with the visual appearance of the Q1 and Q2 intensities in the 29Si NMR spectra. The
  values for the Ca/Si = 1.25 and 1.5 samples are very similar and
  tends to slightly decrease with prolonged hydration. As the mean chain length of silicate tetrahedra is strongly related to the Ca/Si ratio of the C–S–H phase, this observation suggests that calcium enters the C–S–H structure during hydration from 7 to 14 days where the main changes in Q1 and Q2 peak intensities are seen in the 29Si NMR spectra.
 ) for the C–S–H pastesa
| Ca/Si | 7 d | 14 d | 28 d | 91 d |
|---|---|---|---|---|
a Determined from 29Si MAS NMR. The estimated error limits for the  values are ±0.2. values are ±0.2.
|
||||
| 0.83 | 5.2 | 9.6 | 11.0 | 13.1 |
| 1.00 | 3.8 | 4.4 | 4.1 | 4.9 |
| 1.25 | 4.1 | 3.4 | 3.2 | 3.2 |
| 1.50 | 4.1 | 3.6 | 3.4 | 3.5 |
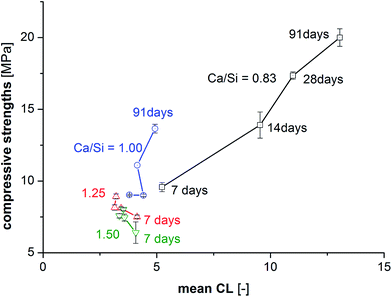
Fig. 9 shows the compressive strengths as a function of  for the individual blends and hydration times. The data reveals clearly that a direct relationship between compressive strength and
  is not observed. However, a strong and moderate increase in strength is observed for increasing
  (or hydration time) for the Ca/Si = 0.83 and Ca/Si = 1.0 pastes, respectively, whereas no clear trends are observed for the two pastes with highest Ca/Si ratios.
The elongation of the mean silicate chain lengths,9,29,60 and packing of silicate chains,31 has been suggested to stiffen the material and thus possibly enhance mechanical performance. In some of these investigations,9,61,62 the degree of hydration was studied by 29Si NMR spectroscopy and correlated to the compressive strength and changes in silicate polymerization. Consideration of the data in Fig. 9 for 91 days of hydration reveals an overall increase in strength with increasing mean chain length. However, this tendency reflects mainly the relation between Ca/Si ratio and  . For synthesized C–S–H phases,
  is insensitive to changes of the Ca/Si ratio for ratios above approximately 1.2.4,48,58 This makes it difficult to distinguish C–S–H phases by 29Si NMR in the Ca/Si = 1.2–1.5 compositional range and thereby to relate the silicate chain structure directly to the mechanical properties. Fig. 10 illustrates the changes in mean silicate chain lengths during hydration for the different Ca/Si ratios and highlights that the silicate-rich C–S–H phases experience larger changes with hydration time than the calcium-rich C–S–H phases.
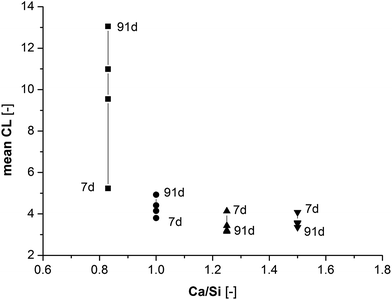 | ||
Fig. 10 Changes in mean silicate chain length ( ) for the four different C–S–H compositions with curing time. ) for the four different C–S–H compositions with curing time. | ||
Fig. 11 displays the X-ray diffractograms for all pastes and curing times. The data shows that all samples are nearly pure C–S–H phases and indicates that the sizes of C–S–H units do not change with curing time, as the peak shape and width of the reflexions from the C–S–H phases are not changing with curing time. The shift of the basal C–S–H reflexion to smaller 2θ angles (<8° 2θ) has been related to a decrease in the Ca/Si ratio for the C–S–H in earlier studies.63,64 The high-Ca/Si C–S–H sample is the only binder that contains portlandite in significant quantities throughout the investigated period. Furthermore, these samples also contain minor amounts of calcite, which may have formed from the reaction of portlandite and CO2 during sample handling and measurements. Portlandite is detected for the Ca/Si = 1.25 pastes at the early curing times but it disappears between two and four weeks of curing. The diffractograms of the samples with the two lowest Ca/Si ratios are largely unaffected by the curing time and neither portlandite nor calcite are observed in these samples.
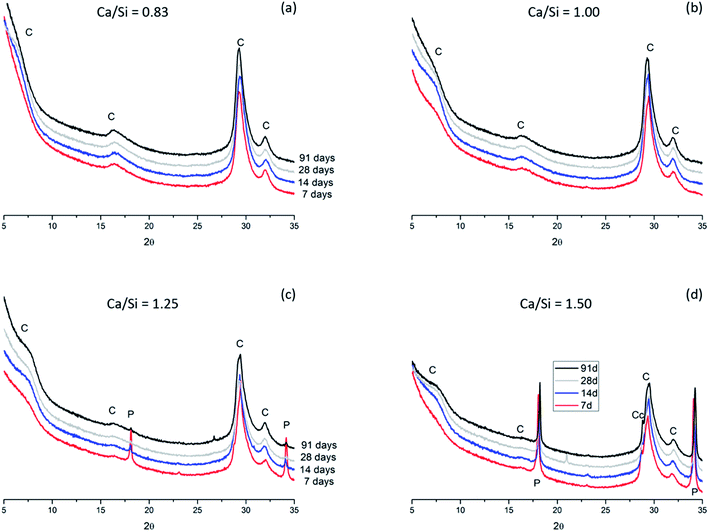 | ||
| Fig. 11 XRD diffractograms for the C–S–H samples with Ca/Si ratios of (a) 0.83, (b) 1.00, (c) 1.25, and (d) 1.50 after 7, 14, 28 and 91 days of hydration (C = C–S–H, P = portlandite, Cc = calcite). | ||
The thermogravimetric data for the samples (Fig. 12) generally supports the findings from the XRD diffractograms. However, it seems that the TGA data is slightly more sensitive towards the detection of portlandite (calcium hydroxide), which dehydroxylates between 380 and 480 °C, and this may indicate microcrystallinity of portlandite in the samples. Calcite, seen by the decarbonation peak in the range 600 to 850 °C, is not detected in significant quantities in any of the samples. However, it was not possible to measure all Ca/Si = 0.83 samples over the whole temperature range, despite several attempts, as a result of dynamic weight losses during heating above 600 °C. The origin of this issue is unclear for the actual samples, however, it may be related to the high superplasticizer content in the Ca/Si = 0.83 samples. We also note that the TGA data was acquired before the XRD measurements which may indicate that the calcite detected by XRD for the Ca/Si = 1.5 samples (Fig. 11d) has formed during sample preparation and measurement of the XRD diffractograms.
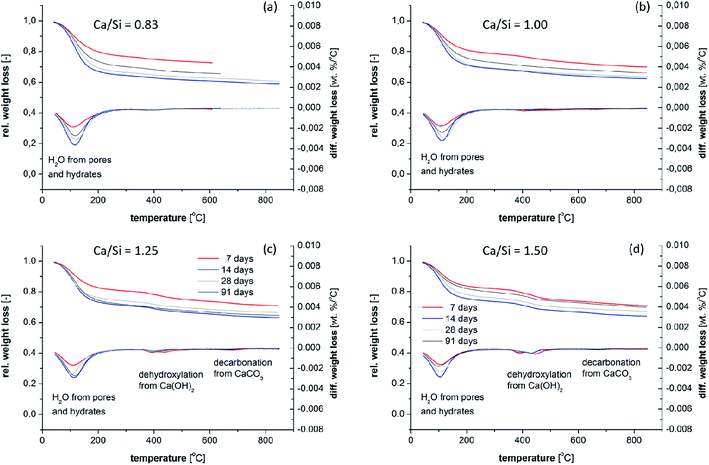 | ||
| Fig. 12 Thermogravimetric mass–loss curves for the C–S–H samples with Ca/Si ratios of (a) 0.83, (b) 1.00, (c) 1.25, and (d) 1.50, after 7, 14, 28 and 91 days of hydration. | ||
For the present samples, we expect that the TGA data cannot be used to estimate the H2O/SiO2 content of the C–S–H phases due to the sample treatment with isopropanol and the absence of a well-defined conditioning procedure for the samples. Fig. 12 shows that all samples display weight losses up to 100 °C, which suggest that the samples contain water that is either not removed during the solvent exchange or has condensed afterwards in fine pores in addition to the chemically bound water removed at higher temperatures.
In combination, Fig. 11 and 12 display the typical characteristics of synthesized C–S–H phases of different chemical composition. Microstructurally, significant variabilities are observed, in particular domains of different densities which find its analogues in the inner and outer products of hydrated cements. The characterization above reveals that the model binders capture most of the mineralogy as well as the chemical and microstructural properties of C–S–H phases in cement pastes and thereby appear to represent the intended binders quite well. The main differences between the model binders and conventional hydrated cements are the calcium gradients and density distributions in hydrated cements which reflect that anhydrous cement is dense and calcium rich. It has been suggested that unreacted cement grains improve the mechanical properties of cementitious binders65,66 and thus their absence may partially explain the relatively low compressive strengths of the model binders in this work. The compressive strength of the C–S–H phases increases with decreasing Ca/Si ratio for the binders in this work and this difference becomes more apparent during aging and has not been documented in this clarity before.
To further examine the changes in the prisms, molar volumes are calculated (Table 3) based on the weight and volume of the prisms as well as on the theoretical C–S–H compositions, utilizing the H2O/SiO2 ratios reported recently for synthesized C–S–H phases with similar Ca/Si ratios.58 The calculations show that the solid mass of the C–S–H is nearly constant and that it increases only slightly for the C–S–H samples with increasing Ca/Si ratios. Moreover, the calculated liquid masses (e.g., pore solution and gel water) are nearly constant. The calculated liquid masses include the water molecules from portlandite and water in the superplasticizer, which is assumed not to contain any solid phases and to have the same density as water. The air content is estimated to be 10 vol% for all pastes. These assumptions provide bulk C–S–H densities (Table 3) in the range expected from the literature.67,68 The calculations also provide the molar C–S–H quantity per specimen and the molar volumes, assuming the ideal C–S–H compositions in Table 3. The molar volumes decrease with decreasing Ca/Si ratio which can partly explain the improved mechanical performance of the binders with decreasing Ca/Si ratio (Fig. 13a). Haas and Nonat58 have reported calculated molar surface areas for C–S–H phases, with Ca/Si ratios in the same range as studied in this work, based on tetrahedral silicate structures in idealized minerals. Their calculated surface areas increase with decreasing Ca/Si ratio, which is similar to experimentally determined surface areas of leached C–S–H samples from SANS data and, to a lesser extent, from BET data.69,70
| CaO | SiO2 | H2O/SiO2a | Prism weight [g] | Bulk density [g cm−3] | Solid mass [g] | Liquid mass [g] | Est. air content [vol%] | Calculated C–S–H density [g cm−3] | C–S–H quantity [mol per prism] | Molar volume [cm3 mol−1] |
|---|---|---|---|---|---|---|---|---|---|---|
| a The H2O/SiO2 ratios were taken from data presented in ref. 71. | ||||||||||
| 0.83 | 1.00 | 1.25 | 75.9 | 1.45 | 46.61 | 29.33 | 10 | 2.52 | 2.56 | 145.6 |
| 1.00 | 1.00 | 1.25 | 78.1 | 1.49 | 47.24 | 30.82 | 10 | 2.81 | 2.88 | 154.0 |
| 1.25 | 1.00 | 1.50 | 77.6 | 1.49 | 47.48 | 30.14 | 10 | 2.81 | 2.83 | 172.6 |
| 1.50 | 1.00 | 1.70 | 78.4 | 1.50 | 48.14 | 30.25 | 10 | 2.78 | 2.85 | 190.3 |
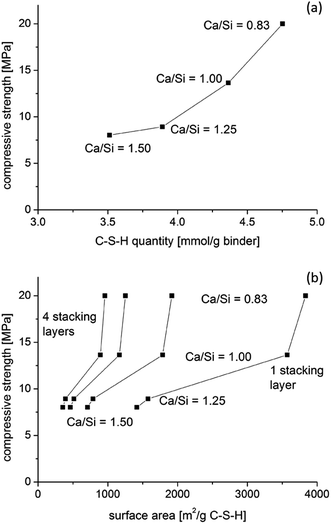 | ||
| Fig. 13 Relation between the compressive strengths and (a) the molar quantities of C–S–H assuming full hydration and (b) estimates of the surface area for 1, 2, 3 and 4 stacking layers of C–S–H for the four prisms with Ca/Si = 0.83–1.50. The estimated surface areas are relative to the masses of the solid C–S–H phases and utilize the molar surface areas for different stacking arrangements from Haas and Nonat.58 | ||
However, the actual water contents of the leached samples are not explicitly reported in these studies, and microstructural alterations can also not be excluded for the severely leached samples. The calculated surface areas for the present samples scale with the compressive strengths after 91 days (Fig. 13b), and this effect is independent of the assumed stacking thickness of the C–S–H layers. The surface areas are between 350 and 960 m2 g−1 of solids for four layers of stacked C–S–H sheets. The surface area of portlandite crystals is much smaller and thus it will reduce the overall surface area of a binder when it is present in appreciable quantities, as observed for the Ca/Si = 1.5 C–S–H binder.
Table 3 illustrates that all experimental parameters cannot be controlled at the same time since the tested samples are similar in solid and liquid contents but differ in molar quantities. Thus, samples of equal molar quantities would differ in size, or water content (water/solid ratio), and in surface area, and all of these parameters affect the mechanical properties. Recent studies on the interaction of C–S–H surfaces and ions in solution in cohesive binders predict a larger degree of cohesion for higher pH values and thus for higher Ca/Si ratios.39,41 A possible reconciliation of these findings with the experimental results of the present work may be that the increase in surface area for lower Ca/Si ratios compensates for the lower charge densities and thus the reduction of attractive forces that act between the C–S–H surfaces.
The results of the present study strongly suggest that a reduction of the Ca/Si ratio to 0.83 has a beneficial impact on the mechanical properties. This ratio is also the Ca/Si ratio for 14 Å tobermorite (Ca5Si6O16(OH)2·8H2O), which is often used as one of the model structures for C–S–H, and it is not expected that a decrease in Ca/Si ratio below this value will lead to a further increase in compressive strength. This result is particularly interesting for Portland cement incorporating substantial amounts of silicate-rich supplementary cementitious materials (SCMs) which during hydration consume portlandite and lead to the formation of C–S–H phases with lower Ca/Si ratio compared to those formed by hydration of pure Portland cement. Our findings on the macroscale show the same trend as observed by nano-indentation studies of synthesized C–S–H phases8,9 which report that the elastic modulus and hardness increase when the Ca/Si ratio of the C–S–H is decreased. Furthermore, in practical applications it is well-known that blended binders with silica fume (amorphous SiO2) result in improved mechanical performance,53 but this is commonly ascribed to improved particle packing and microstructural refinement. The present work suggests that a lowering of the Ca/Si ratio for the C–S–H by the reaction of silica fume will also contribute to the increased mechanical strength. Moreover, the so-called synergetic effect observed as an increase in strength for binders with alumino-silicate rich SCMs such as fly ash72 or metakaolin73 in combination with limestone may also partly originate from a decrease in Ca/Si ratio of the C–S–H and not solely from the formation of calcium monocaboaluminate hydrate (Ca4Al2(OH)12CO3·5H2O).
29Si NMR is the only technique employed in this work that provides insight on structural changes for the C–S–H phase, as XRD and TGA only provide information about changes in mineral quantities of portlandite and calcite. However, the mechanical properties do not relate directly to the mean silicate chain lengths of silicate tetrahedra in the C–S–H, as probed by 29Si NMR, if these data are considered for the four C–S–H samples at all studied ageing times. Finally, the data shows that C–S–H phases with lower Ca/Si ratios equilibrate over much longer time periods.
Conclusions
The compressive strengths of synthesized C–S–H phases with four different Ca/Si ratios (0.83, 1.0, 1.25 and 1.50) have been measured for ageing times up to three months. The changes in structural and mineral compositions were characterized by 29Si MAS NMR, TGA and XRD during the three months of hydration whereas the microstructure and distribution in the chemical composition were examined by backscattered electron microscopy and energy dispersive X-ray spectroscopy after ageing for three months.The experimental results show that the compressive strengths of the C–S–H pastes increase with decreasing Ca/Si ratio and are highest for the lowest Ca/Si ratio of 0.83. The analyses have revealed that the C–S–H prisms consist of C–S–H phases with the typical features expected for these minerals. Furthermore, it is found that the microstructures are very similar for the four investigated pastes and with strong analogies to Portland cement binders. The main difference is that the C–S–H prisms include calcium rich zones in proximities of surfaces of the silica particles prior to reaction whereas calcium rich, unreacted clinker grains are generally found in Portland cement binders. Structural changes for the C–S–H phases have been followed by 29Si MAS NMR and these data show that the equilibration of the microstructure proceeds over a long time period during which the mechanical properties change as well. The calculated mean silicate chain lengths cannot be directly related to the strength values although they reflect the Ca/Si ratio of the C–S–H phase. Molar volumes have been calculated which suggest that higher molar quantities of C–S–H are present for decreasing Ca/Si ratios in each specimen. The related differences in specific surface area may partly explain the higher strengths observed for C–S–H with lower Ca/Si ratio if this effect can compensate for the predicted, smaller cohesive forces in low Ca/Si ratio C–S–H phases.
Acknowledgements
We thank the Danish Strategic Research Council for financial support to the LowE-CEM project (No. 11-116724) and the Danish Council for Independent Research (Technology and Production) for the support of W. Kunther (No. DFF-4184-00114). The use of the solid-state NMR facilities at the Department of Chemistry, Aarhus University, sponsored by the Danish Council for Independent Research and the Carlsberg Foundation, is acknowledged. FLSmidth R & D Centre Dania, Mariager, Denmark, is thanked for the use of their XRD diffractometer. We thank the Electron Microscopy Center at Empa – Swiss Federal Laboratories for Materials Science and Technology in Dübendorf, Switzerland, for the use of their FEI ESEM XL30 electron microscope.References
- S. Jewell and S. M. Kimball, Mineral commodity summaries 2016, U. S. Department of the Interior and U. S. Geological Survey, Reston, Virginia, USA, 2016 Search PubMed.
- J. S. Damtoft, J. Lukasik, D. Herfort, D. Sorrentino and E. M. Gartner, Cem. Concr. Res., 2008, 38, 115–127 CrossRef CAS.
- I. G. Richardson, Cem. Concr. Res., 1999, 29, 1131–1147 CrossRef CAS.
- I. G. Richardson, Acta Crystallogr., Sect. B: Struct. Sci., Cryst. Eng. Mater., 2014, 70, 903–923 CAS.
- A. Kumar, B. J. Walder, A. Kunhi Mohamed, A. Hofstetter, B. Srinivasan, A. J. Rossini, K. Scrivener, L. Emsley and P. Bowen, J. Phys. Chem. C, 2017 DOI:10.1021/acs.jpcc.7b02439.
- European standard EN 197-1, 2012, CEN/TC 51/WG 6.
- S. Papatzani, K. Paine and J. Calabria-Holley, Constr. Build. Mater., 2015, 74, 219–234 CrossRef.
- F. Pelisser, P. J. P. Gleize and A. Mikowski, J. Phys. Chem. C, 2012, 116, 17219–17227 CAS.
- J. J. Kim, E. M. Foley and M. M. Reda Taha, Cem. Concr. Compos., 2013, 36, 65–70 CrossRef CAS.
- A. Carpinteri, Int. J. Solids Struct., 1994, 31, 291–302 CrossRef.
- Z. P. Bažant, Adv. Cem. Based Mater., 1996, 4, 128–137 CrossRef.
- B. L. Karihaloo, H. M. Abdalla and Q. Z. Xiao, Eng. Fract. Mech., 2003, 70, 979–993 CrossRef.
- P. Sukontasukkul, P. Nimityongskul and S. Mindess, Cem. Concr. Res., 2004, 34, 2127–2134 CrossRef CAS.
- X. Zhang, G. Ruiz, R. C. Yu, E. Poveda and R. Porras, Constr. Build. Mater., 2012, 30, 301–308 CrossRef.
- W. A. Cordon and H. A. Gillespie, ACI Journal Proceedings, 1963, 60, 1029–1052 Search PubMed.
- W. S. Weaver, H. L. Isabelle and F. Williamson, J. Test. Eval., 1974, 2, 260–303 CrossRef.
- R. Gaynor, Cem., Concr., Aggregates, 1993, 15, 135–144 CAS.
- G. A. Rao, Cem. Concr. Res., 2001, 31, 495–502 CrossRef CAS.
- D. Kulik, T. Wagner, S. Dmytrieva, G. Kosakowski, F. Hingerl, K. Chudnenko and U. Berner, Comput. Geosci., 2013, 17, 1–24 Search PubMed.
- D. A. Kulik, Cem. Concr. Res., 2011, 41, 477–495 CrossRef CAS.
- A. Neville, Concrete: Neville's Insights and Issues, Thomas Telford, 2006 Search PubMed.
- B. Osbæck, Cem. Concr. Res., 1985, 15, 53–64 CrossRef.
- K. Kendall, A. J. Howard, J. D. Birchall, P. L. Pratt, B. A. Proctor and S. A. Jefferis, Philos. Trans. R. Soc., A, 1983, 310, 139–153 CrossRef CAS.
- T. C. Powers, J. Am. Ceram. Soc., 1958, 41, 1–6 CrossRef CAS.
- P. Termkhajornkit, Q. H. Vu, R. Barbarulo, S. Daronnat and G. Chanvillard, Cem. Concr. Res., 2014, 56, 1–11 CrossRef CAS.
- F. H. Heukamp, F.-J. Ulm and J. T. Germaine, Cem. Concr. Res., 2003, 33, 1155–1173 CrossRef CAS.
- G. Constantinides and F.-J. Ulm, Cem. Concr. Res., 2004, 34, 67–80 CrossRef CAS.
- C. Hu and Z. Li, Cem. Concr. Compos., 2015, 57, 17–26 CrossRef CAS.
- H. Manzano, J. S. Dolado, A. Guerrero and A. Ayuela, Phys. Status Solidi A, 2007, 204, 1775–1780 CrossRef CAS.
- J. S. Dolado, M. Griebel and J. Hamaekers, J. Am. Ceram. Soc., 2007, 90, 3938–3942 CAS.
- M. J. Abdolhosseini Qomi, K. J. Krakowiak, M. Bauchy, K. L. Stewart, R. Shahsavari, D. Jagannathan, D. B. Brommer, A. Baronnet, M. J. Buehler, S. Yip, F. J. Ulm, K. J. Van Vliet and R. J. M. Pellenq, Nat. Commun., 2014, 5, 1–10 Search PubMed.
- R. Shahsavari, M. J. Buehler, R. J. M. Pellenq and F.-J. Ulm, J. Am. Ceram. Soc., 2009, 92, 2323–2330 CrossRef CAS.
- J. E. Oh, S. M. Clark, H.-R. Wenk and P. J. M. Monteiro, Cem. Concr. Res., 2012, 42, 397–403 CrossRef CAS.
- J. Moon, S. Yoon and P. J. M. Monteiro, Cem. Concr. Res., 2015, 71, 106–114 CrossRef CAS.
- J. J. Beaudoin, Cem. Concr. Res., 1983, 13, 319–324 CrossRef CAS.
- F. H. Wittmann, Cem. Concr. Res., 1986, 16, 971–972 CrossRef CAS.
- P. J. M. Monteiro and C. T. Chang, Cem. Concr. Res., 1995, 25, 1605–1609 CrossRef CAS.
- R. J. M. Pellenq, N. Lequeux and H. van Damme, Cem. Concr. Res., 2008, 38, 159–174 CrossRef CAS.
- B. Jönsson, A. Nonat, C. Labbez, B. Cabane and H. Wennerström, Langmuir, 2005, 21, 9211–9221 CrossRef PubMed.
- C. Labbez, A. Nonat, I. Pochard and B. Jönsson, J. Colloid Interface Sci., 2007, 309, 303–307 CrossRef CAS PubMed.
- C. Labbez, I. Pochard, B. Jönsson and A. Nonat, Cem. Concr. Res., 2011, 41, 161–168 CrossRef CAS.
- J. J. Beaudoin, P. Gu and R. E. Myers, Cem. Concr. Res., 1998, 28, 341–347 CrossRef CAS.
- R. Alizadeh, J. J. Beaudoin and L. Raki, Mater. Struct., 2011, 44, 13–28 CrossRef CAS.
- P. Pourbeik, J. J. Beaudoin, R. Alizadeh and L. Raki, Mater. Struct., 2015, 48, 2447–2454 CrossRef CAS.
- M. D. Jackson, S. R. Mulcahy, H. Chen, Y. Li, Q. Li, P. Cappelletti and H.-R. Wenk, Am. Mineral., 2017, 102, 1435–1450 CrossRef.
- A. C. A. Muller, K. L. Scrivener, J. Skibsted, A. M. Gajewicz and P. J. McDonald, Cem. Concr. Res., 2015, 74, 116–125 CrossRef CAS.
- J. Skibsted and M. D. Andersen, J. Am. Ceram. Soc., 2013, 96, 651–656 CAS.
- T. F. Sevelsted and J. Skibsted, Cem. Concr. Res., 2015, 71, 56–65 CrossRef CAS.
- J. Schindelin, I. Arganda-Carreras, E. Frise, V. Kaynig, M. Longair, T. Pietzsch, S. Preibisch, C. Rueden, S. Saalfeld, B. Schmid, J.-Y. Tinevez, D. J. White, V. Hartenstein, K. Eliceiri, P. Tomancak and A. Cardona, Nat. Methods, 2012, 9, 676–682 CrossRef CAS PubMed.
- H. Justnes and T. Østnor, in Calcined Clays for Sustainable Concrete, ed. K. Scrivener and A. Favier, Springer, Netherlands, 2015, pp. 51–57 Search PubMed.
- B. Mota, T. Matschei and K. Scrivener, Cem. Concr. Res., 2015, 75, 53–65 CrossRef CAS.
- R. L. Santos, R. B. Horta, J. Pereira, T. G. Nunes, P. Rocha, J. N. C. Lopes and R. Colaço, Cem. Concr. Res., 2016, 85, 39–47 CrossRef CAS.
- K. O. Kjellsen, O. H. Wallevik and M. Hallgren, Mater. Struct., 1999, 32, 63–69 CrossRef CAS.
- G. Artioli, L. Valentini, M. Voltolini, M. C. Dalconi, G. Ferrari and V. Russo, Cryst. Growth Des., 2015, 15, 20–23 CAS.
- K. L. Scrivener, Cem. Concr. Compos., 2004, 26, 935–945 CrossRef CAS.
- J. E. Rossen, B. Lothenbach and K. L. Scrivener, Cem. Concr. Res., 2015, 75, 14–22 CrossRef CAS.
- J. J. Chen, J. J. Thomas, H. F. W. Taylor and H. M. Jennings, Cem. Concr. Res., 2004, 34, 1499–1519 CrossRef CAS.
- J. Haas and A. Nonat, Cem. Concr. Res., 2015, 68, 124–138 CrossRef CAS.
- I. G. Richardson, A. R. Brough, G. W. Groves and C. M. Dobson, Cem. Concr. Res., 1994, 24, 813–829 CrossRef CAS.
- J. J. Thomas and H. M. Jennings, Cem. Concr. Res., 2006, 36, 30–38 CrossRef CAS.
- G. Parry-Jones, A. J. Al-Tayyib, S. U. Al-Dulaijan and A. I. Al-Mana, Cem. Concr. Res., 1989, 19, 228–234 CrossRef CAS.
- S. U. Al-Dulaijan, A.-H. J. Al-Tayyib, M. M. Al-Zahrani, G. Parry-Jones and A. I. Al-Mana, J. Am. Ceram. Soc., 1995, 78, 342–346 CrossRef CAS.
- I. Klur, B. Pollet, J. Virlet and A. Nonat, in Nuclear Magnetic Resonance Spectroscopy of Cement-Based Materials, ed. P. Colombet, H. Zanni, A.-R. Grimmer and P. Sozzani, Springer, Berlin, Heidelberg, 1998, pp. 119–141 Search PubMed.
- G. Renaudin, J. Russias, F. Leroux, F. Frizon and C. Cau-dit-Coumes, J. Solid State Chem., 2009, 182, 3312–3319 CrossRef CAS.
- R. F. Feldman and J. J. Beaudoin, Cem. Concr. Res., 1976, 6, 389–400 CrossRef CAS.
- B. Pichler, C. Hellmich, J. Eberhardsteiner, J. Wasserbauer, P. Termkhajornkit, R. Barbarulo and G. Chanvillard, Cem. Concr. Res., 2013, 45, 55–68 CrossRef CAS.
- A. J. Allen, J. J. Thomas and H. M. Jennings, Nat. Mater., 2007, 6, 311–316 CrossRef CAS PubMed.
- A. C. A. Muller, K. L. Scrivener, A. M. Gajewicz and P. J. McDonald, J. Phys. Chem. C, 2012, 117, 403–412 Search PubMed.
- A. Trapote-Barreira, L. Porcar, J. Cama, J. M. Soler and A. J. Allen, Cem. Concr. Res., 2015, 72, 76–89 CrossRef CAS.
- J. J. Thomas, J. J. Chen, A. J. Allen and H. M. Jennings, Cem. Concr. Res., 2004, 34, 2297–2307 CrossRef CAS.
- B. Lothenbach and A. Nonat, Cem. Concr. Res., 2015, 78, 57–70 CrossRef CAS.
- K. De Weerdt, M. B. Haha, G. Le Saout, K. O. Kjellsen, H. Justnes and B. Lothenbach, Cem. Concr. Res., 2011, 41, 279–291 CrossRef CAS.
- M. Steenberg, D. Herfort, S. L. Poulsen, J. Skibsted and J. S. Damtoft, in Proceedings of the XIII ICCC International Congress on the Chemistry of Cement, ed. A. Palomo, A. Zaragoza and J. C. López Agüi, Spain, Madrid, 2011 Search PubMed.
| This journal is © The Royal Society of Chemistry 2017 |

