DOI:
10.1039/C7TA05824A
(Paper)
J. Mater. Chem. A, 2017,
5, 19476-19484
Thermodynamics of paired charge-compensating doped ceria with superior redox performance for solar thermochemical splitting of H2O and CO2†
Received
5th July 2017
, Accepted 25th August 2017
First published on 29th August 2017
Abstract
Paired charge-compensating doped ceria (PCCD) using trivalent and pentavalent cations are evaluated as redox materials for the thermochemical splitting of H2O and CO2. The oxygen nonstoichiometries of PCCD materials with formulas of Ce0.9A0.05Nb0.05O2 (A = Y, La, Sc) and CexLa(1−x)/2Nb(1−x)/2O2 (x = 0.75, 0.95) were measured in a thermogravimetric analyzer over a range of temperatures (T = 1173–1773 K) and oxygen partial pressures (pO2 = 10−15–10−1 atm). Undoped and single element doped ceria (Ce0.9B0.1O2 where B = Y, La, Nb, Hf) served as a reference. At any given set of T and pO2, the relative reduction extent follows Ce0.9Hf0.1O2 > Ce0.9Sc0.05Nb0.05O2 > Ce0.9Y0.05Nb0.05O2 > CexLa(1−x)/2Nb(1−x)/2O2 > CeO2 > solely trivalent or pentavalent doped ceria. The partial molar reduction enthalpies were determined using Van't Hoff analysis coupled to defect modeling and range from 360 to 410 kJ mol−1. A system efficiency model predicts that these PCCD materials have the potential of achieving high solar-to-fuel energy conversion efficiencies because of their balanced reduction and oxidation properties. Ce0.9Y0.05Nb0.05O2 in particular can outperform undoped ceria and reach efficiency values of 31% and 28% for H2 and CO production, respectively.
1. Introduction
The thermochemical splitting of H2O and CO2via two-step redox cycles driven by concentrated solar energy is a favorable thermodynamic pathway to produce renewable fuels, because it uses the entire solar spectrum to generate H2/CO and O2 in separate steps.1–3 Nonstoichiometric ceria has emerged as the benchmark redox material mainly due to its fast kinetics and morphological stability4–8 even after hundreds of consecutive redox cycles.9 The redox cycle is represented by:
Reduction:
| |  | (1) |
Oxidation:
| | | CeO2−δred + (δred − δox)H2O → CeO2−δox + (δred − δox)H2 | (2a) |
| | | CeO2−δred + (δred − δox)CO2 → CeO2−δox + (δred − δox)CO | (2b) |
It consists of an endothermic reduction step (eqn (1)) followed by an exothermic oxidation step with H2O and CO2 at lower temperatures (eqn (2a) and (2b), respectively). The difference in the reduction extent, given by the change in the nonstoichiometry Δδ = δred − δox, determines the specific amount of H2 and CO produced per cycle and mole of ceria, and depends on the reaction temperature (T) and the oxygen partial pressure (pO2) of each step. The technical feasibility of this cycle has been experimentally demonstrated with a 5 kW solar reactor, yielding high selectivity, stability, mass conversion and solar-to-fuel energy efficiency.10 However, due to its relatively low reducibility, pure ceria requires T > 1773 K and pO2 < 10 mbar to achieve even moderate values of Δδ. Doping ceria with tetravalent transition metals such as Zr4+ (ref. 11–16) and Hf4+ (ref. 14 and 17) increases Δδ under the same T and pO2, while other dopants fail to do so.1,11,14,17–25 Hercynite and selected perovskites, e.g. Sr- and Mn-doped LaAlO3, have lower reduction enthalpies and therefore achieve higher reduction extents,26–28 but they suffer from less favorable oxidation thermodynamics, which leads to lower specific fuel yields under most conditions.29 Therefore, the search continues for metal oxides which balance the energetics of reduction and oxidation to yield high solar-to-fuel energy conversion efficiencies.
Density function theory (DFT) simulations suggest that non-reducing tetravalent cations with ionic radii between those of Ti and Ce should be doped into the host lattice of ceria to improve its redox performance.30 No single element other than Zr and Hf exists which meets the criteria for improving ceria performance.31 Interestingly, by using paired charge-compensating dopants (PCCD), aliovalent cations can be made to mimic tetravalent dopant behavior.32 Specifically, by co-doping ceria with trivalent and pentavalent cations (+3/+5), the trivalent cation exhibits tetravalent like behavior. DFT predicts that the +3/+5 PCCDs have reduction energies between those of pure ceria and Hf/Zr doped ceria, resulting in a desirable trade-off between reducibility and oxidizability. However, a thermodynamic analysis for these promising PCCD redox materials has not been performed to date.
In this work, we thermodynamically characterize Ce0.9A0.05Nb0.05O2 (A = Y, La, Sc) and CexLa(1−x)/2Nb(1−x)/2O2 (x = 0.75, 0.95) and compare their redox performance to undoped and single element doped ceria (Ce0.9B0.1O2 where B = Y, La, Nb, Hf). We determine their partial molar reduction enthalpies and entropies using a Van't Hoff analysis. The thermodynamic properties are subsequently used in a system efficiency model to calculate the solar-to-fuel energy conversion efficiency.
2. Methods
2.1 Materials synthesis
Powders of Ce0.9A0.05Nb0.05O2 (A = Y, La, Sc), CexLa(1−x)/2Nb(1−x)/2O2 (x = 0.75, 0.95), and Ce0.9B0.1O2 (B = Y, La, Nb, Hf) were produced by a modified Pechini method.14 For the sake of clarity, abbreviations are used for the materials according to ABX where A is the first dopant, B is the second dopant and X is the concentration of each dopant, i.e. LaNb5 stands for Ce0.9La0.05Nb0.05O2. For the synthesis of doped ceria samples, citric acid (Sigma-Aldrich, 99%) and the desired metal nitrates or chlorides were dissolved in a 3![[thin space (1/6-em)]](https://www.rsc.org/images/entities/char_2009.gif) :
:![[thin space (1/6-em)]](https://www.rsc.org/images/entities/char_2009.gif) 2 molar ratio in anhydrous ethylene glycol (Sigma-Aldrich, 99.8%) with an approximate citric acid to ethylene glycol mass ratio of 1
2 molar ratio in anhydrous ethylene glycol (Sigma-Aldrich, 99.8%) with an approximate citric acid to ethylene glycol mass ratio of 1![[thin space (1/6-em)]](https://www.rsc.org/images/entities/char_2009.gif) :
:![[thin space (1/6-em)]](https://www.rsc.org/images/entities/char_2009.gif) 15. In the case of Hf10, deionized water was used as the solvent. The metal salts used were cerium(III) nitrate hexahydrate (Sigma-Aldrich, 99%), lanthanum(III) nitrate hexahydrate (Alfa Aesar, 99.9%), yttrium(III) nitrate hexahydrate (Strem, 99.5%), scandium(III) nitrate pentahydrate (Strem, 99.5%), niobium(V) chloride (Strem, 99%) and hafnium(IV) chloride (Alfa Aesar, 98%). The mixtures were stirred for 2 hours at 363 K on a magnetic hotplate. The temperature was then gradually increased until the ethylene glycol reaction mixture self-ignited and a powder was formed. The powders were calcined at 1273 K for 1 hour with an initial heating rate of 5 K min−1. Subsequently, the powders were uni-axially cold-pressed under 5 tons into dense cylindrical pellets with a diameter of 8 mm. The pellets were then sintered at 1773 K for 5 hours. The high sintering temperature was used to ensure that the pellet would not melt during cycling and to assess whether the dopant cations segregated at high temperatures.
15. In the case of Hf10, deionized water was used as the solvent. The metal salts used were cerium(III) nitrate hexahydrate (Sigma-Aldrich, 99%), lanthanum(III) nitrate hexahydrate (Alfa Aesar, 99.9%), yttrium(III) nitrate hexahydrate (Strem, 99.5%), scandium(III) nitrate pentahydrate (Strem, 99.5%), niobium(V) chloride (Strem, 99%) and hafnium(IV) chloride (Alfa Aesar, 98%). The mixtures were stirred for 2 hours at 363 K on a magnetic hotplate. The temperature was then gradually increased until the ethylene glycol reaction mixture self-ignited and a powder was formed. The powders were calcined at 1273 K for 1 hour with an initial heating rate of 5 K min−1. Subsequently, the powders were uni-axially cold-pressed under 5 tons into dense cylindrical pellets with a diameter of 8 mm. The pellets were then sintered at 1773 K for 5 hours. The high sintering temperature was used to ensure that the pellet would not melt during cycling and to assess whether the dopant cations segregated at high temperatures.
2.2 Materials characterization
Powder X-ray diffraction (PXRD) was used to determine the phases present and was performed on a STOE STADI P diffractometer in transmission mode with Cu-Kα radiation, a Ge-monochromator, and a Mythen 1K detector. Compositions of all materials were examined by ICP-OES analysis performed on a Icap-6500 Dual View (Thermo Instruments). For ICP-OES analysis, powders of the materials were dissolved for 10 hours in H2SO4 followed by hydrolysis with HCl addition. X-ray photoelectron spectroscopy (XPS) was performed on a PhI5000 VersaProbe (ULVAC-PHI, INC.). Spectra were acquired at a base pressure of 5 × 10⁻⁸ Pa using a focused scanning monochromatic Al-Kα source (1486.6 eV) with a spot size of 200 μm scanning a 500 × 1000 μm area.
Sample surfaces were analyzed before and after thermogravimetric analysis (TGA) by scanning electron microscopy (SEM, Hitachi TM-1000, 15 kV accelerating voltage). The oxygen nonstoichiometry of the materials was measured by thermogravimetric analysis (Setaram Setsys Evolution). The samples, with masses ranging between 220–373 mg, were suspended from the balance with a custom-made platinum hook to eliminate mass transfer limitations. The gas atmosphere in the TGA was controlled by varying the gas flow rates of Ar (Messer, Ar 4.6), O2/Ar (500 ppm, 0.5 or 50 mol% O2 balance Ar, Messer, 5.0), CO2 (Messer, 4.6) and CO/CO2 (30/70 mol%, Messer 5.0). Gas flows were adjusted using electronic mass flow controllers (Brooks, Model 5850TR, accuracy ± 1%). Buoyancy effects were accounted for by subtracting a blank run (Al2O3 pellet) which was conducted under the same conditions as the measurements. TGA experiments were conducted in the temperature range of T = 1173–1773 K at oxygen partial pressure ranges of pO2 = 1.6 × 10⁻¹⁵–5.0 × 10⁻¹ atm (T = 1573–1723 K and pO2 = 10−5–10−2 atm for La10, Y10, and Nb10). To determine the reduction extent at a specified T and pO2, samples were heated to the set point temperatures followed by isothermal reduction and oxidation induced by rapidly changing the pO2 and allowing a new equilibrium state to be reached. In between two measurement temperatures, samples were cooled to 1073 K under the highest pO2 that was used in the respective experiment in order to fully reoxidize it; this point served as a baseline to account for any TGA drift.
2.3 Efficiency model
The solar-to-fuel energy conversion efficiency, ηsolar-to-fuel, is defined as the ratio of the heating value of the fuel produced to the sum of the solar radiative energy input and additional parasitic energy inputs. ηsolar-to-fuel was calculated for H2 and CO production with an in-house MATLAB code, following the system efficiency model described by Ehrhart et al.33 This system model accounts for the solar radiative input and heat sinks in an ideal continuous solar reactor under thermodynamic equilibrium, including optical solar concentration losses, re-radiation losses, reduction enthalpies, O2 removal, solids and gas heating, gaseous product separation, mechanical work, and heat-to-work efficiencies, as well as heat recovery of solids, O2, unreacted H2O and CO2, and the exothermic oxidation. The baseline parameters for the efficiency calculation are listed in Table 1.
Table 1 Baseline parameters for the system efficiency model
|
|
CO2 |
H2O |
| Reduction temperature |
1773 K |
1773 K |
| Reduction pressure |
1 Pa |
1 Pa |
| Product yield |
100% |
∼100% |
| Product flow rate |
1 mol s−1 |
1 mol s−1 |
| Purity CO, H2 |
0.99 |
0.999 |
| Product separation temperature |
300 K |
300 K |
| Product separation efficiency |
0.1 |
1 |
| Heat recovery gas efficiency |
0.9 |
0.9 |
| Oxygen removal efficiency |
0.1 |
0.1 |
| Mechanical efficiency |
0.15 |
0.15 |
| Optical efficiency |
0.9 |
0.9 |
| Solar concentration ratio |
3000 |
3000 |
| DNI |
1 kW m−2 |
1 kW m−2 |
| Absorptivity |
0.95 |
0.95 |
3. Experimental results and discussion
3.1 Materials characterization
The fabrication of the PCCD materials was successful as dopant concentrations were within 1 mol% of the nominal values, as determined by ICP-OES. We therefore keep the nominal notation in the following. Targeted elemental concentrations and values measured by ICP-OES are shown in Table 2.
Table 2 Targeted and measured material compositions of the synthesized materials in mol%
| Material |
Element |
Ce |
Hf |
La |
Y |
Sc |
Nb |
| YNb5 |
Targeted |
90.0 |
|
|
5.0 |
|
5.0 |
| Measured |
89.6 |
|
|
5.0 |
|
5.4 |
| ScNb5 |
Targeted |
90.0 |
|
|
|
5.0 |
5.0 |
| Measured |
90.0 |
|
|
|
4.4 |
5.5 |
| LaNb5 |
Targeted |
90.0 |
|
5.0 |
|
|
5.0 |
| Measured |
89.8 |
|
5.1 |
|
|
5.0 |
| LaNb2.5 |
Targeted |
95.0 |
|
2.5 |
|
|
2.5 |
| Measured |
95.0 |
|
2.5 |
|
|
2.5 |
| LaNb12.5 |
Targeted |
75.0 |
|
12.5 |
|
|
12.5 |
| Measured |
75.1 |
|
11.5 |
|
|
13.3 |
| Hf10 |
Targeted |
90.0 |
10.0 |
|
|
|
|
| Measured |
90.5 |
9.5 |
|
|
|
|
| La10 |
Targeted |
90.0 |
|
10.0 |
|
|
|
| Measured |
90.0 |
|
10.0 |
|
|
|
| Nb10 |
Targeted |
90.0 |
|
|
|
|
10.0 |
| Measured |
89.7 |
|
|
|
|
10.3 |
| Y10 |
Targeted |
90.0 |
|
|
10.0 |
|
|
| Measured |
90.2 |
|
|
9.8 |
|
|
PXRD patterns show that all of the synthesized materials are phase pure and exhibit the fluorite structure in line with undoped ceria. Slight 2θ shifts are attributed to the differences in ionic radii and the resulting slight differences in lattice parameters. The lattice parameters of all materials, calculated based on PXRD patterns, are shown in Table 3. No structural changes were observed after the TGA runs. The PXRD patterns of YNb5 before and after TG analysis are shown in Fig. 1 along with the PXRD patterns of Hf10, LaNb5, and ScNb5 after TG analysis and a pure ceria reference. All PXRD patterns are shown in Fig. S1 (ESI†). The mean surface oxidation states of Ce, Y, and Nb were estimated by XPS for the YNb5 sample before TG analysis, as well as for the YNb5, Y10 and Nb10 samples after TG. The cerium cations are present in both, 3+ and 4+ oxidation state in all samples which we attributed to the fact that the samples are partly reduced since the XPS analysis is conducted under vacuum. Y cations are present in the only possible oxidized state of 3+. Nb cations, which nominally adopt 2+, 4+ and 5+ oxidation states, exhibit binding energy peaks for energy levels that correspond to an oxidation state of 5+, as shown in Fig. 2. Overall, XPS analysis indicates that Nb and Y behave as 3+/5+ dopants which do not change oxidation states after cycling. In the SEM images taken before and after TG analysis, we observed an increased average grain size and fewer pores due to sintering during TGA experiments, as shown for YNb5 in Fig. 3. Images of all of the materials are shown in Fig. S2 (ESI†).
Table 3 Lattice parameters in Å before and after TG analysis. Values are calculated based on PXRD patterns
| [Å] |
CeO2 (ref) |
YNb5 |
ScNb5 |
LaNb5 |
LaNb2.5 |
LaNb12.5 |
La10 |
Y10 |
Nb10 |
Hf10 |
| Before TGA |
5.409 |
5.412 |
— |
5.421 |
— |
— |
5.456 |
5.416 |
5.417 |
5.389 |
| After TGA |
5.409 |
5.411 |
5.410 |
5.423 |
5.424 |
5.432 |
5.452 |
5.415 |
5.422 |
5.392 |
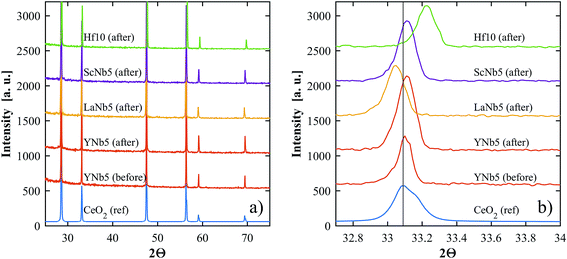 |
| | Fig. 1 (a) PXRD patterns of YNb5 before and after TG analysis, and Hf10, LaNb5, and ScNb5 after TG analysis. A reference pattern of undoped ceria is included for comparison. (b) Shows a close up of the peaks around 33.1°. | |
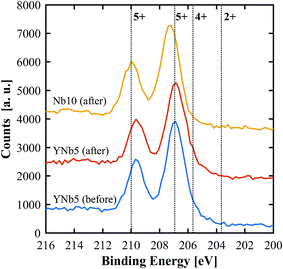 |
| | Fig. 2 XPS spectra of Nb 3d for YNb5 before and after TG analysis as well as Nb10 after TG analysis. Reference binding energies (dotted lines) for Nb2O5 (5+), NbO2 (4+) and NbO (2+) were taken from Bahl et al.34 and Özer et al.35 | |
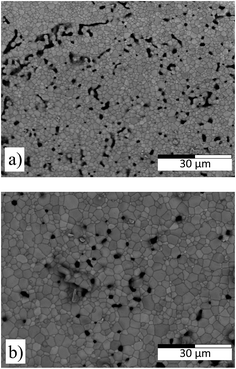 |
| | Fig. 3 SEM images of the YNb5 sample surface before (a) and after (b) TG analysis. | |
3.2 Thermogravimetric analysis
The oxygen nonstoichiometries as a function of T and pO2 were determined by TGA. An exemplary set of thermogravimetric measurements in the range T = 1573–1723 K and pO2 = 2.5 × 10⁻⁵–2.5 × 10⁻⁴ atm is shown in Fig. 4. The mass changes are due to reduction and oxidation, and are calculated relative to the sample mass after stabilization at 1073 K. As the sample is heated from 1073 K to the desired T, the mass decreases and reaches equilibrium, after which pO2 is rapidly altered. Hf doped ceria exhibits the largest mass change followed by the PCCD materials. All TGA measurements are shown in Fig. S3 (ESI†).
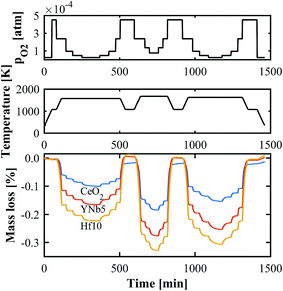 |
| | Fig. 4 Exemplary TGA run for CeO2, YNb5 and Hf10 at T = 1573–1723 K and pO2 = 2.5 × 10⁻⁵–2.5 × 10⁻⁴ atm. | |
The reduction extent is given by:  , where Δm is the relative weight loss at equilibrium calculated relative to the stabilization at 1073 K, ms is the sample mass, Ms is the molar mass of the sample, Mo is the molar mass of atomic oxygen, and δref is the nonstoichiometry at T = 1073 K and pO2 = 0.5 atm. Because of the small Δm induced by altering pO2 in the range 2.5 × 10⁻⁴–5.0 × 10⁻¹ atm at 1073 K (Δδref < 0.0011 for ScNb5; Δδref < 0.0003 for the other materials), the sample is assumed to be fully oxidized under these T and pO2 conditions, i.e. δref ≈ 0. Thus, we assume that Δδ = δ except for La10 and Y10 which have a starting nonstoichiometry of δ0 = 0.05 because trivalent dopants induce one intrinsic oxygen vacancy for every two dopant atoms. For easier comparison, the reduction extents of La10 and Y10 are plotted with a starting reduction extent of zero but the intrinsic oxygen vacancies were considered when fitting the data to a defect model, as discussed later. The reduction extents of all investigated materials are shown in Fig. 5a at T = 1723 K and pO2 = 2.5 × 10⁻⁴–4.8 × 10⁻³ atm. Similar plots are provided in Fig. S4 (ESI†) for T = 1173–1773 K and pO2 = 10−15–10−1 atm.
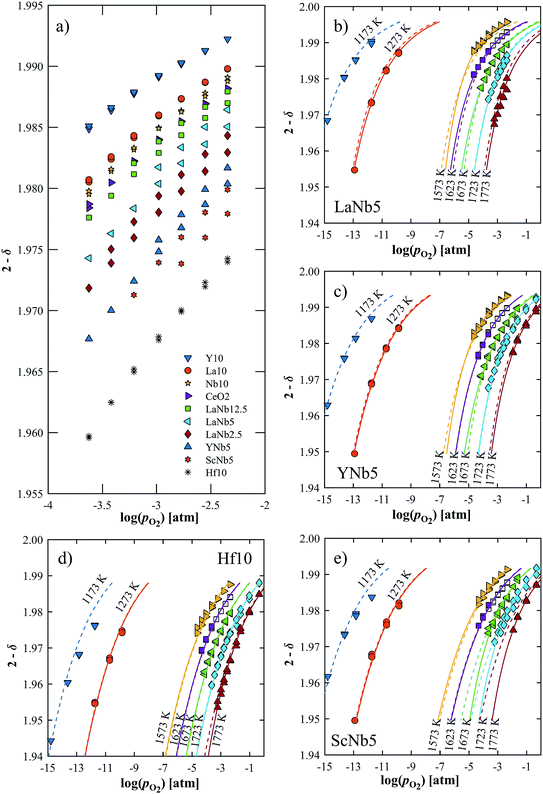 |
| | Fig. 5 (a) Oxygen nonstoichiometry at 1723 K in the range pO2 = 2.5 × 10⁻⁴–4.8 × 10⁻³ atm. (b–e) Measured nonstoichiometry (symbols) of (b) LaNb5, (c) YNb5, (d) Hf10 and (e) ScNb5 as a function of log(pO2). Closed symbols indicate this work while open symbols are taken from ref. 32. Solid lines show the predicted nonstoichiometry based on isothermally derived equilibrium constants; the dashed lines are based on the inversed temperature dependence of ln(K1) and ln(K2). | |
Δδ depends on composition and dopant concentration, with relative reduction extents following the trend Ce0.9Hf0.1O2 > Ce0.9Sc0.05Nb0.05O2 > Ce0.9Y0.05Nb0.05O2 > CexLa(1−x)/2Nb(1−x)/2O2 > CeO2 > Ce0.9Nb0.1O2 > Ce0.9La0.1O2 > Ce0.9Y0.1O2. The reduction extent of LaNb doped ceria decreases with increasing dopant concentration. However, at 1173 K and 1273 K, the reduction extent of LaNb2.5 is between that of LaNb12.5 and LaNb5, with the caveat that at these temperatures the differences are small.
3.3 Thermodynamic properties
The partial molar enthalpy and entropy are determined to predict the redox performance under conditions other than those experimentally studied. A defect model is employed to interpolate/extrapolate δ(T, pO2). For small reduction extents, a dilute species behavior is generally assumed36–38 and the reduction of pure ceria can be described in Kröger–Vink notation as:37| |  | (3) |
where  indicates a Ce4+ cation on a cerium lattice site,
  an O2− anion on an oxygen lattice site,
  a Ce3+ cation on a cerium lattice site and
  a vacancy on an oxygen lattice site that has a 2+ charge to maintain charge neutrality. Here we note just for clarity that no positive charge actually localizes on the O vacancy,39 and the notation is merely a useful charge book-keeping tool. The assumed equilibrium relationship for point defects is:
| |  | (4) |
A site balance for cerium and oxygen leads to:
| |  | (5) |
| |  | (6) |
where
y is the total dopant concentration. In addition to the site balance, the total charge of the system must remain neutral, and therefore the charge balance depends on the oxidation state of the dopant in addition to the number of vacancies and Ce
3+ ions. It is written as:
| |  | (7) |
where
β equals 1 for trivalent dopants, 0 for tetravalent PCCD materials and −1 for pentavalent dopants. However, the isolated Ce
3+ and

model does not adequately describe the nonstoichiometry behavior.
40 The consideration of additional reactions is required, specifically defect species clustering according to:
41| |  | (8) |
resulting in two equilibrium constants:
| |  | (9) |
| |  | (10) |
We tested this model by using a least squares method to determine K1 and K2 simultaneously for our experimental data. The combination of the point and cluster defect models describes accurately the nonstoichiometry of our materials. K1 for tetravalent dopants (β = 0) was used for all materials except Y10 and La10 where the point defect model for trivalent dopants (β = 1) was used. Although the Nb cations in Nb10 are pentavalent dopants, the pentavalent model did not fit the experimental data; however, the tetravalent model exhibits good agreement to the experimental data. This suggests that the additional electron of Nb does not significantly alter the reduction behavior of ceria. The fit of the defect models to the nonstoichiometry data of the 5 mol% PCCD materials and Hf10 are shown in Fig. 5b–e.
A linear correlation between ln(K) and 1/T is applied to expand the temperature range. We used a least squares approach to linearly fit the isothermally determined equilibrium constants calculated from the experimental data by assuming a constant standard enthalpy change over the investigated temperature range. A comparison of the experimentally derived and the fitted equilibrium constants is shown in Fig. 6 for YNb5. All plots are shown in Fig. S5.†
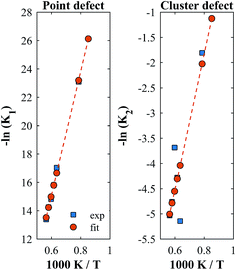 |
| | Fig. 6 Equilibrium constants for YNb5. The squares are isothermally derived values, the dots are based on a linear fit in the Van't Hoff plot. | |
Although fitted and experimentally determined equilibrium constants occasionally differ, we found that the fit to the experimental data is good and the difference in resulting reduction thermodynamics and nonstoichiometries is comparably small. As seen in Fig. 5, the predicted nonstoichiometries based on the fitted equilibrium constants show good agreement with experimental data even when extrapolated to temperatures that were not considered in the fitting process such as T = 1173 K, which was explicitly excluded from the Van't Hoff analysis for comparison purposes. By using the fitted equilibrium constants, the influence of random errors is reduced and the extracted data is smoothened. In general, values for K2 are several orders of magnitude larger than those for K1, implying that oxygen vacancies preferentially form defect clusters, as found both experientially and in atomistic models.39,42–45 Only in the case of Hf10, Y10, and ScNb5 are K2 and K1 of the same order of magnitude. While these models accurately reproduce the nonstoichiometric data, eqn (9) and (10) do not necessarily represent the reaction mechanism.
The standard Gibbs free energy for the reduction is given by:
| |  | (11) |
assuming unity for the solids activity and ideal gas behavior for oxygen. At constant
δ, and further assuming that the thermodynamic properties are independent of temperature in the investigated range, the Gibbs free energy is also given by:
| |  | (12) |
where
G0,
H0 and
S0 are the standard partial molar Gibbs free energy, enthalpy and entropy, respectively. Combining
eqn (11) and
(12) leads to:
| |  | (13) |
where
pO2 (
T,
δ) is obtained from the defect model.
H0 and
S0 were then determined by linear regression from
pO2 and 1/
T at constant
δ. An example is shown for YNb5 in
Fig. 7 in the ranges
T = 1173–1723 K and
δ = 0.010–0.032. The extracted
H0 is plotted in
Fig. 8a.
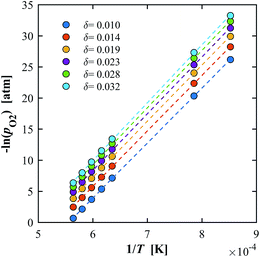 |
| | Fig. 7 Van't Hoff plot for YNb5 showing the linear correlation between –ln(pO2) and 1/T for δ = 0.01–0.032. Constant δ values were calculated for T in the range 1173–1773 K. | |
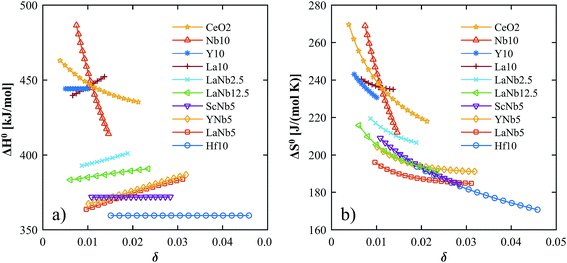 |
| | Fig. 8 Partial molar enthalpy (a) and entropy (b) as a function of the nonstoichiometry for all investigated materials. | |
The H0's of the PCCD materials are between that of Hf10 and pure ceria, consistent with DFT predictions.32 The PCCD materials exhibit a constant or slightly increasing H0 with increasing reduction extent. The values for the 5% double-doped materials are very close to one another whereas LaNb12.5 and LaNb2.5 exhibit higher values. The H0's for the trivalent (La10, Y10) and pentavalent (Nb10) doped materials are similar to that of pure ceria. This result is not surprising, given that singly trivalent and pentavalent dopants are expected to behave similarly to ceria.17,30,46,47 The trends for the partial molar entropy are very similar to those of the partial molar enthalpy and are shown in Fig. 8b. S0 of the double doped materials is slightly higher than Hf10 whereas S0 of the trivalent and pentavalent single doped materials is in the order of pure ceria. For all investigated materials, S0 decreases with increasing reduction extent. A comparison of the partial molar enthalpy and entropy calculated in this work to literature values for pure and Zr doped ceria at δ = 0.012 is shown in Table 4.
Table 4 Partial molar enthalpy and entropy for δ = 0.012 calculated in this work and literature values for pure and Zr doped ceria
|
|
ΔH0 [kJ mol−1] |
ΔS0 [J mol−1 K−1] |
|
Values taken at δ = 0.015.
Values taken at δ = 0.010.
|
| CeO2 (this work) |
444 |
234 |
| CeO2 (Panlener)37 |
467 |
251 |
| Zr5 (Takacs)13 |
407 |
226 |
| Hf10 |
360a |
200a |
| Nb10 |
436 |
228 |
| Y10 |
444b |
231b |
| La10 |
449 |
236 |
| YNb5 |
368 |
201 |
| ScNb5 |
372 |
207 |
| LaNb5 |
366 |
192 |
| LaNb2.5 |
395 |
213 |
| LaNb12.5 |
386 |
202 |
In general, thermodynamic data in the high temperature range relevant for solar thermochemical gas splitting remain scarce and most partial molar properties are extracted from nonstoichiometry data at lower temperatures.12,37,40,46,48 However, we found that the temperature range of the evaluated data has a large influence on the calculated H0. In the case of pure ceria, the slope of the derived partial molar enthalpy varies significantly when calculated based on the temperature ranges of 1273–1773 K or 1573–1773 K, as seen in Fig. 9. This is true not only for the experimental data gathered in this work but also for data extracted from Panlener et al.,37 which indicates the sensitivity of the slope of a constant δ line in the Van't Hoff plot when there are few data points for the linear regression. The beneficial influence of a wider temperature range on the extracted thermodynamic properties was also pointed out by Bork et al.49 who uses a database including a wide range of literature data to obtain a higher statistically accuracy.
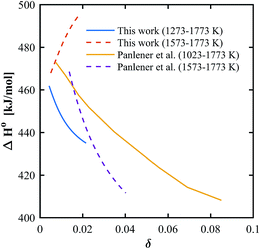 |
| | Fig. 9 Partial molar enthalpy for pure ceria based on experimental data in different temperature ranges, using experimental data from this work and experimental data from Panlener et al.37 | |
3.4 Efficiency
The above determined partial molar properties were used to calculate the ηsolar-to-fuel of the PCCD materials. Zr5 (ref. 13) and pure ceria37 were included as references. Fig. 10 shows ηsolar-to-fuel as a function of the temperature swing between reduction and oxidation. The PCCD materials reach a maximum ηsolar-to-fuel in the range 22–31% for a temperature swing between the reduction and oxidation steps of ΔT = 200–300 K for H2O and ΔT = 250–400 K for CO2. An optimal temperature arises because the energy demand for steam evaporation and CO2 separation dominate at lower temperature swings while the energy requirements for heating of the solids dominate at larger temperature swings. YNb5 reaches the highest ηsolar-to-fuel of 31% and 28% for H2 and CO production, respectively, compared to 26% and 24% achieved by undoped ceria and 29% and 26% by Zr doped ceria. The optimal temperature swings for the PCCD materials are between those of Zr-doped and undoped ceria as their reduction enthalpies are between that of Zr and pure ceria. Values of ηsolar-to-fuel for undoped ceria based on our calculated partial molar properties are in good agreement with those using thermodynamic values from literature.37ηsolar-to-fuel for all investigated materials is shown in Fig. S6.†
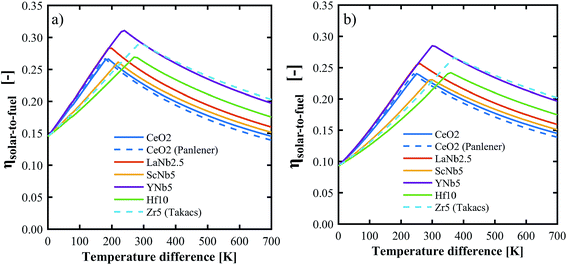 |
| | Fig. 10 Solar-to-fuel energy conversion efficiency for the production of H2 (a) and CO (b) as a function of the temperature swing between reduction and oxidation. Thermodynamic data for CeO2 and Zr5 are from ref. 37 and 13 respectively. System parameters are listed in Table 1. | |
4. Conclusions
We fabricated, characterized, and experimentally determined the thermodynamic properties of paired charge-compensating doped ceria (PCCD), namely: ScNb5, YNb5, LaNb2.5, LaNb5, and LaNb12.5. We further compared their redox performance to single doped Y10, La10, Nb10, and Hf10. We found that the PCCD materials are phase pure and stable over multiple redox cycles. Their partial molar reduction enthalpies are between those of Hf doped ceria and pure ceria, and the values are sensitive to the temperature range in which the nonstoichiometry data is evaluated. By using a wide range of temperatures and pressures, we achieved a good match between the predicted and experimentally determined nonstoichiometries. A system efficiency model indicated that PCCD materials can improve the redox performance of ceria, in contrast to doping with the individual components. PCCD materials require smaller temperature swings between reduction and oxidation than Zr doped ceria. The highest solar-to-fuel energy conversion efficiency was obtained by YNb5 for a reduction temperature of 1773 K and oxidation temperatures of 1473–1523 K. Overall, this analysis shows that the PCCD materials are promising for solar thermochemical redox cycles.
Conflicts of interest
The authors declare no conflicts of interest.
Acknowledgements
We gratefully acknowledge the financial support by the Swiss National Science Foundation (Project REDOX – Grant No. 200021_162435), the Swiss State Secretariat for Education, Research and Innovation (Grant No. 15.0330), the EU's Horizon 2020 research and innovation program (Project SUN-to-LIQUID – Grant No. 654408), the European Research Council Advanced Grant (Project SUNFUELS – Grant No. 320541), and the University of Zurich Research Priority Program for Solar Light to Chemical Energy Conversion (LightChEC).
References
- C. L. Muhich, B. D. Ehrhart, I. Al-Shankiti, B. J. Ward, C. B. Musgrave and A. W. Weimer, Wiley Interdiscip. Rev.: Energy Environ., 2016, 5, 261–287 CrossRef CAS.
- M. Romero and A. Steinfeld, Energy Environ. Sci., 2012, 5, 9234–9245 CAS.
- A. Steinfeld, Sol. Energy, 2005, 78, 603–615 CrossRef CAS.
- S. Abanades and G. Flamant, Sol. Energy, 2006, 80, 1611–1623 CrossRef CAS.
- J. R. Scheffe and A. Steinfeld, Mater. Today, 2014, 17, 341–348 CrossRef CAS.
- N. Knoblauch, L. Dorrer, P. Fielitz, M. Schmucker and G. Borchardt, Phys. Chem. Chem. Phys., 2015, 17, 5849–5860 RSC.
- N. Gokon, S. Sagawa and T. Kodama, Int. J. Hydrogen Energy, 2013, 38, 14402–14414 CrossRef CAS.
- X. Gao, A. Vidal, A. Bayon, R. Bader, J. Hinkley, W. Lipinski and A. Tricoli, J. Mater. Chem. A, 2016, 4, 9614–9624 CAS.
- W. C. Chueh, C. Falter, M. Abbott, D. Scipio, P. Furler, S. M. Haile and A. Steinfeld, Science, 2010, 330, 1797–1801 CrossRef CAS PubMed.
- D. Marxer, P. Furler, M. Takacs and A. Steinfeld, Energy Environ. Sci., 2017, 10, 1142–1149 CAS.
- S. Abanades, A. Legal, A. Cordier, G. Peraudeau, G. Flamant and A. Julbe, J. Mater. Sci., 2010, 45, 4163–4173 CrossRef CAS.
- M. Kuhn, S. R. Bishop, J. L. M. Rupp and H. L. Tuller, Acta Mater., 2013, 61, 4277–4288 CrossRef CAS.
- M. Takacs, J. R. Scheffe and A. Steinfeld, Phys. Chem. Chem. Phys., 2015, 17, 7813–7822 RSC.
- Q.-L. Meng, C.-i. Lee, T. Ishihara, H. Kaneko and Y. Tamaura, Int. J. Hydrogen Energy, 2011, 36, 13435–13441 CrossRef CAS.
- B. Bulfin, L. Hoffmann, L. de Oliveira, N. Knoblauch, F. Call, M. Roeb, C. Sattler and M. Schmucker, Phys. Chem. Chem. Phys., 2016, 18, 23147–23154 RSC.
- B. Bulfin, F. Call, J. Vieten, M. Roeb, C. Sattler and I. V. Shvets, J. Phys. Chem. C, 2016, 120, 2027–2035 CAS.
- J. R. Scheffe, R. Jacot, G. R. Patzke and A. Steinfeld, J. Phys. Chem. C, 2013, 117, 24104–24114 CAS.
- Q.-L. Meng, C.-i. Lee, S. Shigeta, H. Kaneko and Y. Tamaura, J. Solid State Chem., 2012, 194, 343–351 CrossRef CAS.
- H. Kaneko, H. Ishihara, S. Taku, Y. Naganuma, N. Hasegawa and Y. Tamaura, J. Mater. Sci., 2008, 43, 3153–3161 CrossRef CAS.
- W. C. Chueh and S. M. Haile, ChemSusChem, 2009, 2, 735–739 CrossRef CAS PubMed.
- Q. Jiang, G. Zhou, Z. Jiang and C. Li, Sol. Energy, 2014, 99, 55–66 CrossRef CAS.
- E. V. Ramos-Fernandez, N. R. Shiju and G. Rothenberg, RSC Adv., 2014, 4, 16456–16463 RSC.
- A. Le Gal, S. Abanades, N. Bion, T. Le Mercier and V. Harlé, Energy Fuels, 2013, 27, 6068–6078 CrossRef CAS.
- A. Le Gal and S. Abanades, J. Phys. Chem. C, 2012, 116, 13516–13523 CAS.
- H. Kaneko, T. Miura, H. Ishihara, S. Taku, T. Yokoyama, H. Nakajima and Y. Tamaura, Energy, 2007, 32, 656–663 CrossRef CAS.
- A. H. McDaniel, E. C. Miller, D. Arifin, A. Ambrosini, E. N. Coker, R. O'Hayre, W. C. Chueh and J. Tong, Energy Environ. Sci., 2013, 6, 2424–2428 CAS.
- C. L. Muhich, B. D. Ehrhart, V. A. Witte, S. L. Miller, E. N. Coker, C. B. Musgrave and A. W. Weimer, Energy Environ. Sci., 2015, 8, 3687–3699 CAS.
- J. R. Scheffe, J. Li and A. W. Weimer, Int. J. Hydrogen Energy, 2010, 35, 3333–3340 CrossRef CAS.
- M. Takacs, M. Hoes, M. Caduff, T. Cooper, J. R. Scheffe and A. Steinfeld, Acta Mater., 2016, 103, 700–710 CrossRef CAS.
- C. Muhich and A. Steinfeld, J. Mater. Chem. A, 2017, 5, 15578–15590 CAS.
- D. A. Andersson, S. Simak, N. V. Skorodumova, I. Abrikosov and B. Johansson, Phys. Rev. B, 2007, 76, 174119 CrossRef.
- C. L. Muhich, M. Hoes and A. Steinfeld, Acta Mater. Search PubMed , in review..
- B. D. Ehrhart, C. L. Muhich, I. Al-Shankiti and A. W. Weimer, Int. J. Hydrogen Energy, 2016, 41, 19881–19893 CrossRef CAS.
- M. K. Bahl, J. Phys. Chem. Solids, 1975, 36, 485–491 CrossRef CAS.
- N. Özer, T. Barreto, T. Büyüklimanli and C. M. Lampert, Sol. Energy Mater. Sol. Cells, 1995, 36, 433–443 CrossRef.
- J. Campserveux and P. Gerdanian, J. Solid State Chem., 1978, 23, 73–92 CrossRef CAS.
- R. J. Panlener, R. N. Blumenthal and J. E. Garnier, J. Phys. Chem. Solids, 1975, 36, 1213–1222 CrossRef CAS.
- O. T. Sørensen, J. Solid State Chem., 1976, 18, 217–233 CrossRef.
- C. L. Muhich, J. Phys. Chem. C, 2017, 121, 8052–8059 Search PubMed.
- T. Otake, H. Yugami, K. Yashiro, Y. Nigara, T. Kawada and J. Mizusaki, Solid State Ionics, 2003, 161, 181–186 CrossRef CAS.
- S. R. Bishop, K. L. Duncan and E. D. Wachsman, Electrochim. Acta, 2009, 54, 1436–1443 CrossRef CAS.
- J.-F. Jerratsch, X. Shao, N. Nilius, H.-J. Freund, C. Popa, M. V. Ganduglia-Pirovano, A. M. Burow and J. Sauer, Phys. Rev. Lett., 2011, 106, 246801 CrossRef PubMed.
- G. E. Murgida, V. Ferrari, M. V. Ganduglia-Pirovano and A. M. Llois, Phys. Rev. B, 2014, 90, 115120 CrossRef.
- J. E. Sutton, A. Beste and S. H. Overbury, Phys. Rev. B, 2015, 92, 144105 CrossRef.
- B. Wang, X. Xi and A. N. Cormack, Chem. Mater., 2014, 26, 3687–3692 CrossRef CAS.
- S. Wang, H. Inaba, H. Tagawa, M. Dokiya and T. Hashimoto, Solid State Ionics, 1998, 107, 73–79 CrossRef CAS.
- Q. Jiang, G. Zhou, Z. Jiang and C. Li, Sol. Energy, 2014, 99, 55–66 CrossRef CAS.
- M. Mogensen, N. M. Sammes and G. A. Tompsett, Solid State Ionics, 2000, 129, 63–94 CrossRef CAS.
- A. H. Bork, E. Povoden-Karadeniz and J. L. M. Rupp, Adv. Energy Mater., 2017, 7, 1601086 CrossRef.
Footnote |
| † Electronic supplementary information (ESI) available. See DOI: 10.1039/c7ta05824a |
|
| This journal is © The Royal Society of Chemistry 2017 |
Click here to see how this site uses Cookies. View our privacy policy here.  Open Access Article
 a,
Christopher L.
Muhich
 *a,
Roger
Jacot
b,
Greta R.
Patzke
 b and
Aldo
Steinfeld
 *a
*a

![[thin space (1/6-em)]](https://www.rsc.org/images/entities/char_2009.gif) :
:![[thin space (1/6-em)]](https://www.rsc.org/images/entities/char_2009.gif) 2 molar ratio in anhydrous ethylene glycol (Sigma-Aldrich, 99.8%) with an approximate citric acid to ethylene glycol mass ratio of 1
2 molar ratio in anhydrous ethylene glycol (Sigma-Aldrich, 99.8%) with an approximate citric acid to ethylene glycol mass ratio of 1![[thin space (1/6-em)]](https://www.rsc.org/images/entities/char_2009.gif) :
:![[thin space (1/6-em)]](https://www.rsc.org/images/entities/char_2009.gif) 15. In the case of Hf10, deionized water was used as the solvent. The metal salts used were cerium(III) nitrate hexahydrate (Sigma-Aldrich, 99%), lanthanum(III) nitrate hexahydrate (Alfa Aesar, 99.9%), yttrium(III) nitrate hexahydrate (Strem, 99.5%), scandium(III) nitrate pentahydrate (Strem, 99.5%), niobium(V) chloride (Strem, 99%) and hafnium(IV) chloride (Alfa Aesar, 98%). The mixtures were stirred for 2 hours at 363 K on a magnetic hotplate. The temperature was then gradually increased until the ethylene glycol reaction mixture self-ignited and a powder was formed. The powders were calcined at 1273 K for 1 hour with an initial heating rate of 5 K min−1. Subsequently, the powders were uni-axially cold-pressed under 5 tons into dense cylindrical pellets with a diameter of 8 mm. The pellets were then sintered at 1773 K for 5 hours. The high sintering temperature was used to ensure that the pellet would not melt during cycling and to assess whether the dopant cations segregated at high temperatures.
15. In the case of Hf10, deionized water was used as the solvent. The metal salts used were cerium(III) nitrate hexahydrate (Sigma-Aldrich, 99%), lanthanum(III) nitrate hexahydrate (Alfa Aesar, 99.9%), yttrium(III) nitrate hexahydrate (Strem, 99.5%), scandium(III) nitrate pentahydrate (Strem, 99.5%), niobium(V) chloride (Strem, 99%) and hafnium(IV) chloride (Alfa Aesar, 98%). The mixtures were stirred for 2 hours at 363 K on a magnetic hotplate. The temperature was then gradually increased until the ethylene glycol reaction mixture self-ignited and a powder was formed. The powders were calcined at 1273 K for 1 hour with an initial heating rate of 5 K min−1. Subsequently, the powders were uni-axially cold-pressed under 5 tons into dense cylindrical pellets with a diameter of 8 mm. The pellets were then sintered at 1773 K for 5 hours. The high sintering temperature was used to ensure that the pellet would not melt during cycling and to assess whether the dopant cations segregated at high temperatures.


 , where Δm is the relative weight loss at equilibrium calculated relative to the stabilization at 1073 K, ms is the sample mass, Ms is the molar mass of the sample, Mo is the molar mass of atomic oxygen, and δref is the nonstoichiometry at T = 1073 K and pO2 = 0.5 atm. Because of the small Δm induced by altering pO2 in the range 2.5 × 10⁻⁴–5.0 × 10⁻¹ atm at 1073 K (Δδref < 0.0011 for ScNb5; Δδref < 0.0003 for the other materials), the sample is assumed to be fully oxidized under these T and pO2 conditions, i.e. δref ≈ 0. Thus, we assume that Δδ = δ except for La10 and Y10 which have a starting nonstoichiometry of δ0 = 0.05 because trivalent dopants induce one intrinsic oxygen vacancy for every two dopant atoms. For easier comparison, the reduction extents of La10 and Y10 are plotted with a starting reduction extent of zero but the intrinsic oxygen vacancies were considered when fitting the data to a defect model, as discussed later. The reduction extents of all investigated materials are shown in Fig. 5a at T = 1723 K and pO2 = 2.5 × 10⁻⁴–4.8 × 10⁻³ atm. Similar plots are provided in Fig. S4 (ESI†) for T = 1173–1773 K and pO2 = 10−15–10−1 atm.

 indicates a Ce4+ cation on a cerium lattice site,
  an O2− anion on an oxygen lattice site,
  a Ce3+ cation on a cerium lattice site and
  a vacancy on an oxygen lattice site that has a 2+ charge to maintain charge neutrality. Here we note just for clarity that no positive charge actually localizes on the O vacancy,39 and the notation is merely a useful charge book-keeping tool. The assumed equilibrium relationship for point defects is:


 model does not adequately describe the nonstoichiometry behavior.40 The consideration of additional reactions is required, specifically defect species clustering according to:41


