
 Open Access Article
 This Open Access Article is licensed under a
 Creative Commons Attribution 3.0 Unported Licence
Air exposure induced recombination in PTB7:PC71BM solar cells†
Stuart A. J.
Thomson
a,
Stephen C.
Hogg
b,
Ifor D. W.
Samuel
 a and
David J.
Keeble
*b
a and
David J.
Keeble
*b
aOrganic Semiconductor Centre, SUPA, School of Physics & Astronomy, University of St Andrews, St Andrews KY16 9SS, UK
bCarnegie Laboratory of Physics, SUPA, School of Science and Engineering, University of Dundee, Dundee DD1 4HN, UK. E-mail: d.j.keeble@dundee.ac.uk
First published on 12th October 2017
Abstract
Understanding degradation pathways in organic photovoltaic cells (OPV) is essential to achieve long term device stability and allow commercialisation. Upon exposure to an ambient atmosphere the power conversion efficiency (PCE) of PTB7:PC71BM solar cells, cast using the solvent additive DIO, is markedly reduced. Using electrically detected magnetic resonance (EDMR) spectroscopy, trap sites, which are formed when the blend is exposed to air and DIO, are identified. Spin-Rabi oscillations reveal that the resonance arises from a weakly coupled pair of spin 1/2 species, while selective injection of charge carriers into the cell demonstrates that the spin-pair corresponds to recombination of electrons and holes. The recombination is assigned to holes on the PTB7 recombining with electrons localised to oxygen induced PC71BM trap sites.
1. Introduction
Organic photovoltaic cells (OPV) are a promising technology for solar energy conversion; possessing attractive engineering properties such as low weight, mechanical flexibility and solution processability. By blending an electron donating conjugated polymer with an electron accepting fullerene derivative to form a bulk heterojunction (BHJ) architecture, power conversion efficiencies (PCE) of greater than 10% can now routinely be achieved.1,2 While cell efficiencies have reached a level suitable for commercialization, the adoption of OPV is hindered by the susceptibility of high efficiency donor acceptor blends to degradation via reactions with oxygen and moisture which limits cell lifetimes.3The high performance blend of the polymeric donor poly([4,8-bis[(2-ethylhexyl) oxy]benzo[1,2-b:4,5-b]dithiophene-2,6-diyl]) (PTB7) with the fullerene derivative [6,6]-phenyl-C71-butyric acid methyl ester (PC71BM) has received widespread attention, with PCEs of over 9% reported when processed with the high boiling point additive 1,8-diiodooctane (DIO).4 However, it has been shown that PTB7:PC71BM cells suffer from significantly reduced efficiency when stored under an ambient atmosphere in the dark,5 and have been shown to be susceptible to photo-oxidation arising from singlet oxygen generation through oxygen quenching of PTB7 triplets.6 Raman spectroscopy, combined with density functional theory calculations, identified one of the photo-oxidation products to be hydroxyl group formation on the benzodithiophene units of PTB7.7
Several studies have focused on the role that the solvent additive DIO plays during cell degradation. While processing PTB7:PC71BM cells using DIO yields the highest PCE values due to optimisation of the blend morphology,8,9 it has been reported that cells processed using DIO suffer from poor long term stability due to residual DIO in the active layer.10–12 In addition, DIO has been shown to be responsible for loss of efficiency when cells are fabricated under an ambient atmosphere.13,14 XPS and FT-IR spectroscopy have shown that DIO promotes the oxidation of PC71BM when cells are processed under an ambient atmosphere.13
While spectroscopy can provide excellent insight into the observed degradation, it does not provide a direct link to changes in cell performance. Conversely electrical studies on degraded working cells are largely insensitive to the origin of the performance loss. In this work we combine photovoltaic characterization with electrically detected magnetic resonance (EDMR) spectroscopy to investigate the source of the performance loss in PTB7:PC71BM solar cells when processed under an ambient atmosphere. Using EDMR spectroscopy we observe an increase in the spin-dependent component of the photocurrent upon exposure of DIO containing films to air, an accompanying increase in the trap assisted recombination, and a decrease of cell efficiency. Spin-Rabi oscillations and selective carrier injection reveal the air exposure induced spin-dependent current to be dominated by weakly coupled electron–hole pairs undergoing recombination. The transition is assigned to recombination between holes on the PTB7 and electrons localized on PC71BM trap sites. This work demonstrates that DIO promotes electron trap formation on the PC71BM when cells are processed under an ambient atmosphere, leading to trap assisted recombination and a severe reduction in the PCE.
2. Results & discussion
2.1. Photovoltaic properties
Pristine and air exposed PTB7:PC71BM cells were fabricated with and without the solvent additive DIO, and the current density–voltage (J–V) characteristics were measured using a solar simulator. Air exposure was achieved by spin-coating the active layer under an ambient atmosphere and the cells were then left to dry for 10 minutes (also under an ambient atmosphere). Pristine cells were spin-coated and dried inside a nitrogen filled glovebox. The J–V characteristics of typical pristine and air exposed cells processed with and without DIO are shown in Fig. 1. When processed using DIO the average PCE of the pristine cells was 6.1(3)%. However, for the air exposed cells it was 1.7(2)%, a 73% reduction. The pristine efficiency is similar to that previously reported for devices of the same structure,8 higher efficiencies can be achieved using optimized interlayers but were not the main aim of the current study.4Fig. 1a shows that the reduction in the PCE upon air exposure primarily results from a reduction in the fill factor and short circuit current density (JSC) (ESI Table S1†). When cells are processed in the absence of DIO an average PCE of 2.2(1)% for pristine and 1.5(1)% for air exposed cells was obtained, corresponding to a 31% reduction in PCE. It is clear that the loss of performance when cells are processed in air is substantially greater for those cells processed using DIO, suggesting that the presence of DIO accelerates cell degradation. This is in agreement with previous studies,13,15 the purpose of this paper is to understand the underlying mechanism. | ||
| Fig. 1 J–V characteristics of pristine (black) and air exposed (red) PTB7:PC71BM solar cells. (a) Cells processed using the solvent additive DIO. (b) Cells processed without DIO. The spectra were recorded at 100 mw cm−2 using an AMG1.5 solar simulator. Solar cell parameters are listed in Table S1.† | ||
To gain further insight into the source of performance loss in DIO processed cells we performed variable light intensity J–V characterization to study carrier recombination. By plotting JSCversus light intensity on a log–log scale the bimolecular recombination loss at 0 V can be estimated, as shown in Fig. 2a.16,17 The data were fitted using a power law, JSC = aIb, where the exponent b provides an estimate of the degree of bimolecular recombination. When the exponent is 1, the JSC is linear with light intensity and there is no bimolecular recombination loss. When bimolecular recombination occurs b < 1 and increasing the bimolecular recombination reduces b. Average exponent values obtained were 0.956(1) for pristine cells and 0.936(3) for air exposed cells. The similarity in exponents suggests that the bimolecular recombination rate does not change appreciably upon air exposure. Monomolecular (trap assisted) recombination losses can be estimated from plots of open circuit voltage against the natural logarithm of the light intensity, see Fig. 2b. A slope of kT/e corresponds to no trap assisted recombination losses inside the cell, higher gradients signify increased losses.18,19 Linear fits gave an average slope of 1.16(1) kT/e for pristine cells and 1.52(1) kT/e for air exposed, indicating a substantial increase in trap assisted recombination upon air exposure. The J–V measurements provide evidence that the loss of performance upon air-exposure arises in part from the creation of trap sites which facilitate recombination. To further study the nature of the traps we used EDMR spectroscopy.
 | ||
| Fig. 2 Variable light intensity J–V characteristics of pristine (black) and air exposed (red) PTB7:PC71BM solar cells processed using DIO. (a) JSCversus light intensity on the log–log plot. (b) VOCversus light intensity on the semi log plot. | ||
2.2. cwEDMR
EDMR is a type of Electron Paramagnetic Resonance (EPR) spectroscopy. In EPR spectroscopy a magnetic field B is applied to the sample which splits the energy of the parallel and anti-parallel spin states of an unpaired electron by| ΔE = gμBB | (1) |
Continuous wave (CW) 9.8 GHz EDMR spectra of pristine and air exposed cells, with and without DIO, were recorded at room temperature. The cells were illuminated with a white light LED to generate a photocurrent, and the EDMR spectra recorded under short circuit conditions. Prototypical spectra of pristine and air exposed cells are shown in Fig. 3a, recorded at a photocurrent of 20 μA. To improve signal to noise the magnetic field was modulated and the spectra recorded using phase sensitive detection with a lock in an amplifier, which results in first derivative spectra. The spectra are shown as positive leading. All cells exhibit an EDMR signal at g ≈ 2.002, however the magnitude of the signal is approximately a factor of 50 greater in cells processed using DIO and exposed to air. The growth of the EDMR signal correlates with the severe reduction in PCE, and the increase in monomolecular recombination, when DIO processed cells are exposed to air. The correlation between increasing EDMR signal and decreasing cell performance is in agreement with previous EPR studies which showed that the higher concentrations of paramagnetic radical species the lower the cell performance.21–23
 | ||
| Fig. 3 EDMR spectra of PTB7:PC71BM recorded under short circuit conditions with white light illumination at room temperature. (a–c) were measured in CW mode with a field modulation amplitude of 0.3 mT (a and c) and 0.05 mT for (b) while (d) was measured in pulsed mode and pseudomodulated. The experimental spectra are shown in black, the total simulation in red and the two Gaussian components of the simulation in blue (g = 2.0022) and green (g = 2.0026). (a) CW 9.8 GHz EDMR spectrum of a DIO processed air exposed cell (upper), a DIO processed pristine cell (middle) and an air exposed cell without DIO (lower). (b) CW 9.8 GHz EDMR spectrum of an air exposed cell. (c) CW 34 GHz EDMR spectrum of an air exposed cell. (d) Pseudo-modulated pulsed 94 GHz EDMR spectrum of an air exposed cell. | ||
The absolute magnitude of the spin-dependent current change (in amperes) is obscured when using phase sensitive detection, as it is dependent on the field modulation amplitude. However, for the DIO processed air exposed cell the change of the DC photocurrent (short circuit) could be measured and decreased by approximately 50 nA on resonance (using a microwave power of 200 mW). The total photocurrent was 20 μA giving a fractional spin-dependent current change of ∼1 × 10⁻³. From the relative reduction in the EDMR signal (see Fig. 3a) for the inert atmosphere and ambient atmosphere without DIO cells, the fractional change in photocurrent in these cells can be estimated to be approximately ∼2 × 10⁻⁵. The decrease of the photocurrent at resonance is consistent with a recombination mechanism.20 At equilibrium, off resonance, the electron–hole pairs undergoing non-geminate recombination will have a predominately triplet character, since those with a singlet character will recombine and be removed from the system. The effect of the resonant microwaves is to increase the fraction of singlet pairs and so increase the recombination rate, resulting in a decrease in the photocurrent at resonance. While the observed decrease in photocurrent supports a recombination mechanism, it is not conclusive as other spin-dependent mechanisms such as hopping can also give rise to a decreasing current at resonance.20
To improve the accuracy of the spectral fit, EDMR spectra of air exposed cells were recorded at three microwave frequencies, see Fig. 3b–d. The spectra can be simulated using two Gaussians, with equal doubly integrated areas, centred at g = 2.0022(2) (blue) and 2.0026(2) (green) with full width half maxima (FWHM) at 9.8 GHz of 0.22(2) mT and 0.40(2) mT, respectively. It is well established that an EDMR signal from a spin-pair involved in a spin-dependent process, such as recombination, consists of two resonances with equal doubly integrated areas, and we therefore assign the two Gaussian distributions as constituent members of a spin pair.24–28 The FWHM increase with increasing microwave frequency reaching 1.48(2) mT and 2.30(2) mT at 94 GHz. The linewidths contain contributions from unresolved hyperfine coupling (H-strain) and from a distribution of g-values arising from slight variations in the local environments of the spin centres (g-strain). The latter is proportional to the microwave frequency, leading to the increase in linewidth at higher frequencies. Both are forms of inhomogeneous broadening and therefore give rise to Gaussian lineshapes.29
The EDMR spectra are fit remarkably well at all three microwave frequencies using the two symmetric Gaussian distributions. In contrast, conventional EPR spectra of organic semiconductors routinely exhibit anisotropy, as the g-factor depends upon the relative orientation of the molecule or polymer segment and the applied magnetic field. For example, the g-tensors of light induced immobilised electrons and holes in the PTB7:PC71BM blend have been measured at low temperatures using high field EPR and have a rhombic symmetry.30,31 This gives asymmetric EPR spectra at 9.8 GHz, and the principal values of the g-tensor are clearly resolved in spectra recorded at 94 GHz (see ESI Fig. S1†).30,31
The ability to fit the EDMR spectra using the sum of two symmetric lines therefore requires further consideration. It suggests that the paramagnetic centres involved in the EDMR mechanism either have intrinsically lower anisotropy or the anisotropy is masked by increased inhomogeneous broadening (H-strain and g-strain). The symmetric fitting applied here is in agreement with previous EDMR studies on organic semiconductors, which yielded spectra that were accurately fitted using symmetric lineshapes, even when the materials exhibit anisotropic EPR spectra.25,27,28,32–39 Introducing a small degree of anisotropy into the fits of the spectra shown in Fig. 3b–d does improve the fit quality, by virtue of the increased number of fit parameters, however it has to be applied subjectively and does not provide additional insight.
The spectra shown thus far were recorded using low microwave power to prevent power saturation and distortion of the lineshape. When the microwave power is increased proton spin satellites coupled to the 2.0022(2) resonance become apparent, suggesting the spin-pair centres are in close proximity to hydrogen nuclei (ESI Fig. S2†).40 At high microwave powers (>150 mW) the simulation using two resonances and the associated spin satellites becomes increasingly poor. This suggests that at least one additional resonance is present, which continues to increase in intensity after the main line saturates (ESI Fig. S3†). To further explore the change in line shape at high microwave power, and to gain insight into the nature and dynamics of the spin dependent processes, we performed pulsed EDMR spectroscopy.
2.3. pEDMR
In pulsed EDMR (pEDMR) the solar cell is exposed to short microwave pulses and the perturbation of the photocurrent after the pulse is recorded as a function of time. The microwave pulse influences the permutation symmetry of the spins, resulting in a perturbation of the photocurrent from its steady state value.24 By monitoring the evolution of the current transient back towards the steady state the dynamics of the spin-dependent transitions can be observed. No field modulation is used in pEDMR. The pEDMR transient following excitation by a high power 300 ns (34 GHz) microwave pulse is shown in Fig. 4a. The deconvolution of the transient at long times (t > 6 μs) reveals two Voigt distributions with centres at 2.0022(2) (magenta) and 2.0026(2) (green), in agreement with the cwEDMR spectra. At short times (t = 2.5 μs) there is an additional broad distribution centred on 2.0038(3) (orange). The Voigtian lineshapes arise from the high pulse energy that is required to observe the 2.0038(3) distribution which results in lifetime broadening and distortion of the original Gaussian lineshapes toward Lorentzian.29 As the pulse power is lowered the relative intensity of the 2.0038(3) distribution decreases (ESI Fig. S4†). The doubly integrated areas of the 2.0022(2) and 2.0026(2) distributions remain equal throughout the transient, providing further evidence that they correspond to the constituent members of a spin-pair. However, the distribution centred at 2.0038(3) exhibits a different time evolution which indicates that it belongs to a second independent process. The fact that it is only visible at high microwave powers is consistent with the breakdown of the cwEDMR spectrum two component fit under high power (ESI Fig. S3†). | ||
| Fig. 4 Pulse EDMR spectra of PTB7:PC71BM recorded under short circuit conditions with illumination at room temperature. (a) Current transient following a Q-Band (34 GHz) 300 ns microwave pulse at t = 0. The colour plot illustrates the deviation of the photocurrent from the steady state. The line plots show the shape of the transient at three different time slices. Experimental data are shown in black, the total simulation in red and the underlying components in magenta (g = 2.0022), green (g = 2.0026) and orange (g = 2.0038). (b) Variation of Rabi oscillation frequency with the magnetic field measured at 9.8 GHz. The dashed white line is a simulation of the expected off resonance detuning. (c) Variation of Rabi oscillation frequency with increasing B1 field strength of 9.8 GHz microwave pulses. | ||
To explore the underlying mechanism responsible for the EDMR response we performed Rabi oscillation experiments.24,34,41,42 During the microwave pulse a spin 1/2 species will precess with an angular frequency of γB1, where γ is the gyromagnetic ratio and B1 is the magnetic field strength of microwave pulse, and will result in an oscillation of the spin pair permutation symmetry at the Rabi frequency. The magnitude of current transient following the microwave pulse is controlled by the spin permutation symmetry at the instant the pulse terminates.24 Thus, by incrementally increasing the microwave pulse length and recording the magnitude of the integrated current transient, Q, following each pulse the Rabi oscillation can be observed. The Fourier transform of the Rabi oscillation of Q is shown in Fig. 4b, as a function of the static magnetic field. There are two components with centre frequencies of 18.6(2) MHz and 37.3(2) MHz corresponding to the fundamental Rabi frequency Ω = γB1 and the beat oscillation at 2Ω = 2γB1.37,42 The presence of the double frequency beat oscillation demonstrates that the spin-dependent transition involves two spin 1/2 species. The observation excludes the possibility that a triplet polaron process is involved.32,43 A beat oscillation can arise if the exchange coupling between the pair partners is strong (J > Δω) or B1 is sufficiently large (B1 > Δω), where Δω is the Larmor frequency difference of the pair partners, to excite both members of the pair simultaneously.44 These scenarios can be distinguished by varying the B1 strength as shown in Fig. 4c. Under strong exchange coupling the magnitude of the beat frequency component is greater than the fundamental and independent of the strength of B1. While under weak coupling the strength of the beat frequency component is weaker than the fundamental at low B1 and increases with increasing B1. It can be seen from Fig. 4c that the magnitude of the 2Ω component is weak at low B1 and increases in strength with increasing B1, hence the exchange coupling is weak. From the Rabi experiments we conclude that the resonances centred on 2.0022(2) and 2.0026(2) correspond to two populations of spin 1/2 species that are weakly exchange coupled and form a spin-pair.
2.4. Nature of the spin-pair
To determine if the spin-pair is composed of electrons or holes undergoing spin-dependent transport, or from the recombination of electrons and holes, we fabricated sets of PTB7:PC71BM cells with different electrodes to control the injection of charge carriers into the film; the structures used are shown in Fig. 5c. For ambipolar cells PEDOT:PSS and calcium were chosen as the hole and electron injection layers, respectively. In hole rich cells the calcium was replaced with gold, which inhibits electron injection due to the high work function. Electron rich cells were created by replacing PEDOT:PSS with a thin layer of lithium fluoride which inhibits the injection of holes into the cell. An EDMR mechanism involving both electrons and holes will have the greatest magnitude when both carriers are present in equal numbers. In general, the magnitude is limited by the minority carrier concentration. A comparison of injected and photogenerated spectra is shown in Fig. 5a. The cwEDMR spectrum of each electrode structure was recorded twice, under forward bias in the dark and at short circuit under illumination. Under illumination the photogenerated excitons quickly diffuse and dissociate to yield free electrons and holes.8 The photogenerated spectra therefore act as a reference where both carriers are present in equal numbers. To allow accurate comparison the light intensity and forward bias voltage were chosen such that the current through the cells was 20 μA in all measurements. It can be seen that the injection and photogeneration spectra of the ambipolar cell are similar in magnitude. In contrast, the injection spectra of the electron rich and hole rich cells are weaker by at least a factor 10 compared to their corresponding photogenerated spectra. As the spin-pair signal is greatest when both carriers are present in approximately equal numbers we conclude that the spin-pair arises from the recombination of electrons and holes. In the following section we assign the recombination to be between trapped electrons on PC71BM and mobile holes on PTB7.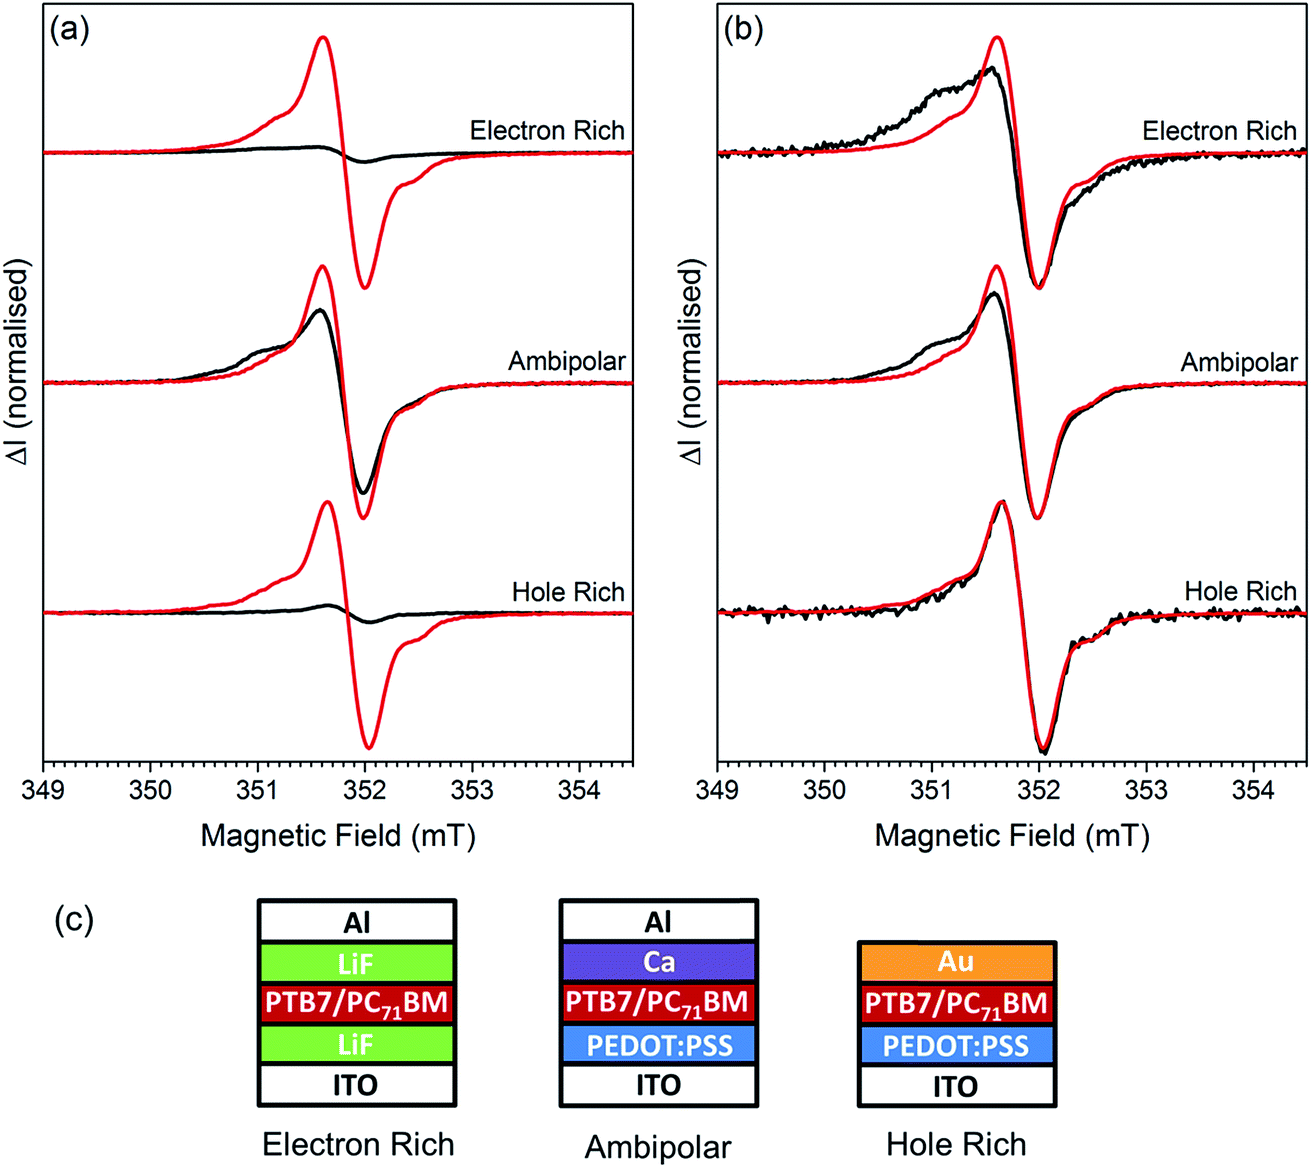 | ||
| Fig. 5 Comparison of photogenerated (red) and injected (black) PTB7:PC71BM spectra using different electrode configurations to control carrier injection. The forward bias voltage or LED intensity was adjusted so that the current through the cell was 20 μA during all measurements. Spectra were acquired under high microwave power with a large modulation amplitude (0.3 mT) to achieve sufficient signal to noise resulting in a smoothing of the sharper features. (a) The photogenerated and injection spectra have been normalized with respect to the height of photogenerated spectrum. (b) The spectra are normalized. (c) Electrode configurations used to generate ambipolar, electron rich and hole rich cells. The ITO was biased positively (hole injection) and the top contact negatively (electron injection). | ||
Comparing the line shapes of the photogenerated and injection spectra for the three types of devices shown in Fig. 5b it is clear that the injection spectrum is substantially different from the photogenerated spectrum for both the electron rich and the ambipolar cells. When charge carriers are created by injection the EDMR spectrum contains new spectral features on the low field side, in addition to the spin-pair resonances. These are primarily due to a pronounced broad distribution centred on 2.0037(3) (ESI Fig. S5†). This is similar, in both linewidth and g-value, to the broad short lived distribution centred on 2.0038(3) observed in the photogenerated pEDMR spectrum (Fig. 4a), and to a component of the high power cwEDMR spectrum (ESI Fig. S3†). It is concluded that these correspond to the same species. The choice of injection electrode has a profound influence on the magnitude of the 2.0037(3) distribution as can be seen from Fig. 5b where the low field shoulder is greatest in electron rich cells and absent in the hole rich.
2.5. Location of recombination sites
To gain insight into the location of the recombination sites, we fabricated cells containing the constituent components of the blend. Pristine and air exposed PTB7 and PC71BM cells were fabricated in a similar manner to the blend. The injection generated cwEDMR spectra from the air exposed PTB7 and PC71BM cells are shown in Fig. 6, together with the photogenerated spectrum from the PTB7:PC71BM blend for comparison. The PTB7 spectrum can be fitted with a Voigt distribution centred on 2.0037(2), with FWHM of 1.35(2) mT. The fit is approximate and it is clear that the broad spectrum is in fact composed of overlapping contributions. Neat PTB7 cells were fabricated with and without DIO, and under inert or ambient atmosphere. Unlike the blend, the magnitude and lineshape of the neat PTB7 EDMR signal were invariant to the use of DIO and the choice of processing environment. Instead the lineshape and magnitude were curiously found to be dependent on the batch of PTB7 used. It is therefore likely that the room temperature EDMR response of neat PTB7 cells arises from pre-existing defects, such as synthesis impurities and oxidized species in the film. The assignment of this resonance to defects on the PTB7 is supported by previous EPR measurements which showed that the number of paramagnetic defects on PTB7 varied with the molecular weight of the polymer batch.21 The concentration of similar paramagnetic defects in PTB7 films was observed to increase on exposure to light for extended periods of time.45 | ||
| Fig. 6 9.8 GHz EDMR spectra of air exposed PTB7, PC71BM and PTB7:PC71BM. Charge carriers in PTB7 and PC71BM were generated by injection under forward bias while carriers in PTB7:PC71BM blend were photogenerated using a white light LED. The field modulation amplitude was 0.05 for PTB7 and PTB7:PC71BM and 0.3 mT for PC71BM. The experimental spectra are shown in black, the total simulation in red and the constituent components in blue and green. | ||
The air exposed PC71BM EDMR spectrum (Fig. 6) can be simulated using two Gaussian distributions centred on 2.0025(2) (green) and 2.0028(2) (blue) with FWHM of 0.38(2) and 1.00(2) mT, respectively. The areas of the two distributions are not equal, indicating that the spectrum does not simply arise from a single spin-dependent transition between the two distributions. The magnitude of the air exposed PC71BM EDMR response is a factor of 7(2) larger than the pristine, providing evidence that air exposure induces the spin-dependent transition (ESI Fig. S6†). The spectrum is similar to previous pEDMR measurements on air exposed films of PC61BM, observed to be at approximately g = 2.0030(2) by Morishita et al.,38 who concluded that at least two spin-dependent processes are present under bipolar injection of carriers at room temperature. Fullerenes are well known to be susceptible to oxidation, and a variety of fullerene oxygen complexes, such as fullerene epoxides, have been reported.46–48 Previous EPR studies on oxygen exposed C60 films revealed that fullerene oxygen complexes exhibit signals with g = 2.0026(3).49–51 The air exposed cwEDMR spectrum of PC71BM is therefore attributed to charge carriers located at oxidised PC71BM.
Comparing the cwEDMR spectrum of the PTB7:PC71BM blend to spectra of the constituent components (Fig. 6), it can be seen that the spectrum of neat PTB7 and of the blend is clearly dissimilar; they exhibit substantially different g-factors and linewidths. The dissimilar lineshape and the insensitivity of neat PTB7 films to DIO and air exposure lead us to conclude that the spin-pair observed in the blend does not involve charge carriers localized at PTB7 defect sites. In contrast, the EDMR spectrum from the neat PC71BM and that from the spin-pair in the blend contain similar Gaussian distributions with centres at 2.0025(2) and 2.0026(2), and FWHM of 0.38(2) mT and 0.40(2) mT, respectively. This similarity in the g-factor and linewidth provides evidence that the 2.0026(2) component of the spin-pair signal in the blend is due to electrons or holes located on the PC71BM.
Potential mechanisms are the recombination of electrons and holes where; both are located on the PC71BM; electrons are on the PTB7 and holes on the PC71BM; holes are on the PTB7 and electrons on the PC71BM. Two of these scenarios are unlikely to occur as the charge carriers in the blend originate from photogenerated excitons. After exciton dissociation the electron is on the LUMO of the PC71BM and the hole is on the HOMO of PTB7. The hopping of holes from the HOMO of the PTB7 to the HOMO of PC71BM is energetically unfavourable. Recombination between electrons and holes both on PC71BM, and recombination between electrons on PTB7 and holes on PC71BM, are therefore energetically unlikely. We therefore assign the distribution at 2.0026(2) to electrons on PC71BM, and the 2.0022(2) distribution to holes on PTB7.
As the EDMR response of the DIO processed blend increases upon air exposure, one of the spin-pair partners must be localised to a defect. The EDMR response of neat PC71BM films also increases upon air exposure which means that it is the 2.0026(2) distribution, which is present in both neat PC71BM and the blend, that corresponds to a defect site. As discussed previously this centre can be assigned to an oxidised PC71BM molecule, based on a similar g-factor to previous EDMR and EPR studies on air exposed fullerenes.38,49–51 The oxidation of fullerene has been shown to lower LUMO energy, meaning that oxidised fullerenes act as electron traps.52 The spin pair component at g = 2.0026(2) is therefore assigned to electrons localised to oxidised PC71BM. It should be noted that the EDMR response of the neat PC71BM film increases upon air exposure even in the absence of DIO, while the blend requires both air and DIO.
We next consider the second component of the spin-pair signal in the blend at 2.0022(2). It is clear that this resonance is not related to the defect EDMR signal detected in the neat PTB7 film, which occurs at a significantly higher g-factor and is far broader (Fig. 6). Instead we attribute the 2.0022(2) signal to holes on the PTB7 capable of forming weakly coupled pairs with electrons localized on PC71BM trap sites. The g-factor attributed here to holes on PTB7 differs from that obtained by LEPR for the immobilised hole centre at low temperature of giso = 2.0033 (gx = 2.0045, gy = 2.0031, gz = 2.0023) (ESI Fig. S1†).30 A similar discrepancy between EPR and EDMR g-factor has been observed in a study of P3HT:PC61BM blends at 80 K, where the simulation of the electron on PC61BM in the EDMR spectrum required an isotropic distribution centred on the gz value of the EPR g-tensor.35 A comparable mechanism may be responsible for difference in g-values observed here. Furthermore, it should also be noted that the hole assigned here is a mobile species at room temperature; this cannot be observed by conventional EPR and may have a different spectrum from that for the immobilised holes on PTB7 detected in the previous low temperature EPR studies.30
In summary we assign the spin-pair to recombination between electrons localised to defects on the PC71BM and holes in the HOMO of PTB7. The g-factor associated with the electron trapping defect suggests that it is an oxidised PC71BM complex, in agreement with the observation of epoxy formation on PC71BM by Lee et al.,15 when PC71BM is exposed to oxygen and DIO.
The broad, rapidly decaying, component centred on 2.0038(3) most clearly seen in Fig. 4, is more difficult to assign. The similarity in both g-factor and linewidth to the spectrum of neat PTB7 confirms that electrons or holes trapped at defects on the PTB7 are involved. However, it was not possible to resolve the constituent components of this signal. A possible mechanism is the recombination of mobile electrons with holes trapped at defects on PTB7. This resonance was not observed in the inert processed blend, or those processed in air in the absence of DIO. This suggests that the combination of DIO and air also adversely affects the PTB7 component of the blend. However we saw no change when neat PTB7 films were processed in air with DIO and degradation in the PTB7 therefore only occurs, or is accelerated by, blending with PC71BM. Regardless, under illumination under short circuit conditions the 2.0038(3) signal is substantially weaker than that of the spin-pair. Thus under conditions relevant to working solar cells, photoexcitation with no applied bias, the EDMR spectrum is primarily composed of a spin-pair corresponding to the recombination of electrons localised at oxygen induced traps on PC71BM and holes on PTB7.
3. Conclusion
The J–V characteristics and EDMR spectra of pristine and air exposed PTB7:PC71BM solar cells were measured with and without DIO. Upon air exposure of DIO processed cells, the efficiency drops from 6.1% to 1.7%, with a concomitant increase in trap assisted recombination losses. The increased trap assisted recombination observed when DIO processed cells are exposed to air is accompanied by an enhancement of the EDMR response. EDMR spectra recorded under illumination at short-circuit are due to a spin-pair, which is demonstrated to be due to carrier recombination. This is attributed to electrons localized to electron traps on PC71BM and mobile holes on the PTB7. In addition, there is a weaker resonance arising from the degradation of the PTB7. Our results show that exposing DIO cast films to air leads to oxidation of the PC71BM which acts as an electron trap leading to a substantial increase in trap assisted recombination losses and a lower PCE.4. Materials and methods
4.1. Cell fabrication
For EDMR cells, ITO coated glass (Xinyan Technology Ltd) was patterned by photolithography (S1813 G2 photoresist) and etched in hydrochloric acid (37%) for 15 minutes before being dried into 50 mm × 2.8 mm substrates. Substrates for J–V characterization were 12 × 12 mm with a central 4 mm strip of ITO (Xinyan Technology Ltd). Substrates were cleaned by sequential sonication in Hellmanex III solution, acetone and isopropanol followed by treatment with an oxygen plasma. For ambipolar and hole rich cells a bottom contact of PEDOT:PSS (Heraeus Clevios P VP AI 4083) was spin-coated at 2000 rpm. The substrates were then annealed on a hotplate at 120 °C for 20 min to remove residual water. For the electron rich cells a 1 nm layer of LiF was thermally evaporated at a pressure of 1 × 10⁻⁶ mbar in place of the PEDOT:PSS. PTB7 (1-Material) and PC71BM (Solenne) were dissolved in anhydrous chlorobenzene in a 1![[thin space (1/6-em)]](https://www.rsc.org/images/entities/char_2009.gif) :1.5 weight ratio to give a total concentration of 20 mg cm−3 inside a nitrogen filled glovebox and stirred at 50 °C for 6 h. For DIO processed films, 3% by volume of 1,8-diiodooctane (Sigma Aldrich) was added to the solution and left to stir for 10 minutes prior to spin-coating. The solution was spin-coated at 1000 rpm inside the glovebox for pristine cells and under an ambient atmosphere for air exposed cells. The pristine and air exposed cells were left to dry for 10 minutes inside the glovebox and under an ambient atmosphere respectively. Neat PC71BM and PTB7 films were fabricated in a similar manner using 20 mg cm−3 and 5 mg cm−3 in chlorobenzene, respectively. The substrates were transferred to a thermal evaporator for top contact deposition. This took the form of 20 nm calcium followed by 80 nm aluminium for ambipolar cells, or 1 nm LiF followed by 80 nm aluminium for electron rich cells, or 100 nm of gold for hole rich cells. The cells were encapsulated with a UV curing epoxy (Norland 68) and a glass coverslip.
:1.5 weight ratio to give a total concentration of 20 mg cm−3 inside a nitrogen filled glovebox and stirred at 50 °C for 6 h. For DIO processed films, 3% by volume of 1,8-diiodooctane (Sigma Aldrich) was added to the solution and left to stir for 10 minutes prior to spin-coating. The solution was spin-coated at 1000 rpm inside the glovebox for pristine cells and under an ambient atmosphere for air exposed cells. The pristine and air exposed cells were left to dry for 10 minutes inside the glovebox and under an ambient atmosphere respectively. Neat PC71BM and PTB7 films were fabricated in a similar manner using 20 mg cm−3 and 5 mg cm−3 in chlorobenzene, respectively. The substrates were transferred to a thermal evaporator for top contact deposition. This took the form of 20 nm calcium followed by 80 nm aluminium for ambipolar cells, or 1 nm LiF followed by 80 nm aluminium for electron rich cells, or 100 nm of gold for hole rich cells. The cells were encapsulated with a UV curing epoxy (Norland 68) and a glass coverslip.
4.2. J–V characterization
J–V curves were recorded using a Class A Sciencetech solar simulator and a Keithley 2400 source measure unit. The intensity was calibrated with a silicon reference cell (Newport). For variable light intensity recombination measurements a white light LED was used. The quoted efficiencies and slopes are averages across many cells and the standard error of the mean is shown in brackets.4.3. EDMR spectroscopy
X-Band (9.8 GHz) spectra were recorded on a Bruker EMX equipped with a Super High QE resonator (ER 4122SHQE) and a Bruker Elexsys E580 equipped with a dielectric ring resonator (EN 4118X-MD4). Q-Band (34 GHz) spectra were recorded using the SuperQ-FT bridge of the E580 equipped with an ER5106QT-2W resonator. W-Band (94 GHz) spectra were recorded in pulsed mode on a custom built spectrometer, HIPER.53 The current from the cell was fed to a transimpedance amplifier (EMM GmbH) before being passed into the lock in an amplifier or a transient recorder of the spectrometer for continuous wave (CW) and pulse measurements, respectively. For CW measurements the magnetic field was modulated at 100 kHz. The photocurrent spectra were recorded using a LED mounted on the external resonator wall for illumination while the bias for injection spectra was provided by using the transimpedance amplifier. Nitrogen doped C60 was used as a g marker.54,55 Simulations of EDMR spectra were generated using the Easyspin Matlab toolbox.56Conflicts of interest
There are no conflicts to declare.Acknowledgements
SAJT acknowledges studentship funding from EPSRC under grant number EP/G03673X/1. I. D. W. S. acknowledges support EPSRC (EP/L012294/1) and a Royal Society Wolfson Research Merit Award. S. C. H. acknowledges funding from EPSRC under grant number EP/J500045/1. We also acknowledge support from the Wellcome Trust (099149) and from EPSRC (EP/F039034/1) and wish to thank Dr R. I. Hunter for technical assistance with the W-band measurements.Notes and references
- Y. H. Liu, J. B. Zhao, Z. K. Li, C. Mu, W. Ma, H. W. Hu, K. Jiang, H. R. Lin, H. Ade and H. Yan, Nat. Commun., 2014, 5, 5293 CrossRef CAS PubMed.
- J. Zhao, Y. Li, G. Yang, K. Jiang, H. Lin, H. Ade, W. Ma and H. Yan, Nat. Energy, 2016, 1, 15027 CrossRef CAS.
- M. Jorgensen, K. Norrman, S. A. Gevorgyan, T. Tromholt, B. Andreasen and F. C. Krebs, Adv. Mater., 2012, 24, 580–612 CrossRef PubMed.
- Z. C. He, C. M. Zhong, S. J. Su, M. Xu, H. B. Wu and Y. Cao, Nat. Photonics, 2012, 6, 591–595 Search PubMed.
- B. Arredondo, M. B. Martin-Lopez, B. Romero, R. Vergaz, P. Romero-Gomez and J. Martorell, Sol. Energy Mater. Sol. Cells, 2016, 144, 422–428 CrossRef CAS.
- Y. W. Soon, H. Cho, J. Low, H. Bronstein, I. McCulloch and J. R. Durrant, Chem. Commun., 2013, 49, 1291–1293 RSC.
- J. Razzell-Hollis, J. Wade, W. C. Tsoi, Y. Soon, J. Durrant and J. S. Kim, J. Mater. Chem. A, 2014, 2, 20189–20195 CAS.
- G. J. Hedley, A. J. Ward, A. Alekseev, C. T. Howells, E. R. Martins, L. A. Serrano, G. Cooke, A. Ruseckas and I. D. W. Samuel, Nat. Commun., 2013, 4, 2867 Search PubMed.
- Y. Y. Liang, Z. Xu, J. B. Xia, S. T. Tsai, Y. Wu, G. Li, C. Ray and L. P. Yu, Adv. Mater., 2010, 22, E135–E138 CrossRef CAS PubMed.
- B. J. T. de Villers, K. A. O'Hara, D. P. Ostrowski, P. H. Biddle, S. E. Shaheen, M. L. Chabinyc, D. C. Olson and N. Kopidakis, Chem. Mater., 2016, 28, 876–884 CrossRef.
- W. Huang, E. Gann, Z. Q. Xu, L. Thomsen, Y. B. Cheng and C. R. McNeill, J. Mater. Chem. A, 2015, 3, 16313–16319 CAS.
- W. Kim, J. K. Kim, E. Kim, T. K. Ahn, D. H. Wang and J. H. Park, J. Phys. Chem. C, 2015, 119, 5954–5961 CAS.
- N. Li and C. J. Brabec, Energy Environ. Sci., 2015, 8, 2902–2909 CAS.
- L. Ye, Y. Jing, X. Guo, H. Sun, S. Q. Zhang, M. J. Zhang, L. J. Huo and J. H. Hou, J. Phys. Chem. C, 2013, 117, 14920–14928 CAS.
- S. Lee, J. Kong and K. Lee, Adv. Energy Mater., 2016, 6, 1600970 CrossRef.
- A. K. K. Kyaw, D. H. Wang, V. Gupta, W. L. Leong, L. Ke, G. C. Bazan and A. J. Heeger, ACS Nano, 2013, 7, 4569–4577 CrossRef CAS PubMed.
- I. Riedel, J. Parisi, V. Dyakonov, L. Lutsen, D. Vanderzande and J. C. Hummelen, Adv. Funct. Mater., 2004, 14, 38–44 CrossRef CAS.
- L. J. A. Koster, V. D. Mihailetchi, R. Ramaker and P. W. M. Blom, Appl. Phys. Lett., 2005, 86, 123509 CrossRef.
- D. Rauh, C. Deibel and V. Dyakonov, Adv. Funct. Mater., 2012, 22, 3371–3377 CrossRef CAS.
- C. Boehme and K. Lips, in Charge transport in disordered solids with applications in electronics, ed. S. D. Baranovskii, Wiley, Chichester, 2006, pp. 179–219 Search PubMed.
- Z. Ding, J. Kettle, M. Horie, S. W. Chang, G. C. Smith, A. I. Shames and E. A. Katz, J. Mater. Chem. A, 2016, 4, 7274–7280 CAS.
- F. Fungura, W. R. Lindemann, J. Shinar and R. Shinar, Adv. Energy Mater., 2017, 7, 1601420 CrossRef.
- D. K. Susarova, N. P. Piven, A. V. Akkuratov, L. A. Frolova, M. S. Polinskaya, S. A. Ponomarenko, S. D. Babenko and P. A. Troshin, Chem. Commun., 2015, 51, 2239–2241 RSC.
- C. Boehme and K. Lips, Phys. Rev. B, 2003, 68, 245105 CrossRef.
- G. Joshi, R. Miller, L. Ogden, M. Kavand, S. Jamali, K. Ambal, S. Venkatesh, D. Schurig, H. Malissa, J. M. Lupton and C. Boehme, Appl. Phys. Lett., 2016, 109, 191–195 Search PubMed.
- D. Kaplan, I. Solomon and N. F. Mott, J. Phys., Lett., 1978, 39, L51–L54 CrossRef.
- M. Kavand, D. Baird, K. van Schooten, H. Malissa, J. M. Lupton and C. Boehme, Phys. Rev. B, 2016, 94, 075209 CrossRef.
- K. J. van Schooten, D. L. Baird, M. E. Limes, J. M. Lupton and C. Boehme, Nat. Commun., 2015, 6, 6688 CrossRef CAS PubMed.
- J. A. Weil and J. R. Bolton, Electron Paramagnetic Resonance: Elementary Theory and Practical Applications, John Wiley & Sons, Inc, Hoboken, New Jersey, 2nd edn, 2007 Search PubMed.
- J. Niklas, K. L. Mardis, B. P. Banks, G. M. Grooms, A. Sperlich, V. Dyakonov, S. Beaupre, M. Leclerc, T. Xu, L. P. Yu and O. G. Poluektov, Phys. Chem. Chem. Phys., 2013, 15, 9562–9574 RSC.
- O. G. Poluektov, S. Filippone, N. Martin, A. Sperlich, C. Deibel and V. Dyakonov, J. Phys. Chem. B, 2010, 114, 14426–14429 CrossRef CAS PubMed.
- W. J. Baker, D. R. McCamey, K. J. van Schooten, J. M. Lupton and C. Boehme, Phys. Rev. B, 2011, 84, 165205 CrossRef.
- C. Boehme, D. R. McCamey, K. J. van Schooten, W. J. Baker, S. Y. Lee, S. Y. Paik and J. M. Lupton, Phys. Status Solidi B, 2009, 246, 2750–2755 CrossRef CAS.
- W. Harneit, C. Boehme, S. Schaefer, K. Huebener, K. Fostiropoulos and K. Lips, Phys. Rev. Lett., 2007, 98, 216601 CrossRef CAS PubMed.
- F. Kraffert, R. Steyrleuthner, C. Meier, R. Bittl and J. Behrends, Appl. Phys. Lett., 2015, 107, 043302 CrossRef.
- S. Y. Lee, S. Y. Paik, D. R. McCamey, J. Yu, P. L. Burn, J. M. Lupton and C. Boehme, J. Am. Chem. Soc., 2011, 133, 2019–2021 CrossRef CAS PubMed.
- D. R. McCamey, K. J. van Schooten, W. J. Baker, S. Y. Lee, S. Y. Paik, J. M. Lupton and C. Boehme, Phys. Rev. Lett., 2010, 104, 017601 CrossRef CAS PubMed.
- H. Morishita, W. J. Baker, D. P. Waters, R. Baarda, J. M. Lupton and C. Boehme, Phys. Rev. B, 2014, 89, 125311 CrossRef.
- A. Schnegg, J. Behrends, M. Fehr and K. Lips, Phys. Chem. Chem. Phys., 2012, 14, 14418–14438 RSC.
- G. T. Trammell, H. Zeldes and R. Livingston, Phys. Rev., 1958, 110, 630–634 CrossRef CAS.
- D. R. McCamey, H. A. Seipel, S. Y. Paik, M. J. Walter, N. J. Borys, J. M. Lupton and C. Boehme, Nat. Mater., 2008, 7, 723–728 CrossRef CAS PubMed.
- V. Rajevac, C. Boehme, C. Michel, A. Gliesche, K. Lips, S. D. Baranovskii and P. Thomas, Phys. Rev. B, 2006, 74, 245206 CrossRef.
- B. Z. Tedlla, F. Zhu, M. Cox, B. Koopmans and E. Goovaerts, Phys. Rev. B, 2015, 91, 085309 CrossRef.
- A. Gliesche, C. Michel, V. Rajevac, K. Lips, S. D. Baranovskii, F. Gebhard and C. Boehme, Phys. Rev. B, 2008, 77, 245206 CrossRef.
- L. A. Frolova, N. P. Piven, D. K. Susarova, A. V. Akkuratov, S. D. Babenko and P. A. Troshin, Chem. Commun., 2015, 51, 2242–2244 RSC.
- F. Diederich, R. Ettl, Y. Rubin, R. L. Whetten, R. Beck, M. Alvarez, S. Anz, D. Sensharma, F. Wudl, K. C. Khemani and A. Koch, Science, 1991, 252, 548–551 CAS.
- K. M. Creegan, J. L. Robbins, W. K. Robbins, J. M. Millar, R. D. Sherwood, P. J. Tindall, D. M. Cox, A. B. Smith, J. P. McCauley, D. R. Jones and R. T. Gallagher, J. Am. Chem. Soc., 1992, 114, 1103–1105 CrossRef CAS.
- D. Heymann and R. B. Weisman, C. R. Chim., 2006, 9, 1107–1116 CrossRef CAS.
- A. Colligiani and C. Taliani, Chem. Mater., 1994, 6, 1633–1637 CrossRef CAS.
- E. A. Katz, A. I. Shames, D. Faiman, S. Shtutina, Y. Cohen, S. Goren, W. Kempinski and L. Piekara-Sady, Phys. B, 1999, 273–274, 934–937 CrossRef CAS.
- P. Paul, K. C. Kim, D. Y. Sun, P. D. W. Boyd and C. A. Reed, J. Am. Chem. Soc., 2002, 124, 4394–4401 CrossRef CAS PubMed.
- M. O. Reese, A. M. Nardes, B. L. Rupert, R. E. Larsen, D. C. Olson, M. T. Lloyd, S. E. Shaheen, D. S. Ginley, G. Rumbles and N. Kopidakis, Adv. Funct. Mater., 2010, 20, 3476–3483 CrossRef CAS.
- P. A. S. Cruickshank, D. R. Bolton, D. A. Robertson, R. I. Hunter, R. J. Wylde and G. M. Smith, Rev. Sci. Instrum., 2009, 80, 103102 CrossRef PubMed.
- M. Eckardt, R. Wieczorek and W. Harneit, Carbon, 2015, 95, 601–607 CrossRef CAS.
- B. Pietzak, M. Waiblinger, T. A. Murphy, A. Weidinger, M. Hohne, E. Dietel and A. Hirsch, Chem. Phys. Lett., 1997, 279, 259–263 CrossRef CAS.
- S. Stoll and A. Schweiger, J. Magn. Reson., 2006, 178, 42–55 CrossRef CAS PubMed.
Footnote |
| † Electronic supplementary information (ESI) available. See DOI: 10.1039/c7ta03741d |
| This journal is © The Royal Society of Chemistry 2017 |