 Open Access Article
Creative Commons Attribution 3.0 Unported Licence
The water gas shift reaction over Pt–CeO2 nanoparticles confined within mesoporous SBA-16†
D.
Carta
 ab,
T.
Montini
c,
M. F.
Casula
 b,
M.
Monai
c,
S.
Bullita
b,
P.
Fornasiero
b,
M.
Monai
c,
S.
Bullita
b,
P.
Fornasiero
 c and
A.
Corrias
 *d
*d
aDepartment of Chemistry, University of Surrey, Guildford GU2 7XH, UK
bDepartment of Chemical and Geological Sciences, INSTM, University of Cagliari, S.P. Monserrato-Sestu, Km 0.700, I-09042 Monserrato, Cagliari, Italy
cDepartment of Chemical and Pharmaceutical Sciences, INSTM, ICCOM-CNR, University of Trieste, Via L. Giorgieri 1, 34127 Trieste, Italy
dSchool of Physical Sciences, University of Kent, Ingram Building, Canterbury, CT2 7NH, UK. E-mail: a.corrias@kent.ac.uk
First published on 24th August 2017
Abstract
Novel nanocomposite catalysts for the single step Water Gas Shift Reaction (WGSR) were prepared by deposition–precipitation and impregnation of Pt–CeO2 nanophases onto an ordered mesoporous silica support featuring a cubic arrangement of mesopores (SBA-16 type). The highly interconnected porosity of the SBA-16 developed in three dimensions (3D) provides a scaffold which is easily accessible to reactants and products by diffusion. The textural and morphological properties of the final catalyst were affected by the procedure utilized for dispersion of the nanophases onto SBA-16. The catalysts prepared by deposition–precipitation present highly dispersed nanocrystalline CeO2 on the surface of SBA-16 and retain a high surface area, high thermal stability and high Pt accessibility. The catalysts prepared by impregnation show improved Pt–CeO2 interaction but a more significant decrease of surface area compared to pure SBA-16, due to the confinement of the CeO2 crystallites within the mesoporous matrix. As a result, the catalysts prepared by deposition–precipitation are effective for the WGSR under working conditions in the high temperature range (around 300–350 °C), whereas the catalysts prepared by impregnation are suitable for the process operating at low temperature. Our results point out that these catalyst preparation procedures can be used to optimise the performance of heterogenous catalysts, by controlling the CeO2 crystallite size and optimizing the Pt–CeO2 contact by embedding. Improved thermal and chemical stabilities were achieved using a mesoporous scaffold.
1. Introduction
The water gas shift reaction (WGSR):| CO + H2O ⇌ CO2 + H2, ΔH0298 = −41.4 kJ mol−1 |
The WGSR is an exothermic reaction and therefore thermodynamically limited at high temperatures and kinetically limited at low temperatures. Because of this, the production of H2 in industrial large-scale plants involves a two-step process: a high temperature (HT-WGSR) step (350–450 °C) in the presence of Fe2O3–Cr2O3 based catalysts and a low-temperature (LT-WGSR) step (180–250 °C) in the presence of Cu–ZnO catalysts. The conventional Cu–ZnO-based LT-WGSR catalysts present severe limitations, such as low activity in the relevant fuel cell temperature range, pyrophoric nature and weak stability under cyclic operation.2 Recently, research has focused on noble metals (Pt, Ph, Ru, Au, and Pd) supported on reducible oxides (CeO2 and TiO2) as highly active WGSR catalysts.3 Among all the systems studied, Pt–CeO2 is regarded as the most promising catalyst due to the ability of CeO2 to undergo rapid (Ce(IV)/Ce(III)) reduction and oxidation cycles, further promoted by the addition of Pt on the CeO2 surface, with consequent enhancement of the WGS activity, in particular, in the low temperature process.4 The redox and catalytic properties of ceria are also strongly dependent on the particle size, a decrease in particle size being associated with an increase of density of oxygen defects and hence an enhancement of the number of active sites for gas–solid catalysis.5,6 However, pure ceria has a poor thermal stability and undergoes sintering at high temperatures.7–9 To overcome this problem, CeO2 is usually doped with another metal oxide (generally ZrO2 or lanthanide oxides)5 or is dispersed on a high surface area thermally stable support (such as Al2O3).5,10,11 Recently, dispersion in a silica matrix with an ordered mesoporous structure and a hexagonal symmetry such as the MCM-41 type12 and SBA-15 type6,12,13 has been proposed as a strategy to improve the thermal stability of nanocrystalline ceria. Silica-supported nanocrystalline ceria materials are of particular interest in catalysis, since the mesoporous silica supports provide thermal stability as well as a high surface area. So far, only ordered mesoporous silica supports with a hexagonal porous geometry have been used to stabilize CeO2. In this work, we address the design of novel catalysts for the LT-WGSR by dispersing Pt–CeO2 nanophases onto an ordered mesoporous silica support with a cubic arrangement of mesopores (SBA-16 type) developed in three dimensions (3D). The highly interconnected pores provide the scaffold easy accessibility from all directions to reactants and products by diffusion.14 Additionally, the SBA-16 scaffold presents high thermal stability,15 thick walls and enhanced resistance to local pore blockage,16 making it very attractive for nanoparticle dispersion.17 It should be pointed out that to successfully produce the cubic arrangement of pores typical of SBA-16 type silicas, a careful adjustment of the synthetic conditions needs to be achieved.18 For this reason the literature on SBA-16 is more limited than that on SBA-15. However, very recently the potential of SBA-16 as a support for copper-based catalysts for the WGSR has been investigated.19
In this work, SBA-16 type silica is used as a support for CeO2 and Pt nanophases with the aim of designing innovative catalysts for the LT-WGSR. The catalyst synthesis was designed to confine both CeO2 and Pt nanoparticles within the mesoporous silica scaffold. This allows us to maximize the contact between the two nanophases and to hinder their sintering, finally leading to high catalytic activity. Different wet chemistry routes were tested in order to achieve an efficient dispersion of the CeO2 and Pt nanophases in the SBA-16. A 1 wt% loading of Pt was selected based on recent findings on Pt-based catalysts for the WGS process,7 whereas two different CeO2 loadings were investigated (10 and 20 wt%). The samples were characterized by Transmission Electron Microscopy (TEM), powder X-ray diffraction (XRD), N2 physisorption and H2 chemisorption. The catalytic activity results indicate that the confinement within the SBA-16 pores is effective in stabilizing CeO2 and maximizing Pt–CeO2 interactions.
2. Experimental
2.1 Catalyst preparation
Pt–CeO2/SBA-16 catalysts were prepared either by deposition–precipitation (DP) or by co-impregnation (IMP) of dodecanethiol-protected PT nanoparticles (Pt-DT) and of cerium(IV) tetrakis(decyloxide) (Ce(OR)4) on the SBA-16 support. The details of the preparation of Pt-DT nanoparticles and of Ce(OR)4 are reported in the ESI.†![[thin space (1/6-em)]](https://www.rsc.org/images/entities/char_2009.gif) 600) block copolymer formed by a sequence of poly(ethylene oxide)–poly(propylene oxide)–poly(ethylene oxide) units with a high EO/PO ratio (EO106–PO70–EO106), as a structure directing agent. 4.0 g of P127 were added to a mixture of 30 g of water and 120 g HCl 2 M under stirring at room temperature. Tetraethoxysilane (8.5 g, TEOS, Aldrich 98%) was then added to the solution, which became opalescent due to the precipitation of the SBA-16 after about 30 minutes. The solution was left under stirring at room temperature for 20 hours and then aged at 80 °C for 2 days. The precipitate of SBA-16 was separated from the mother solution by centrifugation, washed with distilled water and dried at room temperature. The organic template (F127) was removed by calcination of the dried powder in static air at 500 °C with a heating rate of 1 °C min−1, and held at the final temperature for 6 hours.
600) block copolymer formed by a sequence of poly(ethylene oxide)–poly(propylene oxide)–poly(ethylene oxide) units with a high EO/PO ratio (EO106–PO70–EO106), as a structure directing agent. 4.0 g of P127 were added to a mixture of 30 g of water and 120 g HCl 2 M under stirring at room temperature. Tetraethoxysilane (8.5 g, TEOS, Aldrich 98%) was then added to the solution, which became opalescent due to the precipitation of the SBA-16 after about 30 minutes. The solution was left under stirring at room temperature for 20 hours and then aged at 80 °C for 2 days. The precipitate of SBA-16 was separated from the mother solution by centrifugation, washed with distilled water and dried at room temperature. The organic template (F127) was removed by calcination of the dried powder in static air at 500 °C with a heating rate of 1 °C min−1, and held at the final temperature for 6 hours.
To improve the diffusion of Pt-DT and Ce(OR)4 within the mesopores of SBA-16, the surface of SBA-16 was treated with triethoxyoctyl silane (TEOOS, Sigma-Aldrich, 97.5%) to obtain a hydrophobic support. After degassing the synthesized SBA-16, the support was suspended in 25 mL of toluene and 523 μL of TEOOS was added, and the suspension was refluxed overnight. The powder was recovered by centrifugation, washed 3 times with 10 mL of toluene and vacuum dried at room temperature. Impregnation with Pt-DT and Ce(OR)4 was performed using the same procedure adopted for the IMP_Pt@CeO2(XX%)/SBA-16 materials described above. These two catalysts will hereafter be labeled IMP_Pt@CeO2(10%)/H-SBA-16 and IMP_Pt@CeO2(20%)/H-SBA-16, where the symbol H indicates that the SBA-16 was made hydrophobic before impregnation.
2.2 Catalyst characterization
XRD patterns were recorded in the range of 15–85° (2θ) on a Panalytical Empyrean diffractometer equipped with a Cu Kα source, a graphite monochromator on the diffracted beam, and a X'Celerator linear detector. The average size of the CeO2 nanoparticles was estimated using the Scherrer formula, t = 0.91λ/(B![[thin space (1/6-em)]](https://www.rsc.org/images/entities/char_2009.gif) cos
cos![[thin space (1/6-em)]](https://www.rsc.org/images/entities/char_2009.gif) θ), where t is the crystallite size, λ is the incident radiation wavelength, θ is the Bragg angle and B is the full-width at half-maximum of the diffraction peak (corrected for instrumental broadening).
θ), where t is the crystallite size, λ is the incident radiation wavelength, θ is the Bragg angle and B is the full-width at half-maximum of the diffraction peak (corrected for instrumental broadening).
Textural characterization was performed by N2 adsorption–desorption measurements at liquid nitrogen temperature recorded on a Micromeritics ASAP2020. Prior to the analysis, the samples were outgassed under vacuum at 200 °C. Surface areas were estimated using the Brunauer–Emmett–Teller (BET) model,20,21 and pore size and pore volumes were estimated using the Non-Local Density Functional Theory (NLDFT) using the Tarazona model for cylindrical pores.22
H2 chemisorption experiments were carried out using a Micromeritics ASAP 2020C. Typically, 150 mg of the fresh material were loaded in a U-shaped reactor and reduced by flowing H2(5%)/Ar (40 mL min−1) at 200 °C for 1 h. The adsorbed hydrogen is then removed by evacuation at 300 °C for 6 h. Chemisorption analysis was performed firstly at −90 °C (liquid/solid acetone bath) dosing H2 (2–400 torr). Then, the sample was again evacuated at 300 °C for 6 h and the chemisorption analysis was repeated at 35 °C. In both the cases, the contribution of physisorption was subtracted by extrapolating the linear part of the isotherms to zero. In the case of the aged samples, the sample was speedily transferred into the chemisorption reactor after the catalytic tests and only evacuated at 350 °C for 6 h. In this case, the chemisorption analysis was performed only at −90 °C.
Scanning Electron Microscopy (SEM) coupled with Energy Dispersive X-ray spectroscopy (EDX) was performed on a Hitachi S-3400N microscope equipped with a W gun, a Secondary Electron detector and an Oxford Instruments “X-max 80” EDX spectrometer. Samples were deposited on sticky carbon tape mounted on a 15 mm aluminium stub.
Transmission Electron Microscopy (TEM) images were recorded on a Hitachi H-7000 microscope equipped with a W thermoionic filament operating at 125 kV. The catalysts were ground in an agate mortar and deposited on a carbon-coated copper grid for observations. The images were acquired using an AMT DVC CCD camera in bright field (bf) and dark field (df) modes; selected area electron diffraction (SAED) patterns were acquired with a camera length of 20 cm.
2.3 Catalytic activity measurements
WGSR activity tests were performed in a U-shaped tubular reactor at atmospheric pressure, using a reaction mixture containing CO (2.0%) + H2O (10.0%) in Ar. The gas hourly space velocity (GHSV) was set at 50![[thin space (1/6-em)]](https://www.rsc.org/images/entities/char_2009.gif) 000 mL g−1 h−1 using a total flow rate of 40.7 mL min−1 and 48.9 mg of the powdered catalyst. A granular quartz bed was put in the reactor to support the powdered catalyst while a 3 mm layer of granular quartz was put above the catalytic bed to pre-heat the gas flow. The flows of CO and Ar were adjusted using mass flow controllers while 3 μL min−1 of H2O was introduced in the gas flow by means of a gas-tight syringe, controlled by an infusion pump. Vaporization of H2O was ensured by heating the reactivity line at 120 °C by using adequate heating tapes. The composition of the effluent from the reactor was monitored on-line using a Hiden HPR20 mass spectrometer.
000 mL g−1 h−1 using a total flow rate of 40.7 mL min−1 and 48.9 mg of the powdered catalyst. A granular quartz bed was put in the reactor to support the powdered catalyst while a 3 mm layer of granular quartz was put above the catalytic bed to pre-heat the gas flow. The flows of CO and Ar were adjusted using mass flow controllers while 3 μL min−1 of H2O was introduced in the gas flow by means of a gas-tight syringe, controlled by an infusion pump. Vaporization of H2O was ensured by heating the reactivity line at 120 °C by using adequate heating tapes. The composition of the effluent from the reactor was monitored on-line using a Hiden HPR20 mass spectrometer.
Before each catalytic test, the catalysts were cleaned by treatment in O2 (5.0%)/Ar (40 mL min−1) at 400 °C for 30 min. After cooling to 150 °C, the gas flow was switched to pure Ar for 1 h to remove O2 from the system. Light-off experiments were performed by introducing the reaction mixture into the reactor and stabilizing the signals for 1 h, before increasing the temperature up to the desired value at the rate of 2 °C min−1. Aging of the catalysts was performed by maintaining the reactor at the desired temperature for the desired time, before cooling down to 150 °C at the rate of 2 °C min−1.
3. Results and discussion
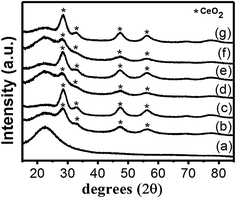
The XRD patterns of the pure SBA-16 silica support and of the synthesized catalysts are shown in Fig. 1. The pattern of pure SBA-16 (Fig. 1a) is typical of amorphous silica and only shows a broad halo at 2θ ∼ 20–30°. The XRD patterns of the catalysts are similar and show broad peaks detectable in the region 2θ ∼ 28–80° ascribed to the cubic fluorite-type structure of CeO2 (PDF 034-0394), on top of the SBA-16 background (Fig. 1b–g). As expected, the intensity of the peaks is higher for the catalysts containing 20 wt% of CeO2 compared to those containing 10 wt%. The broad XRD reflections are indicative of nanosized CeO2, having average nanocrystal sizes in the range of 2–4 nm, as calculated by the Scherrer equation (Table 1). These results indicate that nanocrystalline ceria has been effectively stabilized into SBA-16 with 10 and 20 wt% loadings. In all the materials investigated, no reflections ascribed to Pt-related phases can be detected, as expected for the low metal loading and the small size of the Pt nanoparticles,23 as already reported for various Pt–CeO2 systems.2,3,24–27| Sample | Surface areaa (m2 g−1) | Pore widtha (nm) | Pore volumea (cm3 g−1) | CeO2 crystallite sizeb (nm) |
|---|---|---|---|---|
| SBA-16 | 747 | 6.5 | 0.49 | — |
| DP_Pt/CeO2(10%)/SBA-16 | 613 | 6.5 | 0.44 | 3 ± 1 |
| DP_Pt/CeO2(20%)/SBA-16 | 773 | 6.5 | 0.49 | 3 ± 1 |
| IMP_Pt@CeO2(10%)/SBA-16 | 434 | 7.4 | 0.54 | 2 ± 1 |
| IMP_Pt@CeO2(20%)/SBA-16 | 306 | 7.5 | 0.43 | 3 ± 1 |
| IMP_Pt@CeO2(10%)/H-SBA-16 | 549 | 6.5 | 0.35 | 4 ± 1 |
| IMP_Pt@CeO2(20%)/H-SBA-16 | 304 | 6.4–7.1 | 0.28 | 3 ± 1 |
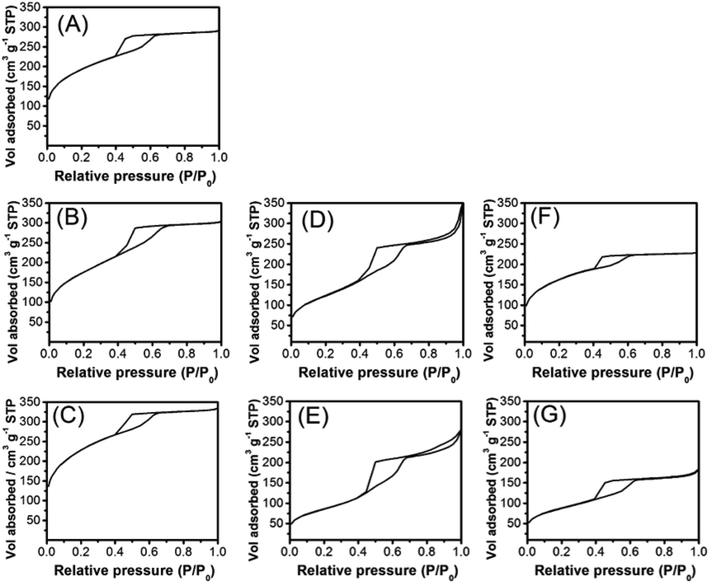
The texture of the pristine SBA-16 and of the prepared materials was studied by N2 physisorption at liquid nitrogen temperature. According to the IUPAC classification, the N2 physisorption isotherms of pure SBA-16 (Fig. 2A) can be classified as type IV isotherms with a H2 type hysteresis, typical of materials containing ink-bottle mesopores and indicative of a cage-like cubic porous structure. The N2 physisorption isotherms of the materials prepared by DP (Fig. 2B and C), indicate that the mesoscopic cubic order is preserved after the calcination treatments needed to stabilize the CeO2 and Pt components, and that the pores of SBA-16 are not significantly occluded by the deposition of the active phase. The isotherms of the samples prepared by co-impregnation on the bare SBA-16 (Fig. 2D and E) and on the hydrophobic H-SBA-16 (Fig. 2F and G) show a significant decrease in the overall adsorbed amount of N2 with respect to the pristine SBA-16 support.
The textural parameters calculated by analyzing the physisorption data are summarized in Table 1. SBA-16 has a very high surface area and pore volume, with the pore size distribution centered at 6.5 nm, in accordance with the literature.28,29 After loading of the active phase, the differences in textural properties are strongly dependent on the preparation route adopted and generally more evident for samples having a 20 wt% CeO2 loading. For almost all samples, a decrease in the surface area and pore volume is observed, although the pore size distribution is only marginally affected. The deposition of the active phase by DP causes the smallest change in surface area and pore volume while the IMP route results in a significant decrease of the accessible surface area and pore volume. The decrease in pore volume is more evident in the samples prepared using H-SBA-16 and can be associated with the occlusion of a significant fraction of pores. Notably, the process to make the support hydrophobic has been introduced in the preparation procedure in order to maximize the diffusion of hydrophobic Pt-DT and Ce(OR)4 precursors within the SBA-16 texture. It should be pointed out that plugging of the pores with the catalysts remaining on the SBA-16 surface can be excluded since this would be accompanied by a drastic decrease of the surface area which was not observed for any of the samples. It should also be noted that DP_Pt/CeO2(20%)/SBA-16 has a surface area and pore volume very similar (within the experimental error) to the pure SBA-16 sample, while DP_Pt/CeO2(10%)/SBA-16 has a slightly lower surface area.
The mesoporous structure of the catalysts and the dispersion of the nanostructured active phases in the SBA-16 matrix were investigated by TEM. The representative TEM images are shown in Fig. 3 for DP_Pt/CeO2(10%)/SBA-16 and DP_Pt/CeO2(20%)/SBA-16, in Fig. 4 for IMP_Pt@CeO2(10%)/SBA-16 and IMP_Pt@CeO2(20%)/SBA-16 and in Fig. 5 for IMP_Pt@CeO2(10%)/H-SBA-16 and IMP_Pt@CeO2(20%)/H-SBA-16. A highly ordered arrangement of mesopores can be seen in all the samples, confirming that the SBA-16 scaffold is preserved in the final material, independent of the preparation route employed, in agreement with the physisorption analysis results. The samples are composed of spherical nanoparticles homogeneously dispersed within the SBA-16 mesoporous matrix. CeO2 nanoparticles are particularly evident in the dark field images, in which they appear as bright spots. The SAED patterns of CeO2 in all the samples show rings corresponding to the fluorite CeO2 structure, confirming that the nanoparticles are crystalline (ESI, Fig. S1†). The TEM images show that the CeO2 nanoparticles are well dispersed and confined in the SBA-16 matrix. In particular, in DP_Pt/CeO2(20%)/SBA-16 (Fig. 3C and D and S2†) CeO2 nanocrystals smaller than the size of the SBA-16 pores are clearly visible both in the bright field images as dark spots and in the dark field images as bright spots. On the other hand, the CeO2 nanoparticles in the samples prepared by co-impregnation seem to be less evident compared to the corresponding DP samples. This could be justified by either a less homogeneous dispersion of the nanoparticles in the matrix or by their confinement within the SBA-16 scaffold which would make them more difficult to be detected because of the thickness of the sample under investigation. The presence of Pt nanoparticles cannot be detected in any of the materials, because of the low loading and high dispersion of Pt in the CeO2-SBA-16 matrix.23 Further information on the morphology of the catalysts and on the dispersion of the nanostructured active phases in the SBA-16 matrix was obtained by SEM coupled with EDS, as reported in the ESI (Fig S3†). As can be observed from SEM images, no CeO2 aggregates have been observed outside the SBA-16 scaffold, indicating that the active phase is deposited within the mesoporous structure of the SiO2 scaffold.
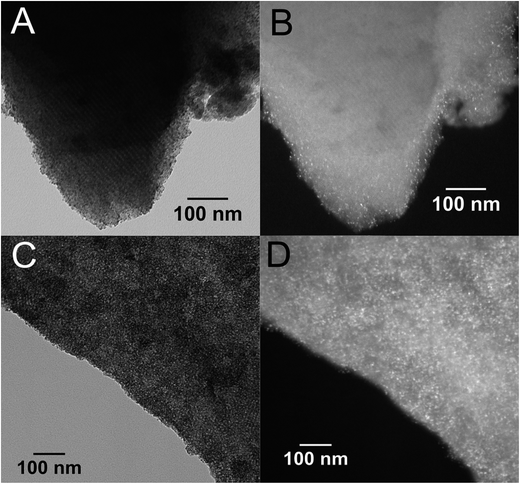 | ||
| Fig. 3 Representative TEM images of DP_Pt/CeO2(10%)/SBA-16 (A and B) and DP_Pt/CeO2(20%)/SBA-16 (C and D). Bright field (A and C) and dark field (B and D). | ||
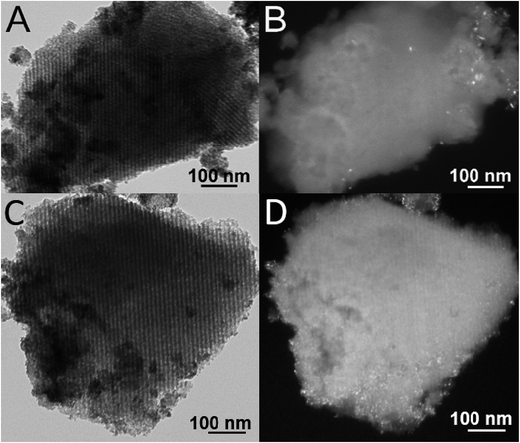 | ||
| Fig. 4 Representative TEM images of IMP_Pt@CeO2(10%)/SBA-16 (A and B) and IMP_Pt@CeO2(20%)/SBA-16 (C and D). Bright field (A and C) and dark field (B and D). | ||
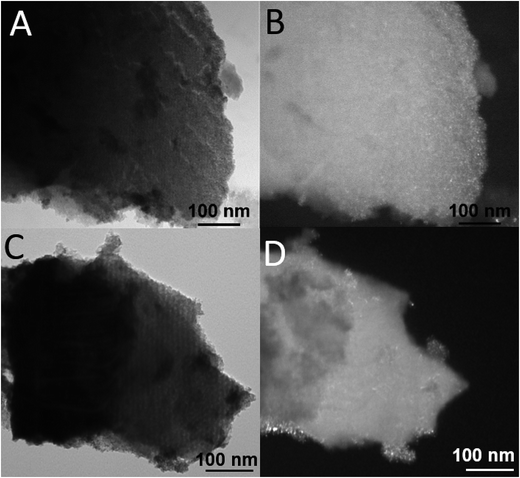 | ||
| Fig. 5 Representative TEM images of IMP_Pt@CeO2(10%)/H-SBA-16 (A and B) and IMP_Pt@CeO2(20%)/H-SBA-16 (C and D). Bright field (A and C) and dark field (B and D). | ||
H2 chemisorption analysis was employed to assess the accessibility of the Pt phase and the interaction between the Pt nanoparticles and the CeO2 promoter. It was performed at −90 °C and 35 °C, with the results summarized in Table 2. In agreement with previous H2 chemisorption studies on noble metal nanoparticles supported on CeO2-based materials,30,31 activated H atoms are spilled over the reducible oxide inducing the so-called “reversible reduction” of the promoter.32 The reversible reduction of CeO2 results in the conversion of the more superficial Ce(IV) to Ce(III) and the formation of superficial OH groups, which allow the H hopping and diffusion on the surface.32 The transfer of activated H atoms is strongly inhibited lowering the analysis temperature.30,31 In this study, the H/Pt value measured at −90 °C is used to determine the fraction of accessible Pt atoms. The results obtained indicate that the Pt accessibility depends both on the CeO2 loading and on the preparation method. A slightly lower accessibility of surface Pt is observed for the materials with the higher CeO2 content; however, the preparation method has the most prominent effect on accessibility, which is significantly enhanced in the samples prepared by the DP route, independent of the CeO2 loading. These results can be rationalized considering that the platinum precursor is impregnated after the deposition of CeO2 by deposition–precipitation on the SBA-16 support. On the other hand, the co-impregnation route could lead to a partial occlusion of Pt nanoparticles within the CeO2 nanocrystallites, in a similar manner to what was observed for Pd@CeO2/Si–Al2O3 prepared from self-assembled core–shell units.33
| Sample | H/Pt at −90 °C | H/Pt at 35 °C | R |
|---|---|---|---|
| DP_Pt/CeO2(10%)/SBA-16 | 0.743 | 1.084 | 1.46 |
| DP_Pt/CeO2(20%)/SBA-16 | 0.701 | 1.312 | 1.87 |
| IMP_Pt@CeO2(10%)/SBA-16 | 0.401 | 1.451 | 3.62 |
| IMP_Pt@CeO2(20%)/SBA-16 | 0.374 | 1.896 | 5.07 |
| IMP_Pt@CeO2(10%)/H-SBA-16 | 0.384 | 3.176 | 8.27 |
| IMP_Pt@CeO2(20%)/H-SBA-16 | 0.330 | 4.492 | 13.60 |
The H/Pt value measured at 35 °C includes the amount of H spilt over reducible CeO2. Therefore, the ratio between the H/Pt value measured at 35 °C and the one measured at 90 °C (R in Table 2) can be considered as an indication of the interaction between Pt and CeO2 nanoparticles. All the H/Pt values measured at 35 °C are significantly higher than the values measured at low temperature and, notably, higher than 1, indicating that H is effectively spilt over the CeO2 surface. Higher H/Pt values have been obtained, for each preparation method, with the materials with the higher CeO2 content, in agreement with the more extended reducible surface available to accommodate the OH groups. On the other hand, for the same CeO2 loading, the preparation method has a strong influence on the hydrogen chemisorption capacity of the samples. The materials prepared by DP show the lowest H2 chemisorption capacity although the Pt accessibility is the highest. These results indicate that the Pt–CeO2 interaction is not optimal in the DP samples, with a significant fraction of Pt nanoparticles deposited onto the free SBA-16 surface being not in direct contact with CeO2 nanoparticles. The samples prepared by impregnation of SBA-16 with Pt-DT nanoparticles and Ce(OR)4 show higher H2 chemisorption capacities and better abilities to spill activated H onto the CeO2 surface, despite the lower Pt accessibility and surface area. The impregnation methodology was designed in order to obtain Pt nanoparticles embedded into a matrix of CeO2 crystallites, with the aim of maximizing the Pt–CeO2 interaction. The spillover is further enhanced in the samples impregnated on the hydrophobic H-SBA-16 surface, indicating that this treatment allows the best distribution of the Pt and CeO2 components.
3.1 WGSR activity
The CO conversion in consecutive reaction experiments over the synthesized catalysts is presented in Fig. 6–8. CO conversion increases with increasing temperature, until the thermodynamic equilibrium is reached. The stability of the present catalysts was evaluated by simulated fast aging of the catalysts by prolonged treatment under reaction conditions at 350 °C. The light-off temperatures (T50 – corresponding to 50% of CO conversion) and the lower temperature at which the chemical equilibrium is reached (TEQ) are summarized in Table 3. Notably, no CO conversion was observed during blank experiments (the reactor containing only the quartz bed and the thermocouple), while a Pt/SBA-16 sample, not containing CeO2, showed only very poor catalytic activity, leading to CO conversion of 15% at 350 °C (ESI Fig. S4†).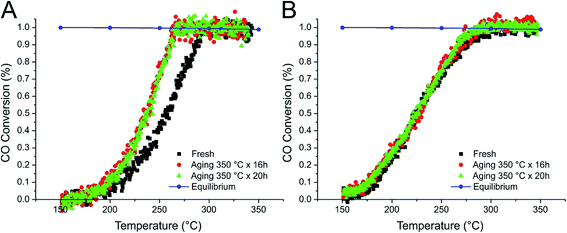 | ||
| Fig. 6 CO conversion during the WGSR over DP_Pt/CeO2(10%)/SBA-16 (A) and DP_Pt/CeO2(20%)/SBA-16 (B) catalysts. | ||
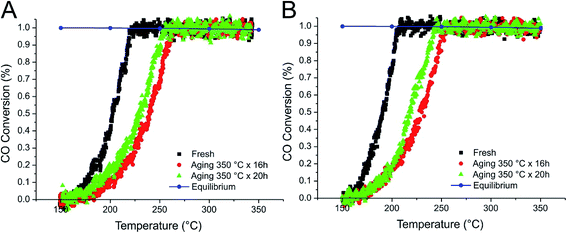 | ||
| Fig. 7 CO conversion during the WGSR over IMP_Pt@CeO2(10%)/SBA-16 (A) and IMP_Pt@CeO2(20%)/SBA-16 (B) catalysts. | ||
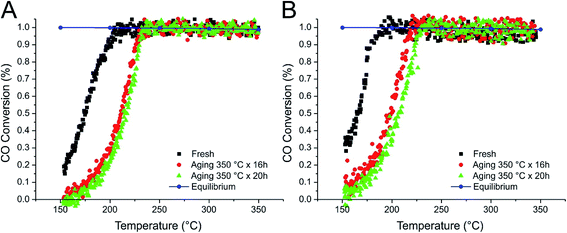 | ||
| Fig. 8 CO conversion during the WGSR over IMP_Pt@CeO2(10%)/H-SBA-16 (A) and IMP_Pt@CeO2(20%)/H-SBA-16 (B) catalysts. | ||
| Sample | T 50 | T EQ | ||||
|---|---|---|---|---|---|---|
| Fresh | Aging 350 °C × 16 h | Aging 350 °C × 20 h | Fresh | Aging 350 °C × 16 h | Aging 350 °C × 20 h | |
| DP_Pt/CeO2(10%)/SBA-16 | 258 | 237 | 239 | 294 | 262 | 265 |
| DP_Pt/CeO2(20%)/SBA-16 | 224 | 229 | 228 | 294 | 291 | 292 |
| IMP_Pt@CeO2(10%)/SBA-16 | 203 | 239 | 230 | 228 | 257 | 265 |
| IMP_Pt@CeO2(20%)/SBA-16 | 190 | 229 | 218 | 210 | 254 | 245 |
| IMP_Pt@CeO2(10%)/H-SBA-16 | 175 | 210 | 216 | 210 | 234 | 238 |
| IMP_Pt@CeO2(20%)/H-SBA-16 | 165 | 212 | 207 | 200 | 221 | 231 |
The fresh DP samples (Fig. 6) showed no activity at 150 °C while by increasing the temperature the chemical equilibrium is reached around 290 °C, irrespective of the CeO2 content. The DP_Pt/CeO2(10%)/SBA-16 sample revealed a slight increase of activity in light-off experiments after aging for 16 h, being unmodified by further 20 hours of aging. On the other hand, the DP_Pt/CeO2(20%)/SBA-16 sample showed comparable and stable activities during the consecutive aging treatments.
Significantly higher catalytic activities were observed for the IMP materials (Fig. 7 and 8), with the best performances demonstrated by the H-SBA-16 supported catalysts. The fresh IMP_Pt@CeO2(10%)/H-SBA-16 and IMP_Pt@CeO2(20%)/H-SBA-16 catalysts showed remarkable CO conversion at 150 °C (18 and 32%, respectively – Fig. 8). Despite the lower surface area and lower accessibility of Pt nanoparticles with respect to the DP catalysts, the enhanced performances of the materials prepared by impregnation can be related to the more efficient interaction between the Pt nanoparticles and the CeO2 promoter, as highlighted by H2 chemisorption experiments. In agreement with this, the oxidation of CO has been demonstrated to be strongly dependent on the extent of the Pt–CeO2 interface.34
Apparent activation energy (Eatt) values ranging from 50 to 80 kJ mol−1 were calculated from CO conversion results during the WGSR tests performed on the fresh material for all the investigated catalysts. These values are in good agreement with the results previously reported for Pt supported on reducible (CeO2 and CeO2–ZrO2)35,36 and non-reducible oxides (ZrO2 and Al2O3).35,37
After simulated aging of the impregnated catalysts at 350 °C for 16 and 36 h, some deactivation occurred, as evidenced by the shift of the light-off temperatures to slightly higher values (∼30 °C). Considering that the operating temperature of a WGSR catalyst should be quite close to the temperature at which the chemical equilibrium is reached, to further investigate the stability of the impregnated catalysts, IMP_Pt@CeO2(10%)/SBA-16 and IMP_Pt@CeO2(20%)/H-SBA-16 were aged under reaction conditions at the TEQ observed during the first light-off experiment (230 and 200 °C, respectively). Even after a total aging time of 60 hours, the aged IMP_Pt@CeO2(20%)/H-SBA-16 showed comparable light-off curves to the fresh catalyst, while the IMP_Pt@CeO2(10%)/H-SBA-16 showed only a slight deactivation (ESI Fig. S5†).
The deactivation of Pt/CeO2 catalysts is usually related to sintering of Pt nanoparticles38 or with the adsorption of intermediates, mainly formates, on the active sites.39 The latter is usually recognized as a major cause of deactivation at lower temperatures (below 300 °C), when formates are spectators of the reaction and accumulate on the catalyst surface.39 At higher temperature, formates are further converted and become intermediates in the catalytic process,39 while sintering of Pt is considered the main reason for catalyst deactivation.38 In order to hinder Pt sintering, hierarchical Pt@CeO2/Si–Al2O3 samples were prepared from self-assembled core–shell nanoparticles,40 obtaining stable catalytic activity after pre-treatment of the catalyst at 500 °C. Differently from Pt, Pd@CeO2/Si–Al2O3 demonstrates a fast decrease of the catalytic activity,40,41 mainly because of an electronic influence due to reduced CeO2−x and the partial occlusion of Pd nanoparticles within CeO2−x crystallites.41 To overcome these problems, Pd@CeO2/MWCNT hybrid materials have been synthesized, observing that the balance between the organic and inorganic components favors their electronic interaction, finally leading to stable catalytic performances in the WGSR.42
To investigate the origin of deactivation observed in the Pt/CeO2 catalysts supported on SBA-16, the materials after catalytic tests have been characterized in detail with a view to highlight differences induced by prolonged aging under WGSR conditions. Also in this case, SEM coupled with EDX does not evidence the segregation of the Pt/CeO2 active phase outside the SBA-16 (see ESI Fig. S6†). The surface area of the materials subjected to severe simulated aging at 350 °C under WGSR conditions significantly decreases with respect to the fresh materials (see ESI Table S1 and Fig. S7†). Notably, the extent of this sintering phenomenon is lower in the case of the catalysts tested under prolonged aging under realistic LT-WGSR conditions (200–230 °C) (see ESI Table S1†). The most important modification highlighted by XRD analysis (Fig. S8†) is the presence of a broad (but detectable) peak at 2θ ∼ 40°, corresponding to the main reflection of Pt. This reflection is present in all the aged samples, to a different extent depending on the material composition and preparation, being the most intense in the IMP_Pt@CeO2(XX%)/H-SBA-16 materials. This result suggests that the Pt nanoparticles undergo a partial sintering and/or crystallization process during aging under WGSR conditions. Notably, this phenomenon does not depend on the treatment temperature, being comparable for samples after severe simulated aging at 350 °C and prolonged aging under LT-WGSR conditions (200–230 °C). In agreement with this, the H/Pt values measured by H2 chemisorption analysis at −90 °C (see ESI Table S2†) are lower than those measured for the fresh materials. The decreased ability/accessibility of Pt to H2 can be due to a combination of different phenomena, including partial sintering, occlusion of Pt nanoparticles by the sintered support and some extent of electronic strong metal support interaction (SMSI). Also in this case, the decrease of H/Pt values is less important in the case of the catalysts aged under LT-WGSR conditions. On the basis of these considerations, the deactivation of the present impregnated catalysts is expected to take place following different mechanisms depending on the aging temperature. The very limited deactivation observed during aging under LT-WGSR conditions (see ESI Fig. S5†) can be related essentially to deposition of intermediates on the active sites of the catalysts. In agreement with this, deactivation is moderate and is less evident in the materials designed for maximizing the Pt–CeO2 interaction by confinement within the nanometric pores of the SBA-16 scaffold. In this case, deactivation by electronic influence of reduced CeO2−x is less important, in agreement with the characterization results of the aged catalysts and previous studies on H2 and CO chemisorption on Pt/CeO2![[thin space (1/6-em)]](https://www.rsc.org/images/entities/char_2009.gif) 43 and Pt/CeO2–ZrO2
43 and Pt/CeO2–ZrO2![[thin space (1/6-em)]](https://www.rsc.org/images/entities/char_2009.gif) 30 reduced at various temperatures. In any case, the IMP_Pt@CeO2(20%)/H-SBA-16 material showed promising performance for application as an active and stable catalyst in the LT-WGSR.
30 reduced at various temperatures. In any case, the IMP_Pt@CeO2(20%)/H-SBA-16 material showed promising performance for application as an active and stable catalyst in the LT-WGSR.
During aging at higher temperature (350 °C), a more severe deactivation occurred, in agreement with the fact that an SMSI state is obtained in the materials. The loss of catalytic activity can be related to the electronic deactivation induced by reduced CeO2−x and by encapsulation of Pt nanoparticles resulting from partial sintering of the material, in a similar manner to Pd@CeO2/Si–Al2O3 catalysts.41
The catalysts prepared by deposition–precipitation are not active enough to allow their application in the LT-WGSR, although they are not negatively affected by severe aging under WGSR conditions. The lower activity derives from the less extent of Pt–CeO2 interaction while the higher stability is obtained, thanks to the higher dispersion/accessibility of the Pt component.
4. Conclusions
Nanocomposite materials with a Pt–CeO2 active phase dispersed within highly porous silica with a well-defined cubic symmetry of a porous scaffold (SBA-16) have been prepared and tested as catalysts for the LT-WGSR, an important industrial process involved in large scale production of pure H2. Different synthetic methods have been compared with the final aim to maximize the interactions of Pt and CeO2 nanocrystallites, yielding active and stable catalysts. The preparation methodology greatly affected the textural and morphological properties of the synthesized materials. The key to achieving more active and stable catalysts is the confinement of the active phase within the SBA-16 scaffold, and the enhancement of the interaction between Pt nanoparticles and CeO2 nanocrystallites, as evidenced by H2 chemisorption and catalytic tests. The catalytic WGSR performance was optimized in IMP materials by exploitation of the interactions of functionalized Pt-DT nanoparticles with cerium decyloxide and by the hydrophobization of the SBA-16 support.Conflicts of interest
The authors declare that there are no conflicts of interest.Acknowledgements
The authors would like to thank the Fondazione Banco di Sardegna, IIT, INSTM and the University of Trieste through the FRA2015 project for support.References
- F. de Bruijn, Green Chem., 2005, 7, 132 RSC.
- L. Torrente-Murciano and F. R. Garcia-Garcia, Catal. Commun., 2015, 71, 1–6 CrossRef CAS.
- R. Jain and R. Maric, Appl. Catal., A, 2014, 475, 461–468 CrossRef CAS.
- J. H. Lin, P. Biswas, V. V. Guliants and S. Misture, Appl. Catal., A, 2010, 387, 87–94 CrossRef CAS.
- T. Montini, M. Melchionna, M. Monai and P. Fornasiero, Chem. Rev., 2016, 116, 5987–6041 CrossRef CAS PubMed.
- J. M. de Souza e Silva, M. Strauss, C. M. Maroneze, E. R. Souza, Y. Gushikem, F. A. Sigoli and I. O. Mazali, J. Mater. Chem., 2011, 21, 15678 RSC.
- R. Tiwari, B. Sarkar, R. Tiwari, C. Pendem, T. Sasaki, S. Saran and R. Bal, J. Mol. Catal. A: Chem., 2014, 395, 117–123 CrossRef CAS.
- J. Kǎspar and P. Fornasiero, Catalysis by Ceria and Related Materials, Imperial College Press, London, 2002 Search PubMed.
- A. Trovarelli, Catal. Rev., 1996, 38, 439–520 CAS.
- T. M. Onn, S. Zhang, L. Arroyo-Ramirez, Y. Xia, C. Wang, X. Pan, G. W. Graham and R. J. Gorte, Appl. Catal., B, 2017, 201, 430–437 CrossRef CAS.
- R. Di Monte, P. Fornasiero, J. Kašpar, M. Graziani, J. M. Gatica, S. Bernal and A. Gómez-Herrero, Chem. Commun., 2000, 2167–2168 RSC.
- J. Strunk, W. C. Vining and A. T. Bell, J. Phys. Chem. C, 2011, 115, 4114–4126 CAS.
- Y. D. Bi, W. Zhang, H. Y. Xu and W. Z. Li, Catal. Lett., 2007, 119, 126–133 CrossRef CAS.
- A. Salis, D. Meloni, S. Ligas, M. F. Casula, M. Monduzzi, V. Solinas and E. Dumitriu, Langmuir, 2005, 21, 5511–5516 CrossRef CAS PubMed.
- R. M. Grudzien, B. E. Grabicka and M. Jaroniec, Appl. Surf. Sci., 2007, 253, 5660–5665 CrossRef CAS.
- L. Sierra, S. Valange, J. Barrault and J. L. Guth, Microporous Mesoporous Mater., 2008, 113, 352–361 CrossRef CAS.
- D. Carta, S. Bullita, M. F. Casula, A. Casu, A. Falqui and A. Corrias, ChemPlusChem, 2013, 364–374 CrossRef CAS.
- D. Zhao, Q. Huo, J. Feng, B. F. Chmelka and G. D. Stucky, J. Am. Chem. Soc., 1998, 120, 6024–6036 CrossRef CAS.
- C. Marras, D. Loche, D. Carta, M. F. Casula, M. Schirru, M. G. Cutrufello and A. Corrias, ChemPlusChem, 2016, 81, 421–432 CrossRef CAS.
- S. Brunauer, P. H. Emmett and E. Teller, J. Am. Chem. Soc., 1938, 60, 309–319 CrossRef CAS.
- F. Rouquerol, J. Rouquerol and K. Sing, Adsorption by Powders and Porous Solids, Principles, Methodology and Applications, Academic Press, London, 1999 Search PubMed.
- P. Tarazona, U. Marini Bettolo Marconi and R. Evans, Mol. Phys., 1987, 60, 573–595 CrossRef CAS.
- T. Hyde, Platinum Met. Rev., 2008, 52, 129–130 CrossRef.
- G. Cavusoglu, D. Miao, H. Lichtenberg, H. W. P. Carvalho, H. Xu, A. Goldbach and J. D. Grunwaldt, Appl. Catal., A, 2015, 504, 381–390 CrossRef CAS.
- H.-S. Roh, H. S. Potdar, D.-W. Jeong, K.-S. Kim, J.-O. Shim, W.-J. Jang, K. Y. Koo and W. L. Yoon, Catal. Today, 2012, 185, 113–118 CrossRef CAS.
- A. Luengnaruemitchai, S. Osuwan and E. Gulari, Catal. Commun., 2003, 4, 215–221 CrossRef CAS.
- P. Lu, B. Qiao, N. Lu, D. C. Hyun, J. Wang, M. J. Kim, J. Liu and Y. Xia, Adv. Funct. Mater., 2015, 25, 4153–4162 CrossRef CAS.
- D. Carta, M. F. Casula, S. Bullita, A. Falqui, A. Casu, C. M. Carbonaro and A. Corrias, Microporous Mesoporous Mater., 2014, 194, 157–166 CrossRef CAS.
- D. Carta, G. Mountjoy, R. Apps and A. Corrias, J. Phys. Chem. C, 2012, 116, 12353–12365 CAS.
- J. Gatica, R. Baker, P. Fornasiero, S. Bernal and J. Kaspar, J. Phys. Chem. B, 2001, 105, 1191–1199 CrossRef CAS.
- J. M. Gatica, R. T. Baker, P. Fornasiero, S. Bernal, G. Blanco and J. Kaspar, J. Phys. Chem. B, 2000, 104, 4667–4672 CrossRef CAS.
- A. Norman and V. Perrichon, Phys. Chem. Chem. Phys., 2003, 5, 3557–3564 RSC.
- M. Cargnello, J. Delgado Jaén, J. Hernández Garrido, K. Bakhmutsky, T. Montini, J. Calvino Gámez, R. Gorte and P. Fornasiero, Science, 2012, 337, 713–717 CrossRef CAS PubMed.
- M. Cargnello, V. V. Doan-Nguyen, T. R. Gordon, R. E. Diaz, E. A. Stach, R. J. Gorte, P. Fornasiero and C. B. Murray, Science, 2013, 341, 771–773 CrossRef CAS PubMed.
- D. W. Jeong, H. S. Potdar, J. O. Shim, W. J. Jang and H. S. Roh, Int. J. Hydrogen Energy, 2013, 38, 4502–4507 CrossRef CAS.
- D. W. Jeong, W. J. Jang, J. O. Shim, W. B. Han, H. M. Kim, Y. L. Lee, J. W. Bae and H. S. Roh, Renewable Energy, 2015, 79, 78–84 CrossRef CAS.
- P. Panagiotopoulou and D. I. Kondarides, Catal. Today, 2006, 112, 49–52 CrossRef CAS.
- W. Ruettinger, X. Liu and R. J. Farrauto, Appl. Catal., B, 2006, 65, 135–141 CrossRef CAS.
- F. C. Meunier, D. Tibiletti, A. Goguet, S. Shekhtman, C. Hardacre and R. Burch, Catal. Today, 2007, 126, 143–147 CrossRef CAS.
- L. Arroyo-Ramírez, C. Chen, M. Cargnello, C. B. Murray and R. J. Gorte, Catal. Today, 2015, 253, 137–141 CrossRef.
- N. L. Wieder, M. Cargnello, K. Bakhmutsky, T. Montini, P. Fornasiero and R. J. Gorte, J. Phys. Chem. C, 2011, 115, 915–919 CAS.
- A. Beltram, M. Melchionna, T. Montini, L. Nasi, R. J. Gorte, M. Prato and P. Fornasiero, Catal. Today, 2015, 253, 142–148 CrossRef CAS.
- D. W. Daniel, J. Phys. Chem., 1988, 92, 3891–3899 CrossRef CAS.
Footnote |
| † Electronic supplementary information (ESI) available: Details of the synthesis of Pt and CeO2 precursors by the impregnation method, the typical SAED pattern and additional SEM characterization, additional catalytic tests and characterization of the catalyst after the WGSR. See DOI: 10.1039/c7ta03640j |
| This journal is © The Royal Society of Chemistry 2017 |

