
 Open Access Article
 This Open Access Article is licensed under a Creative Commons Attribution-Non Commercial 3.0 Unported Licence
Frustrated packing in a granular system under geometrical confinement
Sára
Lévay†
 *a,
David
Fischer†
*b,
Ralf
Stannarius
b,
Balázs
Szabó
c,
Tamás
Börzsönyi
c and
János
Török
ad
*a,
David
Fischer†
*b,
Ralf
Stannarius
b,
Balázs
Szabó
c,
Tamás
Börzsönyi
c and
János
Török
ad
aDepartment of Theoretical Physics, Budapest University of Technology and Economics, Budafoki út 8, H-1111 Budapest, Hungary. E-mail: slevay@phy.bme.hu
bInstitute of Experimental Physics, Otto von Guericke University, Universitätsplatz 2, D-39106 Magdeburg, Germany. E-mail: david.fischer@ovgu.de
cInstitute for Solid State Physics and Optics, Wigner Research Centre for Physics, Hungarian Academy of Sciences, P.O. Box 49, H-1525 Budapest, Hungary
dMTA-BME Morphodynamics Research Group, Budapest University of Technology and Economics, Müegyetem rakpart 1-3, H-1111 Budapest, Hungary
First published on 27th November 2017
Abstract
Optimal packings of uniform spheres are solved problems in two and three dimensions. The main difference between them is that the two-dimensional ground state can be easily achieved by simple dynamical processes while in three dimensions, this is impossible due to the difference in the local and global optimal packings. In this paper we show experimentally and numerically that in 2 + ε dimensions, realized by a container which is in one dimension slightly wider than the spheres, the particles organize themselves in a triangular lattice, while touching either the front or rear side of the container. If these positions are denoted by up and down the packing problem can be mapped to a 1/2 spin system. At first it looks frustrated with spin-glass like configurations, but the system has a well defined ground state built up from isosceles triangles. When the system is agitated, it evolves very slowly towards the potential energy minimum through metastable states. We show that the dynamics is local and is driven by the optimization of the volumes of 7-particle configurations and by the vertical interaction between touching spheres.
1 Introduction
The geometry and efficiency of packing of granular ensembles is one of the fundamental problems in their description. Even for regular grain shapes, our understanding of packing structures is by far not complete, irrespective of considerable advances in recent years (e.g.ref. 1–6). Several sub-problems have to be distinguished, among them is the question of the maximum density and other characteristics of a randomly packed arrangement, the so-called random close packing, or the quest for the maximum achievable packing density in regular structures. In this study, we consider a system that is neither completely random nor completely ordered. After filling a flat container with monodisperse spherical particles, the boundary conditions force the grains into an almost ordered lattice. The system adopts a state intermediate between perfect order and complete randomness.The densest regular arrangement of monodisperse spheres is seemingly among the simplest packing problems, but its solution took scientists considerable efforts. Kepler's conjecture that monodisperse spheres cannot be packed more densely than the hexagonal close-packed (HCP) or face-centered cubic (FCC) crystal structures was finally proved by Hales,7 almost four centuries later. The question of densest packing is trivial for identical disks in two dimensions (2D), where a regular triangular grid is the densest configuration, maximizing the packing density both locally and globally. In 3D sphere packings, however, the locally optimal structures are tetrahedrons, which are not space-filling. If dimension is further increased, the crystallization becomes ever rarer.8 Boundaries and restricting container sizes further complicate the analysis of packing problems, even in simple container geometries like cylinders or cuboids.9–16
Narrow containers are known to favour glass or jammed state where the particle displacement is limited by caging effect. This transition along with the possibility of a Gardner transition could be of importance.17,18
The system studied here, a flat cuboid cell, is at the transition from 2D to 3D.14 If the cell thickness D (in direction y) is exactly equal to the particle diameter d, the best packing is the regular equilateral triangular lattice. However, as soon as the container is chosen slightly thicker than the particle diameter, D = d + δ > d, the packing can be optimized using the third dimension by distributing individual spheres between positions at the front and rear cell plates19,20 (Fig. 1).
 | ||
| Fig. 1 Schematic drawing of the experiment. Spheres touching the front of the cell are labelled dark, spheres touching the rear side are drawn bright. Left: Locally, a nearly regular triangular lattice is formed except of lattice defects. The black and red triangles show examples of the two local triangular configurations described in the text. Right: The side view shows schematically only the first layer of visible spheres. The lattice distortion is exaggerated. | ||
The ground state of such a system is not trivial and strongly depends on the width of the container.19,20 If it is only slightly larger than the particle diameter, the optimal packing in the x–z plane is still a triangular lattice. This is indeed realized, usually with only few lattice defects. The lattice constant in the triangular lattice between two particles depends on the placement of the particles: if they are touching the same wall the distance is the particle diameter d. If they are located at opposite walls, the distance becomes  . If one replaces the terms ‘front’ and ‘rear’ by up and down and considers the particle positions as spins, the system looks analogous to an antiferromagnetic Ising model on a triangular lattice,21 which is known to be frustrated. However, our system is not driven by Ising dynamics. The problem of frustrated geometry finds an analogy for example in colloidal layers as well.22 For connectivity with this context and with previous work on the same granular packing problem,16 we will refer to the connection between neighbouring spheres positioned at the same container side as ‘frustrated bond’, even though the treatment proposed in this paper is based exclusively on the related geometry of the individual lattice cells.
The effect of the third dimension on the packing efficiency is evident mathematically when one considers the projection of the triangles formed by the centres of mass of three touching spheres onto the cell plane. Thus in the present work we consider this area rather than the volume determined by the centres of mass of particles. The lattice contains two types of such triangles: (i) an equilateral one when all three spheres are located at one cell plate. This triangle has a side length of d and an area of  (black triangle in Fig. 1). (ii) An isosceles triangle if one of the spheres is located at the cell plate opposite to the two others. The latter one has a reduced area
  with δ = D − d ≪ D (red triangle in Fig. 1). Thus the optimal packing is achieved with only isosceles triangles.
The space cannot be arbitrarily filled by identical isosceles triangles, they must be placed in a well defined pattern to be space filling, thus structures larger than the triangle will be important for the system. Such configurations were already defined in an earlier publication16 as shown in Fig. 2. Later when referring to a configuration in this work we will use the numbering from 1 to 13 as also introduced in Fig. 2. In previous studies of similar systems,16,22–24 the 13 configurations were designated by two-digit numbers, where the first digit refers to the number of frustrated bonds of the central site, the second one distinguishes three sub-configurations of each of the configurations with 2, 3, and 4 frustrated bonds. The introduction of these sub-categories for sites with a given number of frustrated bonds was then motivated by the employed model, for which the number of frustrated bonds per site is an essential parameter. Here, we list this notation to facilitate the comparison with the earlier studies.
 | ||
| Fig. 2 Designation of the 13 local configurations of the packed spheres tabbed by the number of diameter length bonds of the central site. Dark and bright fillings indicate their position at opposite cell plates. | ||
With increasing distance between the parallel cell plates, the distortion of the triangular mesh increases, and finally a gradual transition to complex 3D packing structures takes place by successive morphological transformations.14,25–27 Evidently, there is no general proof that the system reaches the optimum packing in this geometry so far, but a substantial amount of experimental data have been collected in colloidal systems.14,19,22–29
It has been shown earlier, that identical spheres packed in a cell with a thickness D ≈ 1.3d develop geometrically frustrated structures.16 After initial preparation of the cell, the spheres adopt a distorted triangular lattice where even after very long mechanical agitation periods, an optimal regular crystalline packing is not achieved. The analogue of a 3D crystallization into HCP or FCC would be the organization of the beads into alternating bands of spheres touching the rear or front faces of the cell in our flat container. This configuration is practically never reached in the experiment. The frustration arising from incompatible local band structures and the energy free interface is most likely the reason for the long metastable states.
This study focuses on modelling the evolution of the system after validation by experimental and simulation results with the aim to discover the driving mechanism behind the evolution of the system and to give a possible answer for the apparent stalling of the dynamics.
2 System
2.1 Experimental setup
The setup consists of a vertical sandwich cell which is filled with about 5700 precision glass spheres (diameter d = 2.0 ± 0.02 mm) and then carefully placed on a plate that can be vibrated by voice coils. A picture of the experimental setup is shown in Fig. 3. The left-hand side shows the setup in viewing direction of the camera, normal to the cell plane. The right-hand side shows the camera, the cell and the voice coil activating vertical vibrations. | ||
| Fig. 3 Front (left) and side view (right) of the experimental setup. The cell is illuminated in reflection. It can be exposed to vertical vibrations with frequencies up to 100 Hz and amplitudes of a few mm. The acceleration sensor records the excitation dynamics. | ||
The thickness D of the cell is chosen to be 1.3 times the diameter d of the spheres (A′ = 0.94A), the other two dimensions are large with respect to the particle diameter (approximately 70 × 70 spheres). The cell is placed upright, so that the most dense packing of the spheres is energetically favoured. After gravitational filling from the top, one finds a nearly ordered arrangement, consisting of domains with a deformed triangular basic grid (Fig. 4(a)). In this initial state, there are multiple domains of spheres in contact with each other, separated by grid defects where spheres have less than 6 neighbours. By agitation (here in the experiment a harmonic vertical vibration of the cell), these defects can be largely annealed, and a denser packing is reached with stationary statistical properties (Fig. 4(b)).
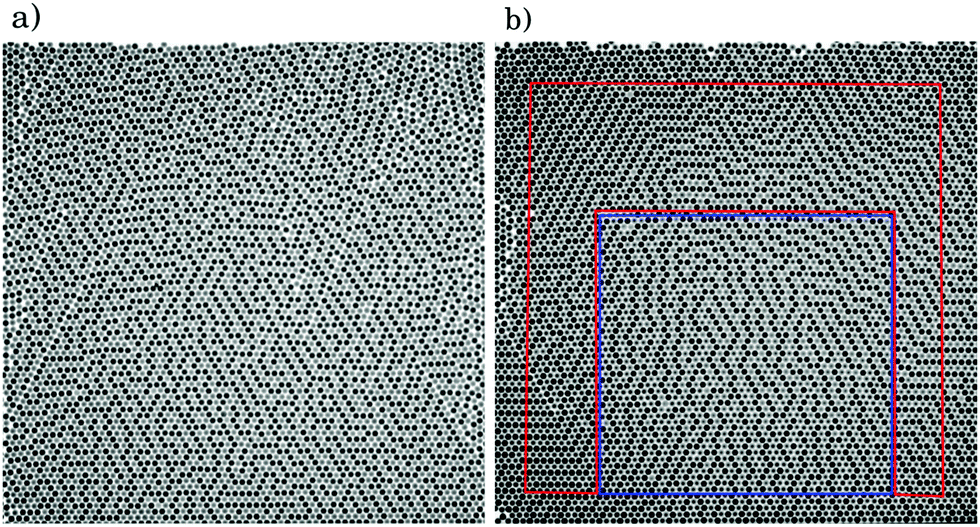 | ||
| Fig. 4 Snapshots of an experiment. (a) Typical initial configuration of the spheres after gravitational filling from the top. (b) Typical configuration after 100 shaking intervals of 5 sinusoidal shakes each, at a maximum vertical acceleration of 3.0 g. Due to the illumination technique particles touching the front face appear darker than those touching the rear face. Red and blue regions are discussed below. | ||
The front side of the cell is photographed and the distinction of front and rear spheres is easily performed with image analysis. From the evaluated particle positions, we group the surroundings of each sphere with 6 neighbours into 13 different configurations which are shown in Fig. 2. Two particles are considered as neighbours if the distance between them is smaller than a particle diameter plus a tolerance of 5%. Dark and bright fillings indicate the positions of the spheres (‘f’ or ‘r’). Each configuration appears twice, one with the central sphere at the front face (black meaning ‘f’) and one with the central sphere at the rear face (black meaning ‘r’), and of course the configurations appear in different orientations, configuration 7 additionally in mirrored form (see Table 1 below).
| Configuration | 1 | 2 | 3 | 4 | 5 | 6 | 7 |
|---|---|---|---|---|---|---|---|
| Equilateral Δ | 0 | 0 | 1 | 0 | 0 | 2 | 1 |
| Number of permutations | 1 | 6 | 6 | 6 | 3 | 6 | 12 |
| Configuration | 8 | 9 | 10 | 11 | 12 | 13 |
|---|---|---|---|---|---|---|
| Equilateral Δ | 0 | 3 | 2 | 2 | 4 | 6 |
| Number of permutations | 2 | 6 | 6 | 3 | 6 | 1 |
2.2 Simulation setup
We used the LAMMPS30 discrete element method (DEM) simulations to study the system. Since only the relative sizes of sphere diameter and cell gap play a role, we use a dimensionless length scale in the simulations, all lengths are given in units of the sphere diameter. Each simulation involved 6000 monodisperse particles (diameter d = 1 in dimensionless units). This results in a system with dimensions of approximately 70 × 70 (x and z directions), corresponding to the experimental conditions. The cell thickness (direction y) was set to D = 1.3. Periodic boundary conditions were applied in the x direction. Some simulations were repeated with vertical walls similar to the experiment, but no quantitative difference was observed. The particle–particle friction coefficient was set to μ = {0.05,0.1}. The low friction coefficient was used to counterbalance the increasing contact time due to the softness of particles in DEM simulations. The stiffness of the particles was k = 105 in units of ρgd2, where ρ is the particle density, and g is the gravitational acceleration. This stiffness is much (5–6 orders of magnitude) lower than that of the glass.In order to prepare the sample, two alternative methods were employed: (i) the particles were placed randomly in a cell with a height of about 2–3 times the height of the resulting granular bed, or (ii) an almost regular triangular lattice was created (the lattice constant was d = 1) with random positions in the y direction. The simulation was started with the introduction of gravity. The initial configuration was obtained when all particles got to rest. These two preparation methods differ in the sense that the first method results in a system with more lattice defects.
Due to the softness of the particles, high frequency agitation is absorbed by the first few particle layers. Relaxation by high amplitude shaking takes simply too long, therefore we chose another method to simulate the agitation: the particles were lifted up with a given displacement of G = 2d…10d and were then released to fall down and relax. This method provided the most efficient way to mimic the evolution of the experimental system.
3 Results
In order to demonstrate the evolution of the system we take Fig. 4(a) and (b) as an example, where the experimentally observed initial and later, partially ordered configurations are shown. Generally, agitation leads to a more ordered system, where most of the lattice defects disappeared. Moreover the system develops alternating stripes of particles touching the front and the back plane in respectively. In colloid systems the ground state was found to be similar but with perfectly straight alternating stripes.19 We will show that such a perfect order is not needed for the ground state. Such alternating stripes were found already in granular systems, namely in two-dimensional chute flows where the alternating stripes are composed of particles rotating in different directions.31Analyzing the inner (blue) and outer (red) regions of Fig. 4(b) separately, we find that the outer part became a nearly perfect layered crystal, while the central region changed less during agitation. This might be due to the initially lower number of lattice defects in the central region. Altogether the decreasing number of defects results in a denser system, where the majority of the particles is in a configuration with six neighbours.
Our simulations reveal, that the defects often move out of the system by forming waves (see Fig. 5). At the same time the volume gained by the optimized configuration will be filled by particles from above. This lattice defect propagation can locally create much stronger agitation than the external input. The resulting lattice formed by the particles can contain small defects. Ordering is not perfect, as can be seen in the last snapshot of Fig. 5.
 | ||
| Fig. 5 An example of domain boundaries propagating through the system in the DEM simulations. The first snapshot was taken after the 230th shaking period, and the others in steps of 30 shakes. Blue particles have less than 6 neighbors, the others have 6. Red particles touch the front, green ones the rear wall. | ||
The other important observation is that the agitation leads to a strong change in the statistical weight of the local 6 neighbour configurations defined in Fig. 2. The evolution of the probability distribution of the 13 configurations is shown for 200 shaking periods in Fig. 6 for experiments and simulations. The occurrence of configurations 4 and 5 increases by about 15% in both cases, though not always monotonically. In contrast, the portion of all other configurations decreases. The most favoured configurations are 4 and 5 with a tendency for the latter to win at long-term. This corresponds to the fact that the biggest drift takes place from configuration 7 to 5. In terms of packing fraction configuration 1, 12 and 13 are the least preferential, they are practically absent in both experiments and simulations (see Fig. 6).
 | ||
| Fig. 6 Temporal evolution of the probability distribution of the 13 different configurations. Each column is assembled from 40 vertical bars corresponding to the probability distribution in subsequent intervals of 5 periods of agitation (from left (blue) to right (red)). Top: An average over three experiments of 40 sinusoidal shaking intervals at a maximum vertical acceleration of 3.0 g. Bottom: Corresponding DEM simulation (random initial preparation method, μ = 0.05). | ||
Fig. 4(b) shows that the outer part contains almost exclusively configurations 4 and 5 while in the central region other non-optimal ones are also seen. It is also apparent especially in the lower part that most of the stripes are horizontal. We measured and indeed found that 60% of configuration 5 is horizontal.
The system is characterized by a triangular lattice structure (with some lattice defects) where one principle direction is horizontal. The force network of the system has naturally the major forces in one of the diagonal directions where the magnitude of the forces is normalized by the hydrodynamic pressure. Our simulations show that in the starting configurations in average the horizontal component of the diagonal forces is the same as the average horizontal force. This means that there is no bias in the directions. After more than 450 shakings the number of forces remains the same, but the horizontal forces get almost half as small as in the initial configurations. This has two important implications, first direction of gravitation is very important for the late stage, second the resulting configurations have much less frustration than in the initial one.
In order to gain a deeper insight into the mechanism determining the configuration statistics, we calculated for each configuration the mean local area (polygon formed by the centres of mass of six neighbours, after a projection to the x–z plane) and the probability of its occurrence in the experiments (Fig. 7). There is a clear anticorrelation. The closest local packing has the highest probability of occurrence.
 | ||
| Fig. 7 Comparison of the mean area each configuration occupies (in square of particle diameter units) and its probability of occurrence. The magenta set corresponds to the time after gravitational filling, the purple one corresponds to the final state after 500 shakes. Calculation obtained from the same experimental data as plotted in Fig. 6 top. | ||
4 Model
The above described observations suggest that the specific configurations of 7 particles (Fig. 2) play an important role in the dynamics of the system. The minimal distance between two neighbouring particles is different if they are in or out of plane. For such a system the position of the particles in the configurations is not well defined. Due to the compaction effect of shaking, the minimal area each configuration takes up is of interest.We calculated analytically the minimal area of the hexagons given by the centres of the six neighbours for all 13 configurations presented in Fig. 2. These configurations contain 6 triangles. There are two types of them: (i) equilateral with side length of unity and (ii) isosceles with a longer (ll = 1) and two shorter sides ( , see Table 1). As we will see, some of the configurations can be perfectly covered with such triangles, but most of them can not. This estimation may serve as a theoretical minimum.
For the equilateral triangles, all three angles are 60°. For the isosceles, two angles are equal to  , while the third one is equal to
  . If we sum up all the angles around the central particle, three possibilities can occur: (i) if the sum is exactly 360°, then there is no need to distort any of the triangles, and the minimal area is found. The corresponding configurations are 4, 5, 9 and 13. (ii) If the sum is less than 360°, then the minimal area is found where all the 6 particles are closely packed around the central one, and only one triangle is distorted. The area is minimized if the selected triangle is the one, with the shortest edges connected to the central particle. These configurations are 7, 8, 10, 11 and 12. (iii) If the sum of the angles is more than 360°, then the optimum is always found where 5 particles are closely packed around the central one, and the sixth one is pushed out, therefore it does not touch the central one anymore. The two neighbours of the 6th grain should be on the opposite side compared to the central particle, and the sixth grain should be on the same side as the central one, if possible. The configurations 1, 2, 3 and 6 are falling into this case.
We verified the above reasoning by using a simple kinetic Monte Carlo method using simulated annealing to calculate the minimal projected area a configuration takes up. The Monte Carlo method started from an equilateral configuration with distance 1 between the particles. The elementary step was the small random displacement of a particle in a random direction. The move was accepted only if there was no overlap between the particles, with the standard Metropolis algorithm: accepting a move with probability 1 if the area decreases and with probability exp(−ΔV/T) if the area increases. T was an artificial temperature that decreased slowly during the simulation.32 The simulation confirms the analytic calculation as shown in Fig. 8.
 | ||
| Fig. 8 Area of the different configurations (in units of the square of the sphere diameter). Red: minimal areas from simulated annealing with dynamic Monte Carlo simulation. The black dashed horizontal lines indicate areas corresponding to i large equilateral and 6 − i small isosceles triangles with i = 0 lowest and i = 6 highest. Green: minimal areas calculated analytically. Black diamonds: the corresponding ‘ideal’ areas. Magenta, blue: mean values calculated from experimental data. The magenta circles correspond to the state directly after gravitational filling, the blue asterisks to the ordered state after a total number of 5000 shakes. Configurations 1 and 13 did not appear in the experiments. | ||
Four configurations, 4, 5, 9, 13, do not have frustration in the sense that all particles can be placed next to each other. Moreover, they are space-filling: the complete lattice can be covered by any of these configurations. Obviously, the minimal-area configuration is composed of configurations 4 and 5. This confirms why we see the increase of the occurrence of these two configurations in the experiments and simulations.
Once we have access to the minimal area of the different configurations, a Monte Carlo (MC) simulation of the whole system can be carried out. Our conjecture is the following: as the spheres fall down the energy is dissipated though inelastic inter-particle collisions. As the system cools down the particles are driven by gravity to lower their centre of mass, namely to minimize the packing area. First this means a triangular lattice, and then it may be further optimized by particles choosing sides that optimize the area of local configurations.
In our model we will focus only on the second part of the optimization and assume a perfect triangular lattice. We thus perform a Monte Carlo simulation where the elementary step is the swap of a randomly chosen particle from one side of the cell to the other. The energy of the system is defined as the total area occupied by the configurations. Since each single particle is part of seven local configurations, the above elementary step affects seven local configurations. The dynamics defined here will be referred to as local packing fraction model. This model has two parameters: the temperature T and the number of MC time steps t. Note that one MC time step is equivalent to N elementary steps, where N is the number of particles in the system.
We note that the approximate local description used here is fundamentally different from the antiferromagnetic model introduced in ref. 16 for the same system, where only the effect of local frustration was considered.
Starting from a triangular lattice where the y position of the particles (touching front or rear plane) is completely random, we performed several simulations with different temperature and MC time step. For each parameter pairs we did an ensemble average. These results are then fitted to the reference experimental and numerical configurations using least square fit of the occurrence probability of different configurations. The best fit was searched using parameter scan combined with gradient method.
The distributions of the configurations in the initial state of the simulations are shown in Fig. 9 with the fitted distribution from the model. The time t for the best fit in both cases is t = 1 MC, which indicates that during preparation once the particles found their place in the lattice, they had enough kinetic energy to change side only once, which we believe is reasonable. Significantly smaller kinetic energy would not allow changing side, while in case of much larger kinetic energy, the particle would not sense the local configuration.
 | ||
| Fig. 9 Fit of the distribution of the configurations in the initial state with the Monte Carlo simulation for different coefficients of friction. | ||
The temperature for the case of the larger friction coefficient is around 1.5 times larger than for the system with half as large μ. Thus the case with larger μ is closer to the random case (large temperature means particles change side almost irrespective of the configuration area) as it is expected, since it is more difficult for a more frictional particle to change side thus the starting configuration will be closer to the random one.
This model can describe the initial configurations reasonably well, but fails to deliver comparable results for the late stage of the system, especially for the experiments. This is due to the fact that configuration 5 gets an important dominance even with respect to configuration 4, which cannot be achieved by any model based solely on configuration areas.
If we look at the late stage of the experiments, it is obvious that the majority (it was measured to be about 60%) of configuration 5 appears horizontally. Gravity thus plays an important role in selecting these configurations. This has the consequence that vertical frustrations are more important than horizontal ones. During the process of settling down, particles will look for places which have minimal frustration with the particles below them, but will not consider much the horizontal neighbours, and top neighbours are still too agitated to have strong influence on them.
This idea was put into the local packing fraction model by introducing an artificial energy term Eb arising from three particle vertical frustration. The Eb energy term is added to the area, if the particle has the same position as the two particles supporting it. This so called combined model can describe all cases with three parameters (T, t, Eb) with reasonable accuracy.
We fitted different snapshots of the experimental and numerical data at different time. The result is plotted in Fig. 10. The model captures well the evolution of the statistics of the configurations, though sometimes certain configurations are overestimated (e.g. configuration 2 in Fig. 10(a)), or underestimated (e.g. configuration 8 in Fig. 10(b)).
 | ||
| Fig. 10 Fit of the distribution of the configurations after shaking by the combined model: (a) ensemble averaged experiment, (b) DEM simulation (using the random displacement method). The different lines show states after 10 shakes. | ||
Fig. 11 shows the fitted model time parameters of the combined model versus the number of shakes for the experiment and two simulations. We see that the curves increase faster in the early stage but slow down later, especially in the case of numerical simulations started from a triangular lattice, where the system seems to be completely frozen after 33 shakes. If instead of fitting ensemble averaged results, in fits to individual tests the fitted MC time increases in steps, which can be attributed to large movements of lattice defects that diffuse slowly out of the system.
 | ||
| Fig. 11 Fit of the time parameter of the model for experiments and simulations. | ||
5 Discussion
Our results suggest that the shaking of the system is too weak for optimizing the configurations and it remains trapped in a metastable state. The lattice defects on the other hand introduce much larger local perturbation and make the system evolve. This also explains the fact that the outer part of the experimental system in Fig. 4 is more ordered than the inner part. Here, the wall serves as a source of defects due to the small space left next to it, which makes the system evolve faster in these areas. A nice example of this effect is shown in Fig. 12, where the middle region hardly evolved, i.e. blue data values are the same as those in the initial configuration (green data). In the outer region, however, where initially more defects were present due to the wall, the system could evolve and finally only configurations 4 and 5 remained (see red data). Fig. 12 also contains configuration distributions from the model fitted to the experiments. The inner region was fitted with parameters T = 0.04, Eb = 0.0001, t = 1, the outer region with T = 0.04, Eb = 0.1, t = 18. We note that the fit parameters indicate that the vertical frustration is not very important in the preparation phase but gets comparable to the area differences when shaken and the particles are close to or above defects. | ||
| Fig. 12 Different parts of the system are more or less affected by the agitation (framed with red and blue in Fig. 4, respectively). Configuration 5 is dominant in those parts which are strongly affected. Fits of the model (defined in Section 4) are also presented. | ||
The temperature of the fit with T = 0.03–0.06 is already very small, but even this small temperature is achieved only by the help of defects. If the defects disappear from the system, it gets frozen at least for the timescale accessible by our simulations. This is shown by the comparison of two simulations in Fig. 11, where one was prepared by randomly dropping the particles in the container, while the other one started with a perfect triangular lattice. Clearly the evolution of the system with ordered initial condition is much slower than that of the random one.
We have a further justification for the importance of the defects and the local dynamics. To this end we measured the bulk density of our samples in time (Fig. 13). We have found that there is a fast compaction at the very beginning when the equilateral triangles are converted to isosceles ones. The packing fraction changes only marginally after this initial state strengthening our previous argument about local dynamics of the defects.
 | ||
| Fig. 13 Global packing fraction of the particles inside the cell in DEM simulations: ensemble averaged simulation with the lattice preparation method and random displacement method. | ||
We have also tested our system with higher agitation in simulations in an attempt to increase the driving temperature. Unfortunately, this destroyed the triangular structure of the system. This suggests that different energy input method is needed if we want to study the frustrated dynamics of the local configurations.
We found that our system was almost solely driven by defects and otherwise the particles remained mainly jammed. Therefore it would be of importance to move towards a limit where more energy can be pumped into the system without destroying the triangular structure. We propose two ideas: (i) close the system from above. This solution has the advantage that it can be realized both in experiments and simulations and the energy input can be increased without breakup of the triangular order, moreover it would allow us to define a global volume fraction and compare the results to other dynamical compaction models.33 (ii) Introduce local agitation in the simulation. This would be a colloid limit of our setup. This may also allow us to properly characterize the jamming transition in this system, and test whether a Gardner transition17,18,34 in this small dimensional system is present or not.
6 Summary
We have studied a granular system consisting of uniform spheres in 2 + ε dimensions, where the particles are enclosed in a container barely wider than the particles. The ground state of such a system is a triangular lattice with parallel stripes of particles touching alternately the front and the rear plane.We have shown that agitation changes the structure of the sample and drives it closer to the optimal configuration. Local structural changes require high activation energy, thus the system can remain trapped in a domainwise optimized structure, where the incompatibilities between these domains remain unsolved for long agitation periods.
The system is driven by the area change of local configurations in a two particle radius space and by the antiferromagnetic vertical alignment. Using these ingredients we could fit the numerical and experimental results using simple Monte Carlo models. We have also shown that defects in the triangular lattice play an important role in the dynamics of the system, as they act as an activation source and help the development of an optimized configuration.
The system thus behaves neither as a 2D nor as a 3D system. The well defined global optimal configuration is also the local optimal configuration, but due to orientational frustration this optimal state is difficult to reach. Moreover this slow process cannot be sped up since the input energy is limited by the level which would destroy the triangular lattice.
Conflicts of interest
There are no conflicts to declare.Acknowledgements
The authors thank Torsten Trittel for help with the programming of the evaluation software and for fruitful discussions. We acknowledge financial support by the German DFG (Grant No. STA 425/38-1), by the Hungarian NKFIH (Grant No. K 116036) projects and by the DAAD/MÖB researcher exchange program (Grant No. 64975).References
- A. Donev, I. Cisse, D. Sachs, E. A. Variano, F. H. Stillinger, R. Connelly, S. Torquato and P. M. Chaikin, Science, 2004, 303, 990–993 CrossRef CAS PubMed.
- S. Torquato and Y. Jiao, Phys. Rev. E: Stat., Nonlinear, Soft Matter Phys., 2009, 80, 041104 CrossRef CAS PubMed.
- S. Torquato and F. H. Stillinger, Rev. Mod. Phys., 2010, 82, 2633 CrossRef.
- E. G. Teich, G. van Anders, D. Klotsa, J. Dshemuchadse and S. C. Glotzer, PNAS, 2016, 113, 1483–1485 CrossRef PubMed.
- A. T. Cadotte, J. Dshemuchadse, P. F. Damasceno, R. S. Newman and S. C. Glotzer, Soft Matter, 2016, 12, 7073–7078 RSC.
- A. Haji-Akbari, E. R. Chen, M. Engel and S. C. Glotzer, Phys. Rev. E: Stat., Nonlinear, Soft Matter Phys., 2013, 88, 012127 CrossRef PubMed.
- T. C. Hales, Ann. Math., 2005, 162, 1065–1185 CrossRef.
- J. Van Meel, B. Charbonneau, A. Fortini and P. Charbonneau, Phys. Rev. E: Stat., Nonlinear, Soft Matter Phys., 2009, 80, 061110 CrossRef CAS PubMed.
- R. McGeary, J. Am. Ceram. Soc., 1961, 44, 513–522 CrossRef CAS.
- M. M. Roozbahani, B. B. Huat and A. Asadi, Powder Technol., 2012, 224, 46–50 CrossRef CAS.
- Y. G. Stoyan and G. N. Yaskov, Int. Trans. Oper. Res., 2010, 17, 51–70 CrossRef.
- A. Mughal, H. Chan, D. Weaire and S. Hutzler, Phys. Rev. E: Stat., Nonlinear, Soft Matter Phys., 2012, 85, 051305 CrossRef CAS PubMed.
- J. Reimann, A. Abou-Sena, R. Nippen and P. Tafforeau, Fusion Eng. Des., 2013, 88, 2343–2347 CrossRef CAS.
- P. Pieranski, L. Strzelecki and B. Pansu, Phys. Rev. Lett., 1983, 50, 900 CrossRef CAS.
- I. Bratberg, K. Måløy and A. Hansen, Eur. Phys. J. E: Soft Matter Biol. Phys., 2005, 18, 245–252 CrossRef CAS PubMed.
- K. Harth, A. Mauney and R. Stannarius, Phys. Rev. E: Stat., Nonlinear, Soft Matter Phys., 2015, 91, 030201 CrossRef CAS PubMed.
- P. Charbonneau, J. Kurchan, G. Parisi, P. Urbani and F. Zamponi, Annu. Rev. Condens. Matter Phys., 2017, 8, 265–288 CrossRef.
- C. Hicks, M. Wheatley, M. Godfrey and M. Moore, 2017, arXiv preprint arXiv:1708.05644.
- A. Fortini and M. Dijkstra, J. Phys.: Condens. Matter, 2006, 18, L371 CrossRef CAS PubMed.
- E. C. Oğuz, M. Marechal, F. Ramiro-Manzano, I. Rodriguez, R. Messina, F. J. Meseguer and H. Löwen, Phys. Rev. Lett., 2012, 109, 218301 CrossRef PubMed.
- G. Wannier, Phys. Rev., 1950, 79, 357 CrossRef.
- Y. Han, Y. Shokef, A. Alsayed, P. Yunker, T. C. Lubensky and A. Yodh, Nature, 2008, 456, 898 CrossRef CAS PubMed.
- Y. Shokef, A. Souslov and T. C. Lubensky, Proc. Natl. Acad. Sci. U. S. A., 2011, 108, 11804–11809 CrossRef CAS PubMed.
- Y. Shokef, Y. Han, A. Souslov, A. Yodh and T. C. Lubensky, Soft Matter, 2013, 9, 6565–6570 RSC.
- B. Pansu, P. Pieranski and L. Strzelecki, J. Phys., 1983, 44, 531–536 CAS.
- S. Neser, C. Bechinger, P. Leiderer and T. Palberg, Phys. Rev. Lett., 1997, 79, 2348 CrossRef CAS.
- S. Neser, T. Palberg, C. Bechinger and P. Leiderer, Opt. Methods Phys. Colloidal Dispersions, 1997, 104, 194–197 CAS.
- F. Ramiro-Manzano, E. Bonet, I. Rodriguez and F. Meseguer, Soft Matter, 2009, 5, 4279–4282 RSC.
- R. Bubeck, S. Neser, C. Bechinger and P. Leiderer, Trends Colloid Interface Sci. XII, 1998, 110, 41–45 CAS.
- S. Plimpton, J. Comput. Phys., 1995, 117, 1–19 CrossRef CAS.
- S. Luding, Nonlinearity, 2009, 22, R101 CrossRef.
- N. Metropolis, A. W. Rosenbluth, M. N. Rosenbluth, A. H. Teller and E. Teller, J. Chem. Phys., 1953, 21, 1087–1092 CrossRef CAS.
- N. Kumar and S. Luding, Granular Matter, 2016, 18, 1–21 CrossRef.
- M. Skoge, A. Donev, F. H. Stillinger and S. Torquato, Phys. Rev. E: Stat., Nonlinear, Soft Matter Phys., 2006, 74, 041127 CrossRef PubMed.
Footnote |
| † These authors contributed equally to the present work and are therefore considered as co-first authors. |
| This journal is © The Royal Society of Chemistry 2018 |