 Open Access Article
Creative Commons Attribution 3.0 Unported Licence
Viscoelastic flow past mono- and bidisperse random arrays of cylinders: flow resistance, topology and normal stress distribution
S.
De
a,
J. A. M.
Kuipers
a,
E. A. J. F.
Peters
 a and
J. T.
Padding
 *b
*b
aDepartment of Chemical Engineering and Chemistry, Eindhoven University of Technology, The Netherlands
bProcess & Energy department, Delft University of Technology, The Netherlands. E-mail: j.t.padding@tudelft.nl
First published on 27th November 2017
Abstract
We investigate creeping viscoelastic fluid flow through two-dimensional porous media consisting of random arrangements of monodisperse and bidisperse cylinders, using our finite volume-immersed boundary method introduced in S. De, et al., J. Non-Newtonian Fluid Mech., 2016, 232, 67–76. The viscoelastic fluid is modeled with a FENE-P model. The simulations show an increased flow resistance with increase in flow rate, even though the bulk response of the fluid to shear flow is shear thinning. We show that if the square root of the permeability is chosen as the characteristic length scale in the determination of the dimensionless Deborah number (De), then all flow resistance curves collapse to a single master curve, irrespective of the pore geometry. Our study reveals how viscoelastic stresses and flow topologies (rotation, shear and extension) are distributed through the porous media, and how they evolve with increasing De. We correlate the local viscoelastic first normal stress differences with the local flow topology and show that the largest normal stress differences are located in shear flow dominated regions and not in extensional flow dominated regions at higher viscoelasticity. The study shows that normal stress differences in shear flow regions may play a crucial role in the increase of flow resistance for viscoelastic flow through such porous media.
1. Introduction
Understanding the flow behavior of viscoelastic fluids through complex porous media is of prime importance due to its versatile applications, like enhanced oil recovery, catalytic polymerization, composite manufacturing, and in biological, geophysical, environmental and other processes.1–3 Darcy's law2,4 can be used to effectively characterize the creeping flow response of a Newtonian fluid to an imposed pressure drop or, conversely, the pressure drop associated with a certain imposed flow rate. However, when the fluid is non-Newtonian in nature, especially when it is viscoelastic, the flow behavior can no longer by predicted by Darcy's law and is often difficult to understand.5 The difficulty is caused by the complex interactions and multiscale nature of the porous medium and fluid rheology.6,7 There are ample experimental observations of an excess pressure drop, appearing beyond a critical flow rate of the viscoelastic fluid.5,8–11 This increased flow resistance has a strong correlation with the appearance of elastic instabilities in the viscoelastic fluid flow in the porous medium.12,13 This may even apply on the scale of single pores: Chmielewski et al.9 experimentally and numerically showed an increased pressure drop and departure from Darcy's law for flow of an elastic fluid through a single converging diverging geometry. Elastic instabilities and appearance of velocity and pressure fluctuations were reported in the experimental work of Arora et al.12 The concept of elastic turbulence in microfluidic flow channels, and its relation to curvature of streamlines, has been reported extensively in recent decades.14–16 More recently, the presence of elastic instabilities has also been confirmed in model porous media.17–19 Most researchers have tried to link the excess pressure drop in these porous media to enhanced extensional flows and hysteresis in conformational stress.20,21 However, our recent work on viscoelastic fluid flow through symmetric and asymmetric periodic sets of cylinders shows that most viscoelastic energy dissipation occurs in the shear-dominated regions of the flow domain, rather than extensional-flow-dominated regions.22 Experimental findings of James et al.23 also suggest that viscoelastic normal shear stresses are important in porous media flow. Thus, whether the increased flow resistance is mainly caused by extensional or shear flow mechanisms, is highly debated in the present literature.Numerical studies can help in elucidating the dominant mechanism behind the enhanced pressure drop. Most numerical studies are limited to flow of power law fluids, which are inelastic non-Newtonian fluids.24,25 The flow behavior of viscoelastic fluids through porous media is largely different from such power law fluids. Moreover, viscoelastic flow simulations have been mostly performed for regular linear arrays of cylinders or spheres.26,27 Most of these numerical simulations were unable to fully capture the increased flow resistance, as compared to experimental findings on random porous media.27–30 Liu et al.27 employed a FENE based model to simulate viscoelastic fluid flow through an array of cylinders. However no such increase in flow thickening was observed. This might be due to the selection of a simpler model pore geometry, or due to limitations in the computational framework used in previous studies. Thus, the current literature shows that the complex interaction between the viscoelastic fluid rheology and pore structure is still not well understood. Moreover, numerical simulations of flow of viscoelastic fluids through more complex porous media are clearly missing.
In this paper, we report on numerical simulations of viscoelastic fluid flows through two dimensional disordered porous media consisting of packed arrangements of monodisperse and bidisperse sets of cylinders, using a finite volume and immersed boundary (FVM-IB) methodology.1 We will compare in detail the flow structures and viscoelastic stresses in these two different sets of porous media, for different porosities and with increasing viscoelasticity (flow rate). We will show how the flow resistance changes with increasing Deborah number for all flow geometries. An analysis of flow topology enables us to understand how the shear, extension and rotational dominated flow regions are distributed in the porous media and evolve with increasing flow rate. Next a detailed analysis of the viscoelastic normal stress and its correlation to flow topology will give insight to a probable mechanism of the increased pressure drop and its relation to normal stress differences.
2. Governing equations
2.1. Constitutive equations
The fundamental equations for an isothermal incompressible viscoelastic flow are the equations of continuity and momentum, and a constitutive equation for the non-Newtonian stress components. The first two equations are as follows:| ∇·u = 0 | (1) |
 | (2) |
 | (3) |
 | (4) |
We simulate an unsteady viscoelastic flow through a static array of randomly arranged monodisperse and bidisperse cylinders, constituting a model porous medium, using computational fluid dynamics (CFD). The primitive variables used in the formulation of the CFD model are velocity, pressure and polymer stress. The complete mass and momentum conservation equations are considered in the simulations and discretized in space and time. A coupled finite volume-immersed boundary methodology (FVM-IB) with a Cartesian staggered grid is applied.1 In the FVM, the computational domain is divided into small control volumes ΔV and the primitive variables are solved in the control volumes in an integral form over a time interval Δt.
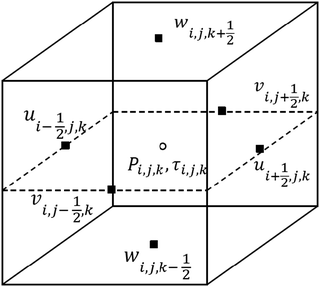
The location of all the primitive variables in a 3D cell is indicated in Fig. 1. The Cartesian velocity components u, v, w are located at the cell faces while pressure p and all components of the stress τ are located at the center of the cell. We note that, in this work, we focus on 2D systems where the 3rd dimension has been disabled.
We apply the discrete elastic viscous stress splitting scheme (DEVSS), originally proposed by Guénette and Fortin,32 to introduce the viscoelastic stress terms in the Navier–Stokes equation because it stabilizes the momentum equation, which is especially important at larger polymer stresses (small β). A uniform grid spacing is used in all directions. The temporal discretization for the momentum eqn (2) is shown as follows,
| ρun+1 = ρun + Δt{−∇pn+1 − [Cn+1f + (Cnm − Cnf)] + [(ηs + ηp)∇2un+1 + ∇·τn] + ρg − Enp} | (5) |
| C = ρ(∇·uu) | (6) |
In eqn (5) the viscoelastic stress part τ is calculated by solving eqn (3). The viscoelastic stress tensors are all located in the center of a fluid cell, and interpolated appropriately during the velocity updates. The convective part of eqn (3) is solved by using the higher order upwind scheme.
Eqn (5) is solved by a fractional step method, where the tentative velocity field u** in the first step is computed from:
| ρu** = ρun + Δt{−∇pn − [Cf** + (Cnm − Cnf)] + [(ηs + ηp)∇2u** + ∇·τn] + ρg − Enp} | (7) |
The velocity at the new time step n + 1 is related to the tentative velocity is as follows:
 | (8) |
 | (9) |
As the viscoelastic stress tensor components are coupled amongst themselves and with the momentum equation, the velocity at the new time level un+1 is used to calculate the stress value accordingly. More details and validation of the method can be found in our methodology paper.1
3. Problem description
We investigate the flow of a viscoelastic fluid through a static array of randomly arranged cylindrical particles in a 2D periodic domain as shown in Fig. 2. The domain size is set by the solids volume fraction ϕ (or porosity 1 − ϕ), the diameter of each particle dp and number of particles N. To generate the random packing for ϕ ≤ 0.45, a standard hard disk Monte-Carlo (MC) method36 is employed. The particles are placed initially in an ordered hexagonal configuration in a domain with periodic boundary conditions in all directions. Then each particle is displaced randomly such that no overlap between particles occurs. However, such a MC method does not provide sufficiently random configurations in highly dense packings.37 Thus, to generate random configurations at ϕ > 0.45, an event driven method, combined with a particle swelling procedure, is applied.38 This ensures the particles are randomly distributed. The same approach was followed by Tang et al., for Newtonian fluid simulations for a range of low to intermediate Reynolds numbers.39 A detailed analysis of different packing generation algorithms and drag correlations for Newtonian fluid flows through such random monodispersed porous media has also been performed.39,40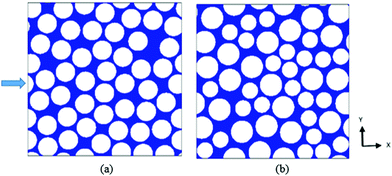 | ||
| Fig. 2 Particle configuration at solid fraction ϕ = 0.6 of a random array of monodisperse and bidisperse cylinders (blue represents the interstitial fluid space, the arrow shows the flow direction). | ||
In all simulations, the flow is driven by a constant body force exerted on the fluid in the x-direction, while maintaining periodic boundary conditions in x and y directions. Two different pore geometries are investigated by random arrangement of monodisperse (MD) and bidisperse (BD) sets of cylinders. The diameter ratio of the two cylinders in the bidisperse case is equal to 1.4.41 The solid fractions ϕ investigated for both bidisperse and monodisperse simulations are 0.3 and 0.6, corresponding to porosities of 0.7 and 0.4, respectively.
The viscoelastic fluid is modelled using the FENE-P model, using a constant extensional parameter (L2) of 1000. The viscosity ratio β is kept at 0.33. The objective is to study the interaction between the viscoelastic fluid and solid for different flow configurations and to understand the effect of polydispersity, thus we keep the values of L2 and β constant. For reference, we also simulate a Newtonian fluid with the same zero-shear viscosity as the polymer solution. In all simulations, we keep the Reynolds number low, below a value of 0.01, ensuring we are always in the creeping flow regime. We perform simulations for Deborah numbers ranging from 0 to 2, where the Deborah numbed is defined as De = λU/Rc, based on the polymer relaxation time λ, mean flow velocity U, and cylinder radius Rc. In the bidisperse system Rc is an equivalent radius based on a number average of the areas of the disks, defined as  , where N is the total number of cylinders. However here we already note that using the Deborah number Dek, based on the length scale equal to the square root of permeability
  , is probably more important to understand these complex flows. Thus, we will also use Dek to analyze different simulation outcomes for different porous configurations.
We have performed simulations for three different mesh sizes: Δ = Rc/30, Δ = Rc/40 and Δ = Rc/80. The results for Δ = Rc/40 and Δ = Rc/80 were virtually indistinguishable (less than 2% difference in the averaged velocity and stress values), even for De > 1. Therefore, all results in this paper are based on the mesh size Δ = Rc/40. We need to keep the CFL number lower than 0.01 in all our simulations, leading to considerable computational costs. At De < 1 a larger time step can be utilized but at De ≥ 1, a smaller time step is required for smooth convergence.
It is important to choose the domain size (or number of particles) sufficiently large to prevent interaction of the flow with its own periodic images. As a consequence, the residence time of the flow in the central periodic domain should be longer than the polymer relaxation time: the length of the domain, in units of Rc, should be larger than the maximum Deborah number De. We ensured this was the case in all our simulations. In our previous work, we have investigated finite domain size effects in more detail.22
To understand the interaction between rheology and porous medium, we will use the concept of flow topology parameter (Q). The flow configuration through the random packings, i.e. the amount of rotational, shear and extensional flow, will depend on the level of viscoelasticity. To characterize the flow configurations, we introduce a flow topology parameter Q which is the second invariant of the normalized velocity gradient. This parameter is defined as
 | (10) |
 and
and  are invariants of the rate of strain tensor D, and the rate of rotation tensor
  . Values of Q = −1, Q = 0, and Q = 1 correspond to pure rotational flow, pure shear flow and pure elongational flow, respectively.
We will further obtain insight in the role of viscoelastic normal stress in such flow configurations by computing the normal stress difference in the frame of reference of local flow and correlating it with the flow topology parameter.
4. Results
4.1 Apparent relative viscosity
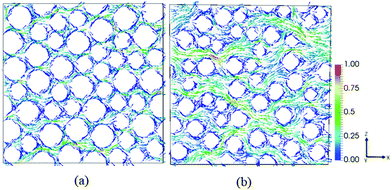
The pore configurations, generated by randomly packing mono- and bidisperse sets of cylinders, are significantly different for two different solid fractions. Fig. 3 shows viscoelastic flow profiles through a random array of bidisperse cylinders at De = 1.0 for solid fractions (a) ϕ = 0.6 and (b) ϕ = 0.3. As observed from the normalized velocity vectors, the flow pattern is complex in these porous media. For solid volume fraction 0.3, the pore structure is relatively open. Thus there exist regions with less local packing of particles. The fluid prefers to flow through paths connecting these regions of less resistance. However, for solids volume fraction 0.6, the pore structure triggers more tortuous flow paths. Such flow paths enforce the polymers to undergo repetitive contraction and expansion.To quantify the viscoelastic effects for flow through porous media, we express the results in terms of the viscosity that appears in a generalized Darcy law. The volume-averaged fluid velocity 〈u〉 in porous media is controlled by the pressure drop across the sample under consideration. According to Darcy's law, for a Newtonian fluid the average pressure gradient (−dp/dx) and the average fluid velocity across the porous medium are related by:
 | (11) |
In detail, the apparent relative viscosity ηapp of a viscoelastic fluid flowing with a volumetric flow rate q and pressure drop ΔP through a porous medium is given by:
 | (12) |
Fig. 4 shows the change of apparent relative viscosity with an increase in Deborah number (based on cylinder radius) for flow through configurations with different solids volume fractions. For both bidisperse and monodisperse packings, the apparent relative viscosity initially shows a weak shear thinning behavior followed by a flow induced thickening or increased flow resistance after a critical De number. Note that the flow configuration with higher solid volume fraction shows a stronger flow induced resistance (at the same De) and also the onset of increased drag occurs at a lower De number. As the flow configuration with solid fraction of 0.6 has a much stronger fluid solid interaction, the extent of flow resistance is also higher. Even though the bulk fluid is essentially shear thinning in nature, such an increase in flow resistance is consistent with literature findings, especially on experiments in packed beds5 and very recent simulations of Liu et al.42 Recently, Minale43,44 used a generalized Brinkman equation to simulate second order fluid flow through porous media.
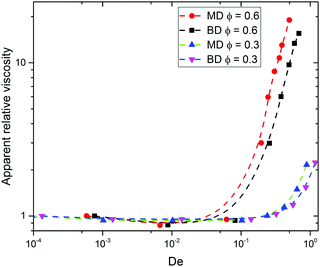 | ||
| Fig. 4 Apparent relative viscosity versus De number for different solid fraction. Here De is based on the (averaged) radius Rc of the cylinders. MD = mono-disperse, BD = bi-disperse. | ||
Up to this point we used the radius of the cylinders as the relevant length scale. However, Fig. 4 suggests that this may not be the appropriate length scale to represent such flow configurations. We next try the square root of the permeability  , obtained from Newtonian flow simulations, as the characteristic length scale. This altered Deborah number is defined as
  . Fig. 5 shows the apparent relative viscosity versus Dek for different solid volume fractions. We find that with this redefined De number, all apparent relative viscosity measurements superimpose to a universal master curve, with onset of flow thickening at Dek approximately 1. This is remarkable considering the fact that all geometries have different pore structures, and moreover one system is monodisperse while another is bidisperse. Such a master curve for both mono and bidisperse sets of cylinders, with a high polymer extensibility (high L2 value) hints that such a master curve might also be obtained for polydisperse or more heterogeneous pore structures. We have performed simulations of other random configurations at the same porosity. Very similar apparent relative viscosity values (less than 1% difference) were obtained when plotted against Dek. This shows that the results can be generalized to any porous medium consisting of randomly placed cylinders. It is important to note that a sufficient amount a randomness in cylinder placement, leading to appearance of preferred flow paths (as in Fig. 3), is essential for the observed strong increase in apparent relative viscosity. In regular arrays, such as a square array, the increase in apparent relative viscosity is weaker, as found in our simulations (not shown) and in the work of Liu et al.42 However, even for such regular arrays, we noticed that the onset of this flow thickening starts also at Dek approximately 1 (not shown).
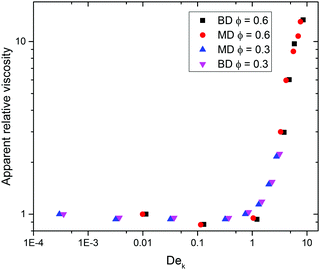 | ||
Fig. 5 Apparent relative viscosity versus Dek, using  as the characteristic length scale, for different solid fractions. MD = mono-disperse, BD = bi-disperse. as the characteristic length scale, for different solid fractions. MD = mono-disperse, BD = bi-disperse. | ||
4.2 Velocity and stress profiles
Next we investigate the profiles (spatial distribution) of velocity and viscoelastic stresses that develop during the flow through the porous media. Although we have investigated two different porosities and both monodisperse and bidisperse sets of cylinders, here we illustrate the profiles for the case of bidisperse cylinders at a solid fraction of ϕ = 0.3. Later we will analyze in detail the interplay between the flow topology and fluid rheology for all cases.Fig. 6 shows snapshots of velocity contours colored by the normalized x-velocity, for different De numbers. With increasing De number, we observe that the flow structure follows more narrowed flow paths with higher velocities, accompanied by more regions with almost stagnant fluid, as shown in Fig. 6(c). Such preferential flow paths emerge due to differences in local flow resistance through various parts of the porous medium, leading to asymmetric flow profiles. We note that in regular periodic arrays of cylinders such asymmetric flow profiles do not occur at the De numbers studied here,1 although at higher De numbers the symmetry can be broken even in regular arrays.17
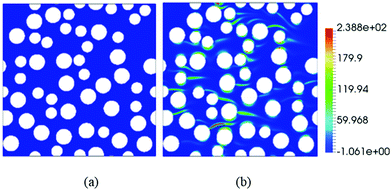
The non-dimensional viscoelastic normal stress component along the average flow direction,τxx/(ηU/Rc), is shown in Fig. 7 for different De numbers. Such viscoelastic stresses are absent in a Newtonian fluid. Also in our viscoelastic fluids, at a very low De number of 0.01 the dimensionless viscoelastic stresses are very small. With increasing De number the dimensionless viscoelastic stress increases rapidly, where it should be noted that the non-dimensionalization already takes care of the linear increase in flow velocity with increasing De. At a De number of 1.0, we clearly observe the presence of high normalized stresses along the entire flow domain.
4.3 Flow topology
We next investigate the flow topology. The main purpose is to show how the shear, extensional and rotational parts of the flow are distributed throughout the interstitial pore structure. A flow topology parameter of Q = −1, Q = 0, and Q = +1 corresponds to pure rotational, shear and elongational flow, respectively.Fig. 8 shows the flow topology parameter distribution for a bidisperse random porous medium with solid fraction 0.3. We observe that the flow becomes more shear dominated at higher De. Surprisingly, the presence of extensional flow regions seems to decrease with increasing De.
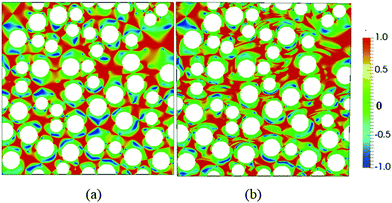 | ||
| Fig. 8 Flow topology parameter Q distribution at (a) De 0.001 and (b) De 1.0, at solid fraction of 0.3. Blue corresponds to rotational flow, green to shear flow, and red to extensional flow. | ||
To show the effect of viscoelasticity on flow topology in a more quantitative way, Fig. 9 shows histograms of flow topology parameter for different De numbers, for each porosity. The common trend, observed for all De numbers, is that the flow structures are more shear dominated than extensional flow dominated. The figure also clearly shows that the prevalence of extensional flow zones definitely does not increase with increasing De number, but rather even decreases (especially clear for the higher solid fraction in Fig. 9(c) and (d)).
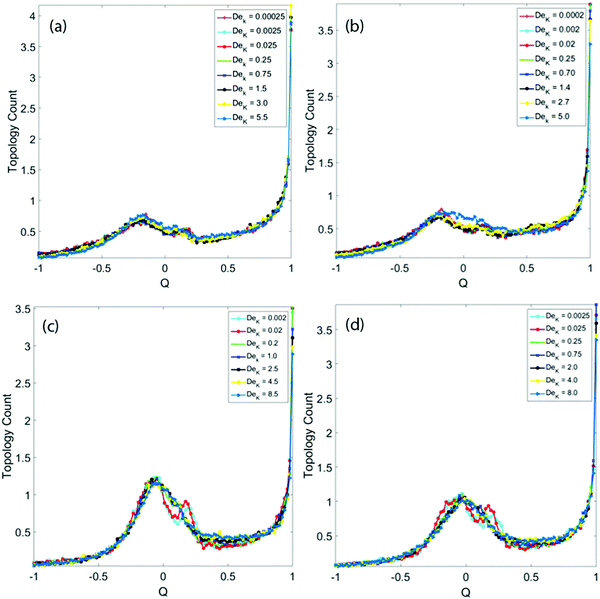 | ||
| Fig. 9 Flow topology parameter histograms for solid fractions (a) BD ϕ = 0.3, (b) MD ϕ = 0.3, (c) BD ϕ = 0.6, and (d) MD ϕ = 0.6, for different De numbers. | ||
4.4 Viscoelastic normal stress
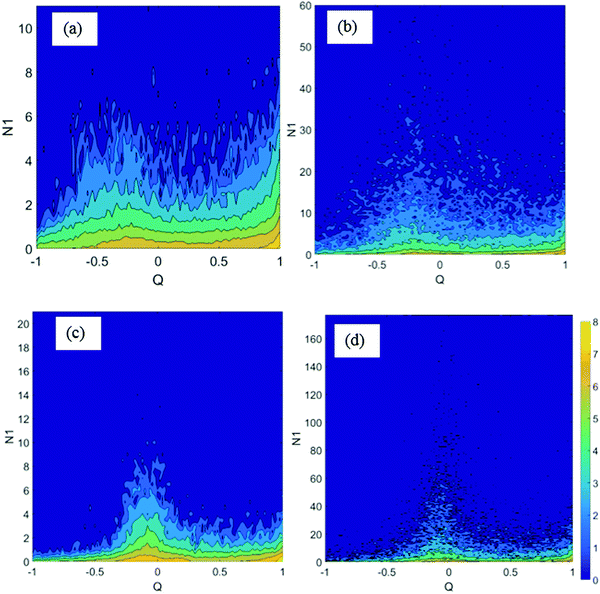
The higher prevalence of shear flow zones than extensional flow zones may suggest that shear stresses may be more important in these porous media than extensional stresses. In particular, we suspect that strong normal stress differences in shear dominated regions are responsible for the observed increase in flow resistance at larger De. To investigate this more deeply, we next compute the local first normal stress difference (N1) (normalized by (ηU/Rc)) and correlate it with the local flow topology parameter for all locations inside the flow domain. Here the local first normal stress difference is measured in a local frame of reference, defined by the local flow direction,![[u with combining right harpoon above (vector)]](https://www.rsc.org/images/entities/i_char_0075_20d1.gif) /u, and its tangent in the local shear gradient direction.
/u, and its tangent in the local shear gradient direction.
Fig. 10 shows two-dimensional histograms of the mutual occurrence of local first normal stress differences N1/(ηU/Rc) and local flow topology parameters Q for a fixed De number. The scale indicated by the color bar is the logarithm of the count. We only show the histograms for the bidisperse flow configurations, but note that the histograms for the monodisperse systems are similar. In case of ϕ = 0.3, at low De number the first normal stresses are distributed quite evenly across both shear (Q = 0) and extensional (Q = 1) dominated flow regimes (Fig. 10(a)). The concentration is actually larger around Q = 1. However, at an increased De of 1.0, we clearly see a concentration of high normal stress difference values around the shear dominated regime around Q = 0. In case of a higher solid fraction of 0.6, at lower De number we can see that the concentration of high normal stress differences is already larger in the shear dominated regime. At higher De number, the maximum normal stress differences are again clearly concentrated around Q = 0. A similar analysis has been performed using the difference between the maximum and minimum eigenvalue of the stress tensor (in the 2D plane). Qualitatively these results are in agreement with Fig. 10 (not shown). These observations strongly suggest that the apparent flow thickening is not primarily due to extensional effects, but rather caused by viscoelastic shear stresses.
5. Conclusion
We have performed direct numerical simulations using a coupled finite volume immersed boundary methodology to model viscoelastic fluid flow in a 2-dimensional porous medium. The model porous medium is constructed by randomly placing monodisperse and bidisperse sets of cylinders in a periodic domain. Although a shear thinning FENE-P model is employed to model the viscoelastic fluid, we observe an increased flow thickening after a critical De number, irrespective of the pore configuration. The increased flow resistance superimposes to a universal master curve when the characteristic length scale in the definition of Deborah number is selected as the permeability and not the cylinder radius. We have shown a similar master curve in our previous work,45 for viscoelastic flow through an array of randomly arranged equal-sized spheres representing a three dimensional disordered porous medium. Because the current simulations deal with both mono and bidisperse sets of cylinders, this strengthens our belief that such master curves can also exist for more polydisperse and complex real rock structures, if the length scale is chosen correctly. A detailed analysis of flow topology in the disordered porous media reveals that the flow is more shear dominated than extensional or rotational, especially at higher De number. The analysis of viscoelastic normal stress difference further shows that the largest normal stresses are present in the shear dominated flow regions, rather than in extensional regions. This strongly suggests that viscoelastic normal shear stresses are related to the observed increased flow resistance and not primarily extensional effects. We hope this work has shed new light on the highly debated mechanism governing the increased flow resistance. In our future work, we will study the flow of viscoelastic fluids through realistic rock structures with more complex pore configurations.
Conflicts of interest
There are no conflicts to declare.Acknowledgements
This work is part of the Industrial Partnership Programme (IPP) ‘Computational sciences for energy research’ (CSER) of the Foundation for Fundamental Research on Matter (FOM), which is part of the Netherlands Organisation for Scientific Research (NWO). This research programme is co-financed by Shell Global Solutions International B.V.References
- S. De, S. Das, J. A. M. Kuipers, E. A. J. F. Peters and J. T. Padding, J. Non-Newtonian Fluid Mech., 2016, 232, 67–76 CrossRef CAS.
- F. A. L. Dullien, Porous Media-Fluid Transport and Pore Structure, Academic, New York, 1979 Search PubMed.
- L. W. Lake, R. T. Johns, W. R. Rossen and G. A. Pope, Fundamentals of enhanced oil recovery, Society of Petroleum Engineers, 1986 Search PubMed.
- F. A. L. Dullien, Chem. Eng. J., 1975, 10, 1–34 CrossRef CAS.
- R. P. Chhabra, J. Comiti and I. Machao, Chem. Eng. Sci., 2001, 56, 1–27 CrossRef CAS.
- J. G. Savins, Ind. Eng. Chem., 1969, 61, 18–47 CrossRef CAS.
- F. Zami-Pierre, R. De Loubens, M. Quintard and Y. Davit, Phys. Rev. Lett., 2016, 117, 1–5 CrossRef PubMed.
- D. F. James, N. Phan-Thien, M. M. K. Khan, A. N. Beris and S. Pilitsis, J. Non-Newtonian Fluid Mech., 2006, 35, 405–412 CrossRef.
- C. Chmielewski, C. A. Petty and K. Jayaraman, J. Non-Newtonian Fluid Mech., 1990, 35, 309–325 CrossRef CAS.
- R. K. Gupta and T. Sridhar, Rheol. Acta, 1985, 24, 148–151 CrossRef CAS.
- C. Chmielewski and K. Jayaraman, J. Non-Newtonian Fluid Mech., 1993, 48, 285–301 CrossRef CAS.
- K. Arora, R. Sureshkumar and B. Khomami, J. Non-Newtonian Fluid Mech., 2002, 108, 209–226 CrossRef CAS.
- E. S. Shaqfeh, Annu. Rev. Fluid Mech., 1996, 28, 129–185 CrossRef.
- P. Pakdel and G. McKinley, Phys. Rev. Lett., 1996, 77, 2459–2462 CrossRef CAS PubMed.
- A. Groisman and V. Steinberg, Nature, 2000, 405, 53–55 CrossRef CAS PubMed.
- A. Groisman and V. Steinberg, New J. Phys., 2004, 6, 29 CrossRef.
- S. De, J. van der Schaaf, N. G. Deen, J. A. M. Kuipers, E. A. J. F. Peters and J. T. Padding, Phys. Fluids, 2017, 29, 113102 CrossRef.
- L. Pan, A. Morozov, C. Wagner and P. E. Arratia, Phys. Rev. Lett., 2013, 110, 1–5 CrossRef PubMed.
- A. Clarke, A. M. Howe, J. Mitchell, J. Staniland, L. Hawkes and K. Leeper, Soft Matter, 2015, 11, 3536–3541 RSC.
- J. P. Rothstein and G. H. McKinley, J. Non-Newtonian Fluid Mech., 2001, 98, 33 CrossRef CAS.
- S. Louis, J. Fluid Mech., 2009, 631, 231 CrossRef.
- S. De, J. A. M. Kuipers, E. A. J. F. Peters and J. T. Padding, Phys. Rev. Fluids, 2017, 2, 53303 CrossRef.
- D. F. James, R. Yip and I. G. Currie, J. Rheol., 2012, 56, 1249 CrossRef CAS.
- J. P. Singh, S. Padhy, E. S. G. Shaqfeh and D. L. Koch, J. Fluid Mech., 2012, i, 1–37 Search PubMed.
- S. Shahsavari and G. H. McKinley, Phys. Rev. E: Stat., Nonlinear, Soft Matter Phys., 2015, 92, 1–27 Search PubMed.
- M. D. Smith, Y. L. Joo, R. C. Armstrong and R. A. Brown, J. Non-Newtonian Fluid Mech., 2002, 109, 13–50 CrossRef.
- A. W. Liu, D. E. Bornside, R. C. Armstrong and R. A. Brown, J. Non-Newtonian Fluid Mech., 1998, 77, 153–190 CrossRef CAS.
- A. Souvaliotis and A. N. Beris, Comput. Methods Appl. Mech. Eng., 1996, 129, 9–28 CrossRef.
- K. K. Talwar and B. Khomami, J. Non-Newtonian Fluid Mech., 1995, 57, 177–202 CrossRef CAS.
- C. C. Hua and J. D. Schieber, J. Rheol., 1998, 42, 477 CrossRef CAS.
- R. B. Bird, R. C. Armstrong and O. Hassager, Dynamics of polymeric liquids, Fluid mechanics, 2nd edn, 1987, vol. 1 Search PubMed.
- R. Guénette and M. Fortin, J. Non-Newtonian Fluid Mech., 1995, 60, 27–52 CrossRef.
- N. G. Deen, S. H. L. Kriebitzsch, M. A. van der Hoef and J. A. M. Kuipers, Chem. Eng. Sci., 2012, 81, 329–344 CrossRef CAS.
- H. A. van der Vorst, Iterative methods for large linear systems, Cambridge Monographs on Applied and Computational Mathematics, Cambridge University Press, Cambridge, 2003 Search PubMed.
- D. S. Kershaw, J. Comput. Phys., 1978, 26, 43–65 CrossRef.
- D. Frenkel and B. Smit, Understanding Molecular Simulation From Algorithms to Applications, 2nd edn, 2001 Search PubMed.
- E. G. Noya, C. Vega and E. De, Miguel, J. Chem. Phys., 2008, 128, 1–7 CrossRef PubMed.
- N. Kumar, O. I. Imole, V. Magnanimo and S. Luding, Adv. Mater. Res., 2012, 508, 160–165 CrossRef.
- Y. Tang, S. H. L. Kriebitzsch, E. A. J. F. Peters, M. A. van der Hoef and J. A. M. Kuipers, Int. J. Multiphase Flow, 2014, 62, 73–86 CrossRef CAS.
- Y. Tang, Direct numerical simulations of hydrodynamics in dense gas-solid flows of Hydrodynamics in Dense Gas-Solid Flows, PhD thesis, TU Eindhoven, 2015 Search PubMed.
- C. S. O. Hern and M. D. Shattuck, Nat. Publ. Gr., 2013, 12, 287–288 Search PubMed.
- H. L. Liu, J. Wang and W. R. Hwang, J. Non-Newtonian Fluid Mech., 2017, 246, 21–30 CrossRef CAS.
- M. Minale, Phys. Fluids, 2016, 28, 023102 CrossRef.
- M. Minale, Phys. Fluids, 2016, 28, 023103 CrossRef.
- S. De, J. A. M. Kuipers, E. A. J. F. Peters and J. T. Padding, J. Non-Newtonian Fluid Mech., 2017, 248, 50–61 CrossRef CAS.
| This journal is © The Royal Society of Chemistry 2017 |

