 Open Access Article
A pure magnetite hydrogel: synthesis, properties and possible applications†
Elizaveta I.
Anastasova
 a,
Vladimir
Ivanovski
b,
Anna F.
Fakhardo
a,
Artem I.
Lepeshkin
c,
Suheir
Omar
d,
Andrey S.
Drozdov
*a and
Vladimir V.
Vinogradov
*a
a,
Vladimir
Ivanovski
b,
Anna F.
Fakhardo
a,
Artem I.
Lepeshkin
c,
Suheir
Omar
d,
Andrey S.
Drozdov
*a and
Vladimir V.
Vinogradov
*a
aLaboratory of Solution Chemistry of Advanced Materials and Technologies, ITMO University, Saint-Petersburg, 197101, Russian Federation. E-mail: drozdov@scamt.ru; vinogradov@scamt.ru
bFaculty of Natural Sciences and Mathematics, Institute of Chemistry, Ss. Cyril and Methodius University in Skopje, Skopje, 1000, Republic of Macedonia
cChair of Applied Biotechnology, ITMO University, Saint-Petersburg, 197101, Russian Federation
dInstitute of Chemistry, Casali Center for Applied Chemistry and Center for Nanoscience and Nanotechnology, The Hebrew University of Jerusalem, Jerusalem, 91904, Israel
First published on 30th October 2017
Abstract
A magnetite-only hydrogel was prepared for the first time by weak base mediated gelation of stable magnetite hydrosols at room temperature. The hydrogel consists of 10 nm magnetite nanoparticles linked by interparticle Fe–O–Fe bonds and has the appearance of a dark-brown viscous thixotropic material. The water content in the hydrogel could be up to 93.6% by mass while volume fraction reaches 99%. The material shows excellent biocompatibility and minor cytotoxic effects at concentrations up to 207 μg mL−1. The gel shows excellent sorption capacity for heavy metal adsorption such as chrome and lead ions, which is 225% more than the adsorption capacity of magnetite nanoparticles. Due to thixotropic nature, the gel demonstrates mechanical stimuli-responsive release behavior with up to 98% release triggered by ultrasound irradiation. The material shows superparamagnetic behavior with a coercivity of 65 emu g−1 at 6000 Oe. The magnetite gels prepared could be used for the production of magnetite aerogels, magnetic drug delivery systems with controlled release and highly efficient sorbents for hydrometallurgy.
1 Introduction
Magnetic gels and aerogels are fast developing areas in the materials science. Due to large specific surface areas, well-developed microstructures and excellent sorption properties, such materials find applications in different areas of industries including biomedicine e.g. concentration, storage and controlled release of different agents. They can also be used in microfluidic devices1 as oil sorbents,2 for the fabrication of microsensors and soft actuators,3 wastewater treatment4 cancer therapy,5,6 targeted drug delivery application7–10etc.11–13 The vast majority of the known magnetic gels and aerogels represent multicomponent systems consisting of magnetic nanoparticles (such as magnetite) and polymers, responsible for the formation of a gel structure.1,14,15 Magnetic gels can be prepared by different approaches, such as blending methodology, when separately prepared magnetic nanoparticles (MNPs) are encapsulated into a gel in the process of polymerization.16 Magnetic nanoparticles can be in situ synthesized in a gel matrix, and the hydrogel serves here as a reactor for the co-precipitation process.17 Since in the both methods mentioned no covalent bonds between MNPs and the hydrogel networks exist, the stability of the resultant materials cannot be guaranteed. To overcome this problem, the surface of the MNPs is modified by several functional groups serving as nano-crosslinkers, thus forming covalent coupling with the monomers being polymerized. In this way a magnetic gel with MNPs incorporated into the gel structure is formed, insuring stability of the material.18 However, this process leads to complex synthetic procedures and results in low magnetization of the final material. An alternative strategy in the production of iron oxide gels is direct gelation of iron salts in water or alcohol solutions by weak bases such as propylene oxide, tetrahydrofuran or pyridine.19 Detailed information on the gelation process investigated previously20 can be summarized as follows: weak bases act as proton scavengers to react with protons of water molecules present in the coordination sphere of a hydrated metal complex. This is followed by a nucleophilic attack on the epoxide ring, leading to ring opening, and as a result net elimination of protons from a solution occurs (eqn (1) and (2)).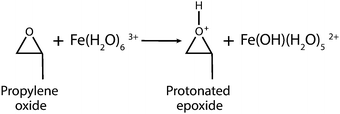 | (1) |
 | (2) |
Further hydrolysis and condensation of the originally hydrated metal complex result in the formation of an iron oxide phase with Fe2O3 stoichiometry and a branched structure.21 This technique allows the fabrication of stable iron oxide gels, which are suitable for supercritical drying. The drawback is, however, that the materials produced using this technique consist of non-magnetic iron oxides, mainly of goethite.20 The transformation of the goethite gel into magnetic species of magnetite or maghemite requires high-temperature treatment.22 This procedure eventually leads to partial structure destruction, hence, it is unsuitable for the preparation of bio- or organically-doped composites. An alternative strategy can be a two-step procedure of nanoparticle gelation that relies on the formation of the gel structure by the stimulation of magnetite interparticle Fe–O–Fe bond formation. To do this, a stable hydrocolloid of magnetite is required. Furthermore, the nanoparticles should be thickly coated with Fe–OH residues, which provides the formation of interparticle bonds and supports the gel structure. However, despite the attractiveness of this possibility, this path is complicated due to the poor colloid stability of the unmodified magnetite nanoparticles, and has not been described in the literature yet. In this article we describe, for the first time, the pure magnetite gel (ferria gel) prepared by the direct gelation of a magnetite hydrosol. The gelation of the magnetite hydrosol occurs under the influence of a propylene oxide proton scavenger and results in the formation of a dense and highly magnetic gel. The gel composition, the nature of the gelation process and the gel structure organization have been investigated employing Raman and IR spectroscopy. The physico-chemical parameters of the materials obtained, as well as their sorption properties against heavy metal ions and organic dyes, are also described.
2 Experimental details
2.1 Materials
2.2 Methods
3 Results and discussion
3.1 Synthesis of the ferria gel
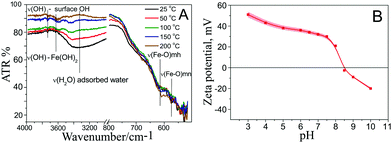
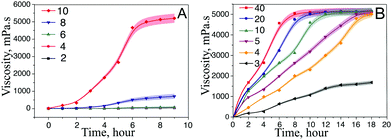
For the synthesis of ferria gels we used a stable magnetite hydrosol, the preparation of which was described in our previous work.23 Shortly, the stable magnetite hydrosol was synthesized using US-assisted and co-precipitation methods. The synthetic procedure employs a non-stoichiometric Fe2+/Fe3+ ratio with the US-mediated Shikorr reaction and results in MNPs which are characterized with excellent colloidal stability of water media provided by a highly-positive zeta potential (+36 mV at pH 7). The investigation of the MNPs using ATR-IR spectroscopy23 shows the presence of Fe–OH groups originating from both magnetite and Fe(OH)2 on the NP surface (Fig. 1A). The presence of OH groups on the surface is enough to shift the isoelectric point of the material to a basic pH (Fig. 1B). On the other hand, the presence of OH groups on the MNP surface makes interparticle bonding and, thus, gel formation possible.Magnetite gels were produced by the addition of propylene oxide to a magnetite hydrosol. The process of gelation was an exothermic reaction resulting in a dark-brown gelly magnetic material. The kinetics of the gelation process mainly depends on the reagent ratio and can last from 6 to almost 18 hours. For the initial experiments, equal volumes of propylene oxide and magnetite hydrosols having different magnetite mass fractions were mixed. Further, a gel point was determined as a point where the solution ceased to discernibly flow under the influence of gravity. The measurements were also carried out using a rotary viscometer. While the gelation of the hydrosol is mediated only by interparticle interaction, the volume fraction of MNPs plays a key role in the formation of a gel network (Fig. 2A). The gelation process was observed for the hydrosol with 10% mass fraction, which corresponds to 1 vol% of magnetite in the gel. Within the period of 6 hours, the viscosity of the samples increased up to 4670 mPa s, and a gel monolith was formed. It should be noted that because of the thixotropic nature, the gel structure is irreversibly destroyed during the measurement, and further gelation did not occur. Systems with a lower volume fraction of magnetite show minor viscosity growth and remain in a liquid form even after 24 hours from the beginning of the process.
Another important parameter influencing the gelation kinetics is the [Pr.ox.]/[Fe3O4] ratio (Fig. 2B). Different molar ratios were tested starting from the maximal one, which corresponds to a homogeneous system (a molar ratio of 40![[thin space (1/6-em)]](https://www.rsc.org/images/entities/char_2009.gif) :
:![[thin space (1/6-em)]](https://www.rsc.org/images/entities/char_2009.gif) 1 and a volume ratio of 1
1 and a volume ratio of 1![[thin space (1/6-em)]](https://www.rsc.org/images/entities/char_2009.gif) :
:![[thin space (1/6-em)]](https://www.rsc.org/images/entities/char_2009.gif) 1). This point corresponds to the partial miscibility, with the second liquid phase forming above this ratio. The increase of the propylene oxide molar ratio leads to the acceleration of the rate of gelation, but has a minor effect on the final gel viscosity. For the maximal Pr.Ox
1). This point corresponds to the partial miscibility, with the second liquid phase forming above this ratio. The increase of the propylene oxide molar ratio leads to the acceleration of the rate of gelation, but has a minor effect on the final gel viscosity. For the maximal Pr.Ox![[thin space (1/6-em)]](https://www.rsc.org/images/entities/char_2009.gif) :
:![[thin space (1/6-em)]](https://www.rsc.org/images/entities/char_2009.gif) Fe3O4 ratio, the full gelation occurs within 6 hours, the decrease of the propylene oxide fraction makes the gelation process slower until it reaches the lower limit with a volume ratio of 4
Fe3O4 ratio, the full gelation occurs within 6 hours, the decrease of the propylene oxide fraction makes the gelation process slower until it reaches the lower limit with a volume ratio of 4![[thin space (1/6-em)]](https://www.rsc.org/images/entities/char_2009.gif) :
:![[thin space (1/6-em)]](https://www.rsc.org/images/entities/char_2009.gif) 1. A further decrease in the Pr.Ox. content leads to a partial viscosity gain, but also hinders the gel formation. This can be attributed to the fact that theoretically a single propylene oxide molecule forms a single interparticle bond and prevents two separate nanoparticles to form an interparticle bond. As a result, no gel structure is formed.
1. A further decrease in the Pr.Ox. content leads to a partial viscosity gain, but also hinders the gel formation. This can be attributed to the fact that theoretically a single propylene oxide molecule forms a single interparticle bond and prevents two separate nanoparticles to form an interparticle bond. As a result, no gel structure is formed.
We have synthesized ferria gel with equal volumes of propylene oxide and magnetite sol. It appears as a stable dark brown gel with magnetite content (solid phase) being 6.4 wt% and 1 vol% of the solid phase, while 99 vol% was occupied by the solvent. Due to the high viscosity a drop of the ferria gel does not flow under the influence of gravity and remains still on the glass slide when put in a vertical position (Fig. 3A). The high mass fraction of the magnetite phase ensures good magnetic properties of the material, and it is readily attracted by an external magnetic magnetic field, as presented in Fig. 3B.
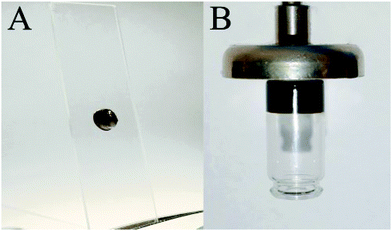 | ||
| Fig. 3 Visual appearance of the synthesized gel. (A) A drop of ferria gel does not flow down from the glass. (B) The vial with ferria gel is attracted by a magnetic field and lifted into the air. | ||
3.2 Rheological properties of the ferria gel
The rheological properties of the ferria gel were obtained from the characteristic curves of the dependence on the viscosity of shear rate in the forward direction (upon structural breakdown) and in the reverse direction (after 15 minutes at rest). Also the storage modulus (G′) and the loss modulus (G′′) at different frequencies were measured. The complex study of the rheological properties of the sample makes it possible to characterize its resistance to mechanical action and the ability to reconstruct the structure after predetermined time. The sample demonstrated a nonlinear viscosity dependence of the shear rate. Apparently, the gel shows much higher viscosity at initial shear rates than at high shear rates (up to 8 s−1) (Fig. 4A). A study of the viscosity of the ferria gel in the reverse direction (at a shear rate of 8 to 1 s−1) showed that the sample has weakly expressed thixotropic properties which can be seen from the lower resistance of the destroyed gel. The sample demonstrated only a partial restoration (45%) of the structure after the sample was kept at rest. Fig. 4B shows the dependence of the moduli G′ (storage modulus), G′′ (loss modulus) from 0.6 to 7 rad s−1. The choice of such modes is due to the low viscosity of the initial gel, as well as the instability of the system, which results in a higher level of module G′ compared to module G′′. The storage modulus of the sample shows a lower frequency dependence than the loss modulus. The module remains almost unchanged with increasing frequency, which indicates high elasticity at minimum loads, while the dependence is almost linear. The module G′′ varies nonlinearly as a function of frequency, which is caused by the loss of stability of the gel structure. Due to fragility of the magnetite gel structure the material demonstrates only limited injectability.24 When pushed through a syringe needle only partial gel structure recovery (up to 30% after 30 min) was observed (Fig. 1S, ESI†).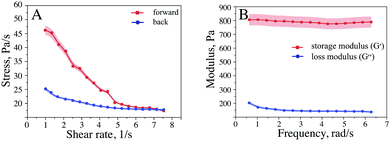 | ||
| Fig. 4 Rheological properties of the ferria gel (A) viscosity – shear rate dependence; (B) storage and loss modules of ferria gel. | ||
The structure and properties of the materials synthesized were subjected to a detailed investigation aimed to describe the nature of the gel structure and its organization. To determine specific analytical signals, a dried magnetite xerogel was compared with a dried magnetite hydrosol.
3.3 Characterization of the ferria xerogel
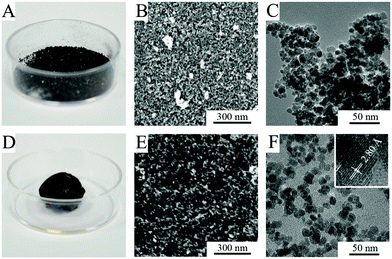
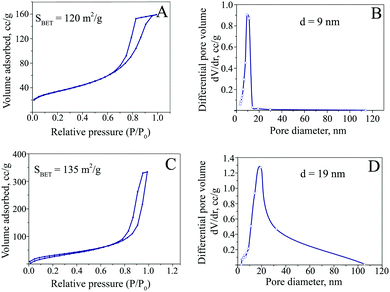
The ferria gel was dried under a vacuum to form a highly porous xerogel. In contrast to dried nanoparticles which form thin mesoporous films, dried xerogels are low-density magnetic bulks (Fig. 5A and D). SEM (Fig. 5B and E) and TEM (Fig. 5C and F) images show the difference in the microstructure of the dried hydrosol and gel. The latter one has a more porous structure and a developed nanoarchitecture originating from the gel structure, as single-nanoparticle chains can be clearly seen.The analysis of textural properties by low-temperature nitrogen physisorption (Fig. 6) proves the differences in the microarchitecture observed (Fig. 5) with the distinctive results for the dried hydrosol and gel. The analysis of sorption curves using the BET method indicates specific surfaces of 135 m2 g−1 for the ferria gel sample and 120 m2 g−1 for the magnetite hydrosol. The comparison of other textural characteristics, however, shows even more significant difference between the two materials. The desorption branch analysis of the isotherm shows almost a 2-fold increase of the average pore diameter and the specific pore volume for the dried xerogel compared to the hydrosol: 19 nm and 0.53 cm3 g−1 compared to 9.1 nm and 0.23 cm3 g−1, respectively. Since the specific pore volume is the function of packing and the particle size, it can be concluded that the structure formed is close to the dense sphere packing in the case of the dried magnetite hydrosol. On the other hand in the case of the dried xerogel the porosity exceeds 0.66 due to the partial preservation of the gel structure upon drying.
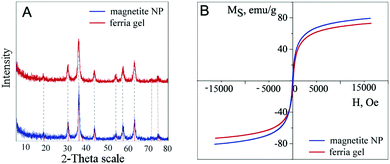
The X-ray diffractogram analysis of the dried ferria gel is similar to the one of the magnetite crystal lattice (compared to JCPDS file No. 19-0629) and is identical to the X-ray diffractogram of the magnetite hydrosol sample (Fig. 7A). This can be attributed to the fact that the crystal lattice of the nanoparticles composing the gel is not affected during the gelation process, so the gel consists of highly crystalline nanoparticles. The Scherrer equation solution gives a 10 nm crystallite diameter for both the ferria gel and the hydrosol, which proves the idea that the nanoparticles themselves are unaffected by a gelation agent. The magnetization curves of the dried gel samples show the superparamagnetic behavior and high coercivity of the materials valued at 65 emu g−1 what is close to the bulk magnetite25 (Fig. 7B).
3.4 Magnetite gel organization
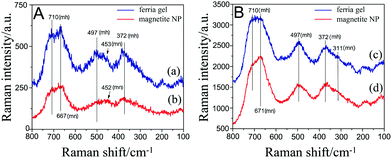
To address the question of magnetite gel organization, Raman, IR absorbance and ATR spectra of the samples were recorded and analyzed. For the structure determination, the spectra of magnetite nanoparticles were compared with the spectra of the dried ferria gel. Magnetite, at room temperature, crystallizes in the cubic space group Fd3m (O7h), and possesses 14 atoms per asymmetric unit. According to the group-theoretical analysis it gives rise to 4 IR vibrations of T1u symmetry (i.e. triply degenerated vibrations) and 5 modes with symmetries A1g + Eg + 3T2g responsible for the appearance of Raman bands.26 The literature data indicate that a broad Raman band characteristic of magnetite, appearing at 670 cm−1,27–29 is assigned to A1g type vibration.26 The Raman spectra of the samples using two different laser powers and exposition times are presented in Fig. 8. Magnetite can easily change to maghemite and further to hematite upon increasing the laser irradiation power.23,27 Our previous investigation28 showed that the spectra of nano-magnetite can be safely recorded using the laser powers of 0.030 mW, while at powers of 0.344 mW it is partially converted to maghemite. In the latter case, bands characteristic of maghemite with maxima around 704, 499 and 360 cm−1 appear.23,27,28As can be concluded from the Raman spectra, the surface of magnetite NPs is partially oxidized to maghemite. It can also be seen from Fig. 8B that upon increasing the power of the laser, structural changes towards maghemite formation occur; the band at 710 cm−1 characteristic of maghemite gets even in intensity with the 667 cm−1 band characteristic of magnetite27 for the magnetite gel sample. Moreover, the band at 497 cm−1 starts to become more pronounced. On the other hand the band that appears at 453 cm−1, which can be assigned to the T2g mode in the spectra of pure magnetite (Fig. 8A), is no longer visible after higher power irradiation (Fig. 8B). Although earlier studies show that MNPs obtained through gelation of FeCl3 assisted by propylene oxide goes through the formation of goethite, no trace of this iron oxyhydroxide could be detected in our case. The Raman spectrum of goethite is characterized by a strong Raman band at 385 cm−1,29 which cannot be undoubtedly recognized on the background of the broad maghemite/magnetite band at 372 cm−1 (Fig. 8).
IR absorbance and ATR considerations shed more light on the structure of the investigated samples. The IR absorbance spectra of the magnetite specimens are presented in Fig. 9. The bands due to water adsorption, (but probably also OH groups on the sample surface) are visible in both specimens (Fig. 9A) through the presence of a broad band in the region from 3600 to 3100 cm−1 and a band with a maximum at 1630 cm−1. They are assigned to the stretching and bending modes of the HOH, respectively. What can also be observed is an inclined baseline, which appears because of the strong scattering of the samples. The bands due to the Fe–O vibrations are presented in Fig. 9B. The band at 574 cm−1 originates from the T1u phonon because of the presence of magnetite.30 The band at 632 cm−1 is due to the presence of maghemite,27,30 while the band at 712 cm−1 is assigned to Fe(III)–O vibrations, with the octahedral sites Fe(II) being oxidized to Fe(III) and forming non-stoichiometric Fe(III) oxyhydroxide.30 The band at 445 cm−1 appears in the reported IR spectrum of magnetite (cf. Fig. 9 in ref. 27), although not assigned. This band is also present in the IR absorbance spectrum of MNP sol dried particles. However, apart from this band, which lowers its intensity, there is another band in the dried ferria gel sample, almost overlapped with the first one, and with a maximum at 462 cm−1. This band, according to ref. 27, is characteristic of hematite. If present, goethite can be recognized through its characteristic sharp and intense bands at 894 and 799 cm−1.31 However, even after closer inspection of the spectra presented in Fig. 9A, no such bands could be spotted.
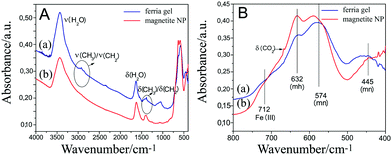 | ||
| Fig. 9 IR absorption spectra of ferria gel and magnetite NPs. Panel (A) shows spectra in the whole mid-IR region, while panel (B) the bands due to vibrations of the Fe–O network. | ||
3.5 Nature of particle-to-particle interaction
As was noted earlier, the surface of stable magnetite NPs is covered with OH groups that play a key role in the NP colloidal stability and allow interparticle Fe–O–Fe bond formation, with water molecules appearing as a leaving group. In order to conduct this process, propylene oxide can be used as a proton acceptor. Propylene oxide is widely used for the gelation of inorganic salts, and its mechanism of action is well-known: after oxirane-ring oxygen being attacked by a proton from an inorganic aquacomplex, nucleophilic SN2-attack occurs on one of the carbons in the cycle, resulting in epoxide ring opening. Inorganic aquacomplexes can undergo further hydrolysis and condensation to form condensed oxide species and a gel network. If the same reaction is taking place on the magnetite NP sol, where an Fe–OH layer is present on the NP surface, the process goes through the same mechanism: propylene oxide triggers the process in which the iron(II) ion forms Fe–O–Fe bonds, ending up the formation of the porous solid ferria gel (Fig. 10). It is then of interest to search for the formation of some kind of iron oxide “glue” in the ferria gel and to compare it with the composition of the magnetite NPs to underline the difference between them.One of the differences between the xerogel and the dried magnetite hydrosol sample was already detected in the absorbance IR spectra of the two samples, namely the shift of the band from 455 to 462 cm−1 as an indication of the formed hematite, which should be further proved. In order to do so, it is possible to subtract one spectrum from another and observe the difference spectrum. The difference spectrum can show the components present in excess in both spectra. However, the normalization of the spectra is needed in order to subtract spectra that were recorded from the samples containing different amounts of components. One method to do that is to find a band in the spectrum whose integral intensity can be correlated with the concentration of the investigated sample. Since magnetite is the basic constituent of the investigated samples, we concentrated our efforts on isolating bands inherent to magnetite. For that purpose, we performed the baseline correction, deconvolution and curve fitting analysis of the absorbance spectra for the two samples in question (ferria gel and magnetite NPs) in the region where Fe–O vibrations give the IR bands (Fig. 11).
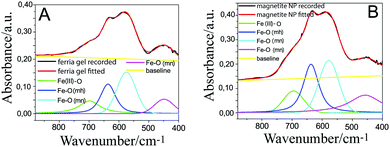 | ||
| Fig. 11 Recorded and base line corrected, fitted and deconvoluted spectra of: (A) ferria gel and (B) magnetite NPs. | ||
The fitting was performed using the GRAMS software package32 employing the four most prominent bands assigned in Fig. 9B. The values of the frequencies and integrated intensities of the Fe–O (mn) band (the most intense in the spectra) for the two specimens are: magnetite NPs (575 cm−1, 12.03922) and ferria gel (578 cm−1, 17.56348). The so-obtained integrated intensity of the magnetite NP sample was used for the normalization of the intensities of the gel sample spectra given in Fig. 11A. Afterwards the magnetite NP spectrum was subtracted from the so obtained normalized spectra of the ferria gel. The results of the subtraction are presented in Fig. 12.
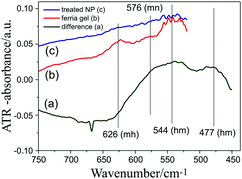
From the difference spectra shown in Fig. 12a two broad positive maxima can be observed at 544 cm−1 and 477 cm−1, which originate from a Fe2O3 structure. Literature data27 indicate that hematite shows two strong and broad bands around 560 cm−1 and 470 cm−1. It can be then supposed that the linkage that occurs between magnetite particles is through the formation of a hematite network. Another interesting fact is the similarity between these difference absorbance spectra and the IR-ATR spectra of the ferria gel and magnetite sol dried samples (that were corrected for the penetration depth). The maxima and minima of the band positions in the difference spectrum Fig. 12(a) are close to the ATR ferria gel spectrum Fig. 12(b) but not to the recorded absorbance spectra shown in Fig. 9B. The similarity between ATR and difference spectra can be explained through the fact that ATR probes the surface of the sample. Since the hematite network dominates the surface of the magnetite nanoparticles which are embedded in it, the ATR spectra are dominated by hematite bands. These bands are almost invisible in the case of the magnetite NP sample (Fig. 12(c)). In order to obtain some quantitative information on the composition of the iron oxides present in the ferria gel and magnetite NP samples, we used the information for the integral intensities of the bands originating from the magnetite and maghemite, and found their ratio (Table 1).
| Area ratio | Ferria gel | Magnetite NPs | |||
|---|---|---|---|---|---|
| 636/cm−1 (mh) | 575/cm−1 (mn) | 637/cm−1 (mh) | 578/cm−1 (mn) | ||
| Ferria gel | 636/cm−1 (mh) | 1 | 0.69176 | 0.50994 | 0.47417 |
| 575/cm−1 (mn) | 1 | 0.73717 | 0.68547 | ||
| Magnetite NPs | 637/cm−1 (mh) | 1 | 0.92987 | ||
| 578/cm−1 (mn) | 1 | ||||
The table shows the relative composition of the ferria gel and the magnetite NP sample through the content of maghemite and magnetite calculated using the integrated intensities of the corresponding bands presented in Fig. 11. If the sample thickness is different (due to the different KBr pellet thicknesses of the gel and magnetite NP samples), then the integrated area ratio between 636 and 575 cm−1 bands of the gel and 637 and 578 cm−1 bands of the magnetite NPs samples should be equal, since the extinction coefficients of the respective bands (assigned to maghemite or magnetite) are the same in both samples. However, these ratios are 0.69176 and 0.92987, respectively. This actually means that the content of maghemite and magnetite is different in both samples, with about 34% larger content of magnetite in the ferria gel sample. This is the reason why a negative minimum appears for maghemite (Fig. 12(a)). It has to be kept in mind though that the band assigned to magnetite at 575 cm−1 largely overlaps with the band at 544 cm−1 which was assigned to a possible hematite presence in the gel sample. Thus, it might appear that the formed hematite linker in the ferria gel sample accounts for the 34% “larger content” of magnetite, although a more favorable case would be that both magnetite and hematite account for this excess. The inability to detect hematite using XRD (Fig. 7A)reveals that hematite content is rather less present.
3.6 Cytotoxicity of the ferria gel
Since the ferria gel consists predominantly of interpartically linked magnetite NPs, the material demonstrates a high degree of biocompatibility according to the cytotoxicity study performed on HeLa and MSC cell lines. After 72 h exposure of ferria gel (17–270 μg mL−1) MSC and HeLa cells did not demonstrate any significant decrease in cell viability (Fig. 13A and B). By 72 h the biggest decrease of MTT conversion, a marker of cell growth inhibition, was 8% for MSC cells and 18% for HeLa cells, respectively. Any morphological signs of cell death (not shown) were not observed indicating that even at maximum tested concentrations the ferria gel was biocompatible. Compared to our magnetite cytotoxicity data the magnetite ferria gel was no more toxic and the exposure at equal doses induced similar effects in the cells.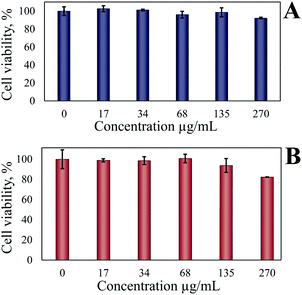 | ||
| Fig. 13 Cytotoxicity of the ferria gel. The influence of the ferria gel on the viability of MSC (A) and HeLa cells (B). Shown are mean of 3 measurements with standard deviations. | ||
3.7 Application of the magnetite gel
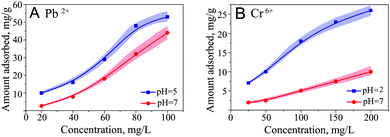
Due to the high water-holding capacity and developed microstructure, ferria gels can be used as a magnetic-responsible adsorbent for the removal of heavy metal ions or smart materials for targeted drug delivery. To assess the prospect in these fields, several sorption and desorption experiments were performed using UV-VIS spectroscopy. The sorption of heavy metals was studied for Cr6+ and Pb2+ ions frequently found in wastewater of different technological processes, such as electroplating, metal processing, pigment synthesis and others.33 Sorption equilibrium was studied at room temperature at acidic and neutral pH levels for concentrations ranging from 25 to 200 mg L−1 of Cr6+ and from 20 to 100 mg L−1 of Pb2+ (Fig. 14). According to the sorption kinetics for both metals, the equilibrium is reached within 24 hours after phase mixing. The tested concentration of adsorption isotherms showed the Freundlich-like behavior with maximal sorption capacities at neutral and acidic pH values of 10 mg g−1 and 26 mg g−1 respectively for chromate ions. In the case of lead ions the sorption capacity by magnetite reaches 44 and 53 mg g−1 in neutral and acidic media, respectively. Comparing these results with the earlier published ones,34,35 it can be concluded that the ferria gel holds great potential as an ion sorbent. The gel sorptive capacity is 225% higher than that of magnetite nanoparticles. After the adsorption of heavy metal ions ferria gels were regenerated by washing them with 0.005 M of NaOH or 0.01 M of HNO3 for Cr6+ and Pb2+ ions respectively and reused at least 3 times with a minor decrease of the sorption capacities (91% for Cr6+ and 82% for Pb2+) (Fig. 2S, ESI†). Thus, the ferria gel works well to remove Cr6+ and Pb2+ ions found in wastewater.The maximum application potential of a ferria gel can be found in the area of drug delivery systems. The high magnetization, thixotropic structure, and fully biocompatible composition of the ferria gel make it a very perspective agent for this aim especially along with the fact that all constituent gel components have approval for parenteral administration by FDA and EMA. To conceptually show this point we have selected intensively-colored organic dyes, such as methylene blue (MB), to treat methemoglobinemia,36 eosin Y (E), an anti-malaria agent37 and alizarin S (AS), for bone cancer treatment.38 The gels can be doped by direct entrapment of low-molecular weight agents in the course of gelation by the addition of molecule of interest directly to the magnetite hydrosol prior to the gelation procedure. After the addition of propylene oxide and aging, organically-doped gels are formed. Dye-doped gels are represented in Fig. 15.
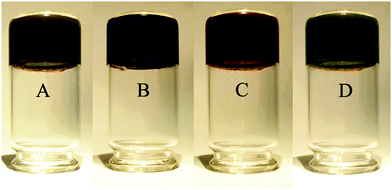 | ||
| Fig. 15 Visual appearance of dye-doped gels: (A) pure ferria gel, (B) methylene blue, (C) alizarin S, (D) eosin Y. | ||
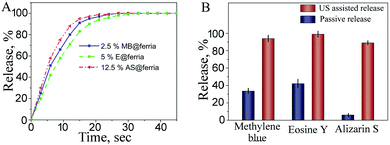
When the doped gels are transferred to water media, partial release of entrapped molecules occurs, depending on the initial mass fraction of the dye in the doped gel. As the initial loading capacities of the gel can be very high (up to 100% of dye in terms of dry magnetite), the residual dye content after MB, E and AS release is found to be 165, 75 and 431 mg g−1 respectively per 1 g of dry magnetite. In comparison with earlier reported data on dye sorption on magnetite NPs,39–41 such large sorption capacities cannot be explained by simple electrostatic interactions, but rather a fundamental property of inorganic sol–gel matrices doped by the entrapment procedure, when gelation of the system is carried out in the presence of the dopant to be entrapped.42–44 The inner environment of the sol–gel cage is different from that observed in solution, resulting in a stronger interaction of the entrapped species with the cage walls in comparison to that observed in the case of simple adsorption. The doped gel could be used to perform the stimuli-responsive release under the influence of US irradiation. Such a technique is often applied to control the release from soft materials such as lyposomes45,46 or hydrogels.47,48 Due to the thixotropic nature of the ferria gel, vibrations caused by ultrasound irreversibly destroy the gel structure and promote dopant release. After the immersion of the doped gels into 37 kHz US-bath for 30 seconds, almost full release is observed: the MB, E and AS portions of the dye found in the solution reaches 94%, 98% and 91% respectively, while the residual quantity is adsorbed on the surface of the magnetite nanoparticles (Fig. 16A and B). Since the US-triggered release of entrapped agents is occurring in a burst mode, it could be concluded that drug loaded ferria gels could be applied for therapeutic scenarios when fast and localized application of large volumes of drugs is needed. These cases involve acute pathologic conditions such as stroke, bleedings or acute localized pain.49–51 In these cases a burst release profile in combination with the potential ability to be magnetically localized in a desired area makes the ferria gel a perspective drug delivery agent.
4 Conclusion
This work described the structure, behavior and the possible applications of the pure magnetite gel obtained for the first time. The gel was prepared by propylene-oxide mediated gelation of a stable magnetite hydrosol which appeared as a dark-brown magnetic viscous thixotropic material, with up to 94% mass fraction of a solvent. The dried gel shows a developed nanoarchitecture and textural properties with a specific surface area of 135 m2 g−1 and a mean pore diameter of 19 nm. Dried gels possess a high coercivity of 65 emu g−1 and superparamagnetic behavior. The gel formation mechanism was investigated by Raman and IR spectroscopy and found to be mediated by the formation of interparticle Fe–O–Fe bonds with a hematite-like structure. The material demonstrates excellent biocompatibility in tests with HeLa and MSC cell lines in concentrations up to 270 μg mL−1. The study has revealed that the ferria gel can be used as an adsorbent for the removal of heavy metal ions with sorption capacities for Cr6+ and Pb2+ ions of up to 26 mg g−1 and 53 mg g−1, respectively. By entrapping of organic molecules in the process of gelation, it is possible to create stimuli-responsive drug delivery systems with a burst release profile under the influence of US irradiation due to its fully biocompatible composition and excellent drug loading capacity.Conflicts of interest
There are no conflicts to declare.Acknowledgements
This work was supported by Russian Science Foundation, Grant No. 16-13-00041.References
- A. Campanella, O. Holderer, K. Raftopoulos, C. Papadakis, M. Staropoli, M. Appavou, P. Müller-Buschbaum and H. Frielinghaus, Nanotechnology (IEEE-NANO), 2016 IEEE 16th International Conference on, 2016, pp. 446–447.
- S. F. Chin, A. N. B. Romainor and S. C. Pang, Mater. Lett., 2014, 115, 241–243 CrossRef CAS.
- X. Xu, H. Li, Q. Zhang, H. Hu, Z. Zhao, J. Li, J. Li, Y. Qiao and Y. Gogotsi, ACS Nano, 2015, 9, 3969–3977 CrossRef CAS PubMed.
- Y. Li, R. Zhang, X. Tian, C. Yang and Z. Zhou, Appl. Surf. Sci., 2016, 369, 11–18 CrossRef CAS.
- S. A. Meenach, J. Z. Hilt and K. W. Anderson, Acta Biomater., 2010, 6, 1039–1046 CrossRef CAS PubMed.
- Z.-Q. Zhang and S.-C. Song, Biomaterials, 2016, 106, 13–23 CrossRef CAS PubMed.
- N. S. Satarkar and J. Z. Hilt, J. Controlled Release, 2008, 130, 246–251 CrossRef CAS PubMed.
- S. Merino, C. Martn, K. Kostarelos, M. Prato and E. Vazquez, ACS Nano, 2015, 9, 4686–4697 CrossRef CAS PubMed.
- H. Li, G. Go, S. Y. Ko, J.-O. Park and S. Park, Smart Mater. Struct., 2016, 25, 027001 CrossRef.
- C. Peters, M. Hoop, S. Pané, B. J. Nelson and C. Hierold, Adv. Mater., 2016, 28, 533–538 CrossRef CAS PubMed.
- M. Rintoul, S. Torquato, C. Yeong, D. Keane, S. Erramilli, Y. Jun, D. Dabbs and I. Aksay, Phys. Rev. E: Stat. Phys., Plasmas, Fluids, Relat. Interdiscip. Top., 1996, 54, 2663 CrossRef CAS.
- J. Chatterjee, Y. Haik and C. J. Chen, Colloid Polym. Sci., 2003, 281, 892–896 CAS.
- X. Liu, M. D. Kaminski, Y. Guan, H. Chen, H. Liu and A. J. Rosengart, J. Magn. Magn. Mater., 2006, 306, 248–253 CrossRef CAS.
- S. Basak, N. Nandi, S. Paul, I. W. Hamley and A. Banerjee, Chem. Commun., 2017, 53, 5910–5913 RSC.
- M. Breulmann, H. Cölfen, H.-P. Hentze, M. Antonietti, D. Walsh and S. Mann, Adv. Mater., 1998, 10, 237–241 CrossRef CAS.
- J. Zhang, S. Xu and E. Kumacheva, J. Am. Chem. Soc., 2004, 126, 7908–7914 CrossRef CAS PubMed.
- R. F. Ziolo, E. P. Giannelis, B. A. Weinstein, M. P. O'Horo, B. N. Ganguly, V. Mehrotra, M. W. Russell and D. R. Huffman, Science, 1992, 257, 219–224 CAS.
- M. Babincová, D. Leszczynska, P. Sourivong, P. Čičmanec and P. Babinec, J. Magn. Magn. Mater., 2001, 225, 109–112 CrossRef.
- J. D. Walker and R. Tannenbaum, Chem. Mater., 2006, 18, 4793–4801 CrossRef CAS.
- A. E. Gash, T. M. Tillotson, J. H. Satcher Jr, J. F. Poco, L. W. Hrubesh and R. L. Simpson, Chem. Mater., 2001, 13, 999–1007 CrossRef CAS.
- A. C. Pierre and G. M. Pajonk, Chem. Rev., 2002, 102, 4243–4266 CrossRef CAS PubMed.
- J. W. Long, M. S. Logan, C. P. Rhodes, E. E. Carpenter, R. M. Stroud and D. R. Rolison, J. Am. Chem. Soc., 2004, 126, 16879–16889 CrossRef CAS PubMed.
- A. S. Drozdov, V. Ivanovski, D. Avnir and V. V. Vinogradov, J. Colloid Interface Sci., 2016, 468, 307–312 CrossRef CAS PubMed.
- A. Baral, S. Roy, A. Dehsorkhi, I. W. Hamley, S. Mohapatra, S. Ghosh and A. Banerjee, Langmuir, 2014, 30, 929–936 CrossRef CAS PubMed.
- D. Han, J. Wang and H. Luo, J. Magn. Magn. Mater., 1994, 136, 176–182 CrossRef CAS.
- O. N. Shebanova and P. Lazor, J. Solid State Chem., 2003, 174, 424–430 CrossRef CAS.
- Y.-S. Li, J. S. Church and A. L. Woodhead, J. Magn. Magn. Mater., 2012, 324, 1543–1550 CrossRef CAS.
- M. Hanesch, Geophys. J. Int., 2009, 177, 941–948 CrossRef CAS.
- D. De Faria and F. Lopes, Vib. Spectrosc., 2007, 45, 117–121 CrossRef CAS.
- G. V. Jacintho, A. G. Brolo, P. Corio, P. A. Suarez and J. C. Rubim, J. Phys. Chem. C, 2009, 113, 7684–7691 CAS.
- M. Gotić and S. Musić, J. Mol. Struct., 2007, 834, 445–453 CrossRef.
- V. Petruševski, V. Ivanovski, B. Šoptrajanov and M. Zugik, J. Mol. Struct., 2001, 563, 329–333 CrossRef.
- M. Barakat, Arabian J. Chem., 2011, 4, 361–377 CrossRef CAS.
- M. Kumari, C. U. Pittman and D. Mohan, J. Colloid Interface Sci., 2015, 442, 120–132 CrossRef CAS PubMed.
- V. Mikhaylov, T. Maslennikova and P. Krivoshapkin, Mater. Chem. Phys., 2017, 186, 612–619 CrossRef CAS.
- J. n. Clifton and J. B. Leikin, Am. J. Ther., 2003, 10, 289–291 CrossRef PubMed.
- T. Gebru, B. Mordmüller and J. Held, Antimicrob. Agents Chemother., 2014, 58, 7398–7404 CrossRef PubMed.
- C. Fotia, S. Avnet, D. Granchi and N. Baldini, J. Orthop. Res., 2012, 30, 1486–1492 CrossRef CAS PubMed.
- B. S. Inbaraj and B. Chen, Bioresour. Technol., 2011, 102, 8868–8876 CrossRef PubMed.
- T. Madrakian, A. Afkhami and M. Ahmadi, Spectrochim. Acta, Part A, 2012, 99, 102–109 CrossRef CAS PubMed.
- S. Giri, N. Das and G. Pradhan, Colloids Surf., A, 2011, 389, 43–49 CrossRef CAS.
- A. Slama-Schwok, M. Ottolenghi and D. Avnir, Nature, 1992, 355, 240 CrossRef CAS.
- M. Pagliaro, R. Ciriminna and G. Palmisano, Chem. Soc. Rev., 2007, 36, 932–940 RSC.
- D. Avnir, Acc. Chem. Res., 2013, 47, 579–592 CrossRef PubMed.
- A. L. Klibanov, T. I. Shevchenko, B. I. Raju, R. Seip and C. T. Chin, J. Controlled Release, 2010, 148, 13–17 CrossRef CAS PubMed.
- A. Schroeder, R. Honen, K. Turjeman, A. Gabizon, J. Kost and Y. Barenholz, J. Controlled Release, 2009, 137, 63–68 CrossRef CAS PubMed.
- H. Epstein-Barash, G. Orbey, B. E. Polat, R. H. Ewoldt, J. Feshitan, R. Langer, M. A. Borden and D. S. Kohane, Biomaterials, 2010, 31, 5208–5217 CrossRef CAS PubMed.
- N. Huebsch, C. J. Kearney, X. Zhao, J. Kim, C. A. Cezar, Z. Suo and D. J. Mooney, Proc. Natl. Acad. Sci. U. S. A., 2014, 111, 9762–9767 CrossRef CAS PubMed.
- X. Huang and C. S. Brazel, J. Controlled Release, 2001, 73, 121–136 CrossRef CAS PubMed.
- A. S. Drozdov, K. V. Volodina, V. V. Vinogradov and V. V. Vinogradov, RSC Adv., 2015, 5, 82992–82997 RSC.
- H. Zhao, R. M. Sapolsky and G. K. Steinberg, J. Cereb. Blood Flow Metab., 2006, 26, 1114–1121 CrossRef CAS PubMed.
Footnote |
| † Electronic supplementary information (ESI) available. See DOI: 10.1039/c7sm01702b |
| This journal is © The Royal Society of Chemistry 2017 |

