 Open Access Article
Self-assembly in densely grafted macromolecules with amphiphilic monomer units: diagram of states
A. A.
Lazutin
 a,
V. V.
Vasilevskaya
 *a and
A. R.
Khokhlov
ab
aA. N. Nesmeyanov Institute of Organoelement Compounds RAS, Vavilova ul., 28, Moscow 119991, Russia. E-mail: vvvas@polly.phys.msu.ru
bFaculty of Physics, M. V. Lomonosov Moscow State University, Leninskie gory, Moscow 119991, Russia
First published on 1st November 2017
Abstract
By means of computer modelling, the self-organization of dense planar brushes of macromolecules with amphiphilic monomer units was addressed and their state diagram was constructed. The diagram of states includes the following regions: disordered position of monomer units with respect to each other, strands composed of a few polymer chains and lamellae with different domain spacing. The transformation of lamellae structures with different domain spacing occurred within the intermediate region and could proceed through the formation of so-called parking garage structures. The parking garage structure joins the lamellae with large (on the top of the brushes) and small (close to the grafted surface) domain spacing, which appears like a system of inclined locally parallel layers connected with each other by bridges. The parking garage structures were observed for incompatible A and B groups in selective solvents, which result in aggregation of the side B groups and dense packing of amphiphilic macromolecules in the restricted volume of the planar brushes.
Introduction
The dense tethering of AB copolymers on the solid substrates (polymer brushes) is a promising strategy for the surface modification and generation of smart surfaces with tunable properties and definite responses to external stimuli. Upon request, the grafted AB copolymers could be assembled into different structures and then easily rearranged by changing temperature, pH, solvent quality, etc.1–3 Detailed computer and theoretical studies have revealed that the scale and spatial symmetry of these structures depend on many factors, including the grafting density and length of the macromolecules, relative content of A and B and relative length of the A and B blocks, solvent selectivity and AB incompatibility, grafting (AB vs. BA) sequence and distribution of the grafting points.4–21The architecture of macromolecules has a significant effect on brush properties. The state diagram of planar brushes made by comb polymers differs from that of linear, star and randomly branched macromolecules.21 It contains two characteristic scaling regions with weak and strong overlapping coils and a wide region with maximum stretching of the polymer chains at high grafting density. The height (H) of combed brushes slightly depends on the grafting area Σ (H ∼ Σ−1/3 for combed brushes, via Σ−1/2 for other macromolecules). Such behavior is a consequence of steric repulsion between side chains, which could be only at a sufficiently high grafting density. The steric repulsion between side chains induces elongation of the polymer backbone and its effective toughening.22–24 As a result, grafted comb macromolecules provide thicker layers with higher polymer density compared to linear macromolecules. The structure of combed brushes could be tuned by varying their side chain number and polymerization degree.25–28
In contrast to linear brushes with numerous theoretical studies and computer modeling of amphiphilic4–20 and homopolymer29,30 brushes in selective solvents, just a few papers address the self-assembly of amphiphilic combed brushes. However, it became clear that in certain practical applications, combed brushes offer an advantage over linear brushes and that the properties (wetting, adhesion, antifouling etc.) of amphiphilic comb-like brushes correlate with their spatial structure.31–36
Grafted comb copolymers with side chains having affinity to the grafting surface have been modeled in ref. 37. At low grafting density the macromolecules spread over the plane. At high grafting density, the main chains are aligned perpendicular to the surface and form a protective brush. The structure of the dense brush does not depend on the adsorption of side chains. In addition, planar brushes of comb macromolecules having polyelectrolyte side chains are explored in ref. 38 and 39.
End-grafted macromolecules composed of amphiphilic monomers units are studied in ref. 40 and 41. The concept of amphiphilic monomer units is introduced in ref. 42 and 43 to describe monomer units that contain both hydrophobic and hydrophilic groups, and thus have dualistic (hydrophobic/hydrophilic) character. The duality of the monomer units results in their simultaneous affinity and incompatibility with both polar and organic solvents, which causes their effective surface activity. It was shown that the dual properties and surface activity of amphiphilic monomer units could be regarded by the dumbbell model of monomer.44 In the framework of this model, the monomer unit is presented by two bound A and B beads. Beads A are linked with each other and form the chain backbone, and beads B are attached to each A beads as side pendants. Computer simulations showed that macromolecules with amphiphilic (A-graft-B) monomer units could form a stable necklace conformation,44,45 globules with a dense protective hydrophilic shell that are soluble at high polymer concentration,45 prolonged cylindrical structures44 and the hollow vesicle-like globules.46 The last two structures are realized in two contrasting situations with the solvent being selectively “poor for backbone and good for pendant” and “good for backbone and poor for pendant”, respectively. They could be found only for sufficiently long macromolecules, and the size of the structures scales with the degree of polymerization N as RG ∼ N and RG ∼ N1/2, correspondingly.
Computer modeling and analytical theory of end-grafted macromolecules with (A-graft-B) monomer units reveal that in brushes, the type of mesophase structure depends crucially on the solvent selectivity towards backbone A or side B groups.40,41
In a solvent poor for the polymer A backbone, dense brushes could form a system of strands from a few (up to 5) intertwined macromolecules. These strands are perpendicular to the surface, and can be only observed in the case of rather strong AB incompatibility.41
In the opposite case of the solvent being poor for the side B groups and in the absence of AB energetic interaction, the macromolecules join into clusters starting from relatively low grafting density and form ultra-thin and nearly flat micelles on the surface. The thickness of the micelles is about double the size of a monomer unit or twice larger and their shapes change with an increase in the grafting density as follows: circular micelles-prolonged micelles-inverse micelles-continuous bilayer. More densely packed brushes (grafting area Σ < 4N) reveal a disordered homogeneous structure with random positions of different groups with respect to each other.40
Herein, we aim to study dense brushes of macromolecules with amphiphilic monomer units in solvent selective for side B groups and distinct AB incompatibility.
Model and simulation technique
The studied polymer brush is composed of m macromolecules grafted to a flat impermeable surface in the sites of a square lattice with edge Σ1/2. Each macromolecule consists of N amphiphilic (A-graft-B) monomer units represented as a dumbbell of two beads, A and B, connected by a bond with the length a (Fig. 1). The beads A form a backbone and beads B are the pendants. The brush is immersed in a selective solvent that is good for the A backbone groups and poor for the pendant B groups. In accordance with the main aim herein, the contacts between the main A groups and side B groups are energetically unfavorable.The temporal evolution of the system is described by Newton equations via the molecular dynamics technique with the LAMMPS software package47 and computational resources of the Supercomputing Center of Lomonosov Moscow State University.48
The excluded volume between any non-bonded bead is described by the repulsive part of the Lennard-Jones potential, uS:
 | (1) |
![[small epsilon, Greek, tilde]](https://www.rsc.org/images/entities/i_char_e0de.gif) in this equation controls the energy scale, and parameter σ determines the length scale. We assume that σ =
in this equation controls the energy scale, and parameter σ determines the length scale. We assume that σ = ![[small epsilon, Greek, tilde]](https://www.rsc.org/images/entities/i_char_e0de.gif) = 1 for all interactions and therefore report all our results in terms of these units.
= 1 for all interactions and therefore report all our results in terms of these units.
The length of the covalent bond between i and j beads is restricted by the sum of the repulsive part of the Lennard-Jones potential, uS, (1) and finite extensible nonlinear elastic (FENE) potential, E:49
 | (2) |
The impermeability of the surface is described as steric interactions between the beads and surface via the truncated 9-3 Lennard-Jones potential, Es:50
 | (3) |
 is a cut-off distance. The parameter εs is assumed to be the same for A and B beads: εs = 2
![[small epsilon, Greek, tilde]](https://www.rsc.org/images/entities/i_char_e0de.gif) .
.
The solvent was considered implicitly by the Yukawa-type potential:
 | (4) |
The characteristic energies of the A–A, B–B and A–B interactions are considered to be variable parameters. For εαβ = 0, there is no additional repulsion (attraction) between chain beads except that corresponding to the excluded volume potential (1). For simplicity, we assume that εAA = 0. The parameter εBB is chosen to be negative: εBB < 0. The decrease in the energetic parameter εBB (increase in attractive interaction between the side group B) induces effective worsening of the solvent quality for B beads and promotes their aggregation. The nonzero (positive) parameter, εAB > 0, characterizes the A–B repulsion, and its increase leads to growth in effective surface activity of the monomer units and induces the segregation of A and B beads.
To take into account the fact that the system is in contact with a thermostat at temperature T (![[small epsilon, Greek, tilde]](https://www.rsc.org/images/entities/i_char_e0de.gif) = 1 in kBT units), the motion equations for all beads are supplemented with the friction term and Langevin uncorrelated noise term, R, which is related to the viscosity of the solvent through the fluctuation dissipation theorem:51
= 1 in kBT units), the motion equations for all beads are supplemented with the friction term and Langevin uncorrelated noise term, R, which is related to the viscosity of the solvent through the fluctuation dissipation theorem:51
| 〈Rα(0)·Rα(t)〉 = 2ΓkBTδ(t), | (5) |
In all the computational experiments, the degree of polymerization of macromolecules is N = 50; the bond length is l = 0.97; the grafting area is Σ = 4 and the grafting density normalized to the end-to-end distance, Reo2, of a macromolecule in a dense melt14 is Reo2/Σ ∼ 13. The linear size L of the cell was varied from L = 20 to L = 50, thus the total number, m, of macromolecules was from m = 100 to m = 625. The characteristic energies εAB and εBB were modified within the wide range of 1.25 ≤ εAB ≤ 5 and −10 ≤ εBB ≤ 0, respectively.
For each set of energy parameters, εAB and εBB, simulations were performed during prolonged (800τ–100![[thin space (1/6-em)]](https://www.rsc.org/images/entities/char_2009.gif) 000τ) time with the integration step of 0.002τ, where τ is the simulation time scale.
000τ) time with the integration step of 0.002τ, where τ is the simulation time scale.
The results are discussed in the next section.
Results
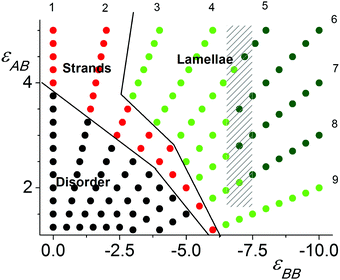
Fig. 2 shows the diagram of states computed for the cell with L = 40. The protocol of the simulation was as follows. In the initial configuration, the grafted polymer chains were extended in the z direction perpendicular to the grafting surface. Then, the system was equilibrated for zero-values of the interaction parameters: εAB = εBB = 0. Subsequently, the εAB and |εBB| values were increased simultaneously with different steps, ΔεAB and ΔεBB, so that the sets of variables {εAB and εBB} were changed along nine rays passing through the origin of the coordinates {εAB = 0 and εBB = 0}. The computations were performed as an annealing procedure since after each change in parameters {εAB and εBB} the system was equilibrated, which then served as the input conformation for calculation with the next set of εAB and εBB parameters. This protocol together with the relatively small values of ΔεAB and ΔεBB allowed us to completely calculate the field of studied εAB and εBB parameters and to avoid the system freezing. The calculations were performed for two totally independent runs.The points shown in diagram of Fig. 2 are posted along the trajectories of the calculations, which are nine rays starting in the beginning of the coordinate system {εAB = 0 and εBB = 0} and have different angles to the coordinate axis. The rays are enumerated in the sequence beginning from the ray being parallel to the εAB axis: εBB = 0 (Ray 1); −0.4εAB (Ray 2); −0.8εAB (Ray 3); −1.2εAB (Ray 4); −1.6εAB (Ray 5); −2εAB (Ray 6); −2.5εAB (Ray 7); −3.3εAB (Ray 8) and −5εAB (Ray 9). Their serial numbers are shown on the edges of the diagram.
At low values of εAB and εBB the monomer units are distributed randomly with respect to each other without visible ordering and/or group separation. This field is marked by black points. The ordered structures appeared at relatively high values of repulsive εAB and attractive |εBB| interactions and were identified as strands (red points) or lamellae (green points). We distinguished lamellae with relatively smaller (light green points) and larger (dark green points) domain spacing. The boundaries between the different regions were designated by order parameters. The domain spacing was determined by the maximum of the structure factor. Within the shaded area, the structure factor has two maxima with comparable heights and points are painted by the color of the largest maxima.
Snapshots of the typical observed structures are presented in Fig. 3.
The first snapshot (Fig. 3A, εBB = 0) is a system of strands which are called aggregates of several chains. The cores of these aggregates are formed by backbone A groups. Side B groups create the outer periphery.41 At a higher value of |εBB| some of the strands are merged into prolonged clusters which could be considered as short lamellae. The short lamellae form a few domains and coexist with the strands (Fig. 3B). This structure (Fig. 3B) is the intermediate state between strands (Fig. 3A) and lamellae (Fig. 3C) which are observed at stronger attractive interaction |εBB|. Finally, Fig. 3D shows the lamellae structure with disturbed parallel ordering of different layers and with visible connections (bridges) between some of them. This is found at higher values of |εBB| (within the dashed region in the state diagram) and referred to as the parking garage structure.52
For order parameters, we employed the mixing degree 〈η〉53 and distribution P(Ω) of A–B bond orientations. The mixing degree 〈η〉 provides a quantitative estimation of A and B intermixing. The distribution P(Ω) allows us to place a boundary between the strands and lamellae.
The mixing degree 〈η〉 was determined as the product of the local relative content of A and B groups averaged over space.53 In our calculations η is measured as follows:
![[r with combining right harpoon above (vector)]](https://www.rsc.org/images/entities/i_char_0072_20d1.gif) ) and nB(
) and nB(![[r with combining right harpoon above (vector)]](https://www.rsc.org/images/entities/i_char_0072_20d1.gif) ) are the total number of A and B groups within bin:
) are the total number of A and B groups within bin: ![[r with combining right harpoon above (vector)]](https://www.rsc.org/images/entities/i_char_0072_20d1.gif) = {x = Δ; y + Δ; z + Δ}.
= {x = Δ; y + Δ; z + Δ}.
The mixing degree η could range from 0 for bin with A or B groups only to η = 0.25 when bin contains equal numbers of A and B groups, i.e., the A–B composition of bin coincides with the total composition of grafted macromolecules. The average value 〈η〉 (at a proper choice of bin) allows us to estimate the measure of mixing of A–B components in the entire system. Thus, it could be helpful for the detection of the A–B segregation with an increase in A–B incompatibility.53
The mixing degree 〈η〉 (averaged over time) for the different energy parameters εAB and εBB and bin size Δ = 2σ was calculated along the nine rays shown in Fig. 2 and the results are presented in Fig. 4. Incidentally, two independent runs gave almost the same results. The perceptible deviations are observed only for some points in Rays 1–5, which are indicated by vertical bars and in fact never exceed 7%. In other points, the relative errors are smaller than the symbol size.
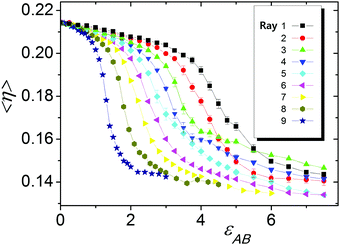 | ||
| Fig. 4 Mixing parameter 〈η〉 as a function of εAB for the different rays. Vertical bars indicate the error. | ||
It is seen that at εAB = 0 (εBB = 0 as well) the mixing degree is 〈η〉 ∼ 2.15, which is very close to the maximum possible value, ηmax = 0.25. With an increase in εAB, the mixing degree 〈η〉 monotonously decreases. For all nine rays, the dependencies 〈η(εAB)〉 have a sigmoidal shape and contain a field of drastic, almost two-fold 〈η〉 reduction, indicating transition to the segregated state. The position of this transition and its sharpness are significantly different for the different rays. In case of Ray 1 with εBB = 0, the transition field is the widest and it covers a significant region at large values of εAB: εAB ∼ 4.0–6.0. Ray 9, with the fastest growth of B–B (εBB = −5εAB), has the narrowest transition field at small values of εAB. We did not take into account these peculiarities and for all cases the inflection points of 〈η(εAB)〉 were stated as crossover points between the disordered position of the A and B groups and segregated state, which in all cases were visually recognized as strands.
To reveal the boundary between the strands and lamellae on the state diagram, the bond A–B vectors, ![[r with combining right harpoon above (vector)]](https://www.rsc.org/images/entities/i_char_0072_20d1.gif) AB(i), were projected on the grafting XY plane, Prxy[
AB(i), were projected on the grafting XY plane, Prxy[![[r with combining right harpoon above (vector)]](https://www.rsc.org/images/entities/i_char_0072_20d1.gif) AB(i)], and the distributions P(Ω) of these projections over the orientation were calculated. For each monomer unit, i, the orientation angle Ωi (i = 1;…;mN) was determined as the angle between its projection Prxy[
AB(i)], and the distributions P(Ω) of these projections over the orientation were calculated. For each monomer unit, i, the orientation angle Ωi (i = 1;…;mN) was determined as the angle between its projection Prxy[![[r with combining right harpoon above (vector)]](https://www.rsc.org/images/entities/i_char_0072_20d1.gif) AB(i)] and axis oX: Ωi = arctan(yAB(i)/xAB(i)).
AB(i)] and axis oX: Ωi = arctan(yAB(i)/xAB(i)).
Fig. 5 presents the P(Ω) calculated along Ray 6 (Fig. 5A) and Ray 4 (Fig. 5B) with progressive shifts from the beginnings of the rays (εAB = εBB = 0) until their ends.
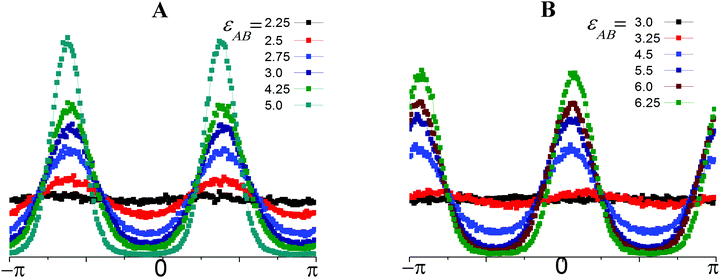 | ||
| Fig. 5 Distributions, P, of the AB bonds over orientation, Ω, at different values of εAB and εBB = −2εAB (Ray 6, A); and εBB = −1.2εAB (Ray 4, B). | ||
In the totally disordered state as well in the strand-like structures, the angle Ω could accept any value within the interval (−π; π) with equal probability and the P(Ω) distributions fluctuate slightly around a constant (Fig. 5A, εAB = 2.25 and Fig. 5B, εAB = 3.0). At εAB = 2.5; εBB = −5 (Fig. 5A) and εAB = 4.5; εBB = −5.4 (Fig. 5B) the distributions appear wavy due to the association of some strands into lamellae and the appearance of a preferable Ω orientation. Thus, we include systems with a wavy P(Ω) to the lamellae field in the diagram of states. However, the visual analysis reveals that in systems with wavy P(Ω), the strands and lamellae coexist. A further shift along the rays to higher εAB and |εBB| parameters leads to the disappearance of the strands, a significant increase in the maximal P(Ω) values and decrease in the minimal values of the distributions. Finally, the maxima peaks become narrow, and the minima fall to almost zero. In both cases, the distributions have two maxima at Ω1 and Ω2 and the distance between the position of the first Ω1 and second Ω2 maxima is approximately π: |Ω2 − Ω1| = π. Thus, the majority of A–B bonds are allocated along the single director in two opposite directions perpendicular to the surface of the layer. The positions of the maxima allow the inclination angle, β, of the lamellae to the oX axis to be estimated as β = |π/2 − Ω1|. The lamellae are inclined at the angles of β ∼ 36° and β ∼ 78° in the first (Fig. 5A) and second (Fig. 5B) cases, correspondingly.
In order to determine the domain spacing (period), d, of the lamellae, we computed the structure factor according to the procedure from ref. 54:
![[r with combining right harpoon above (vector)]](https://www.rsc.org/images/entities/i_char_0072_20d1.gif) ij is the vector between groups (i, j = 1,…,2mN) and ei is −1 for the A groups and +1 for the B groups.
ij is the vector between groups (i, j = 1,…,2mN) and ei is −1 for the A groups and +1 for the B groups.
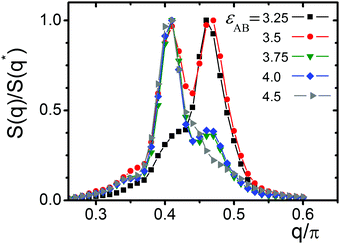
The results of calculations along Ray 6 are shown in Fig. 6. One can distinguish S(q) with different positions, q*, of maximum, indicating that the structure could have different domain sizes, d: d = 2π/q*. At εAB = 3.25 the structure factor S(q) has a maximum at q2* ∼ 0.46π and thus d ∼ 4.35. At εAB = 3.5 S(q) exhibits two peaks at q1* ∼ 0.41π and q2* ∼ 0.46π which have approximately equal height. Further shifts along Ray 6 (increase in εAB) lead to an increase in peak height at q1* ∼ 0.41π. Simultaneously, the second peak q2* diminishes and finally vanishes. The entire system transforms to a lamellae structure with a larger spacing structure of d ∼ 4.88.
From the visual analysis we conclude that lamellae with different domain spacing are formed at different distances from the grafting surface (see Fig. 7A). They self-organize into a single structure, where the thick lamellae of the top layer split into thinner lamellae of the bottom layer. As a result, instead of a neat stack of separated B sheets, a unique system of defected sheets or sheets with holes (Fig. 7B) connected with each other is obtained, which is the so-called parking garage structure.
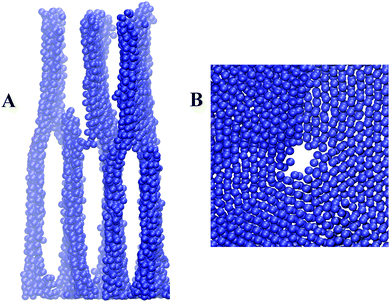 | ||
| Fig. 7 Connected layers with different domain spaces (A) and one consisting of sheets (B). Only side B groups are shown. | ||
The structure factor S(q) was calculated for the entire lamellae region. It was found that the position of its maxima, q*, depends on εAB and εBB. The lamellae domain spacing d = 2π/q* grows with an increase in εAB and εBB. The points in the lamellae field of the state diagram (Fig. 2) are colored in accordance with their maximum value, q*. The points with q*/π > 0.44 are shown by light green, and those with q*/π < 0.44 are painted in dark green. The field with the structure factor having two maxima is shaded. The structures having S(q) with two comparable peaks are associated with the so-called parking garage structure. Moreover, we would like to mention that we visually observed connections between the different layers beyond the shaded region as well.
As shown in (Fig. 2), lamellae are observed in the case of strong attractive B–B interactions both for strong and weak repulsion of the A and B groups. It seems that the formation of these structures allows maximum contact between the B–B groups within densely packing planar brushes.
The volume fraction, ϕ, of polymer and distribution, Pend, of the chain ends as a function of distance, z, from the grafting surface are presented in Fig. 8. To calculate these values, the simulation cell was divided into layers of height Δz = 1. Pend(z) is the number of chain ends found within a layer (z; z + Δz). The volume fraction ϕ(z) was evaluated as:
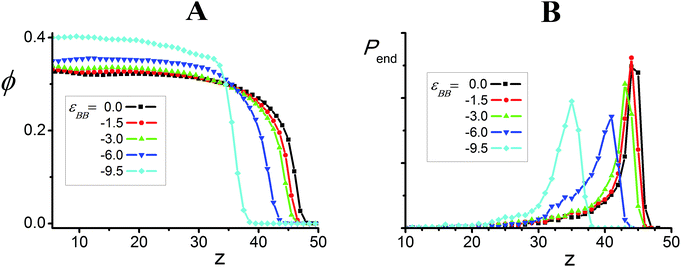 | ||
| Fig. 8 Volume fraction of polymer, ϕ, (A) and distribution Pend (B) of chain ends as a function of distance, z, for εAB = 3.75 and different values of εBB. | ||
We can see that in all the cases, the content ϕ of polymer in the brush is rather high and that it grows with an increase in |εBB|. The increase in the attractive interaction εBB also leads to appreciable shrinkage of the average brush width: at εBB = 0 the function ϕ(z) goes to zero at z = 48 and it reaches zero at z ∼ 39 for εBB = −9.5. At εBB = 0 most of the macromolecules are almost totally stretched, where the distribution Pend(z) has a well-pronounced maximum at z ∼ 44.5 (Fig. 4B). The maximum of the distribution Pend(z) shifts to low values of z and the distribution itself becomes wider with an increase in |εBB|. Thus, the increase in the attractive B–B interaction εBB leads to compaction of the macromolecules and growth of the volume fraction ϕ of polymer within the brushes. Under such conditions, the lamellae bend to create sufficient surface for the appropriate disposition of the amphiphilic groups. The outer parts of the bended lamellae come in close contact with each other. The visual analysis infers that such contacts lead to the reconstruction of neighboring lamellae and the appearance of bridges between them. The bridges arising on top of the polymer brush shift closer to the grafting surface and depending on the interaction parameters, these bridges could be preserved (S(q) has two peaks) or disappear (S(q) has a single peak).
To determine the influence of a finite cell size on the lamellae transformation, we computed systems with different linear sizes, L. The results presented in Fig. 9 show the dependence of q* on L. The dependencies were computed for two sets of εAB and εBB, which were close but chosen from opposite sides of the point with a double-peak S(q) for L = 40 (see Fig. 6).
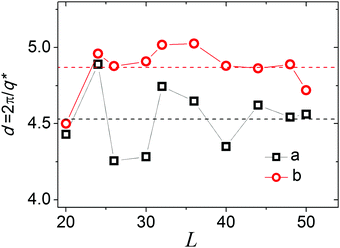 | ||
| Fig. 9 Domain spacing, d, as a function of cell size, L, for εAB = 3.0 (a) and 4.75 (b). εBB = −2εAB. Dash lines are averaged values. | ||
We can see that in both cases the domain spacing, d*, fluctuates strongly with L. The lamellae structures at different εAB have visibly different domain spaces, d, thus it is problematic to choose a “commensurate size” cell54 that perfectly fits the domain spacing, contains an integral number of periods and could mitigate the finite problems while studying the transition between lamellae with different domain spacing, d, particularly since the macromolecules are grafted in a regular manner with definite distances from each other. To fit the required domain spacing, which is determined both by macromolecular structure and the lattice of the grafting points, the lamellae have to change their inclination angle with a change in L. In the cell with L = 26, the lamellar formed at εAB = 3 spontaneously settle themselves parallel to oX: β ∼ 0°. We propose that this cell size could be considered as the commensurate size (for lamellar with lower spacing) and additional calculations should be performed to study the details of the transition between lamellae with different domain spacing.
In this scenario, we took the cell with lamellae parallel to oX (formed at εSAB = 2.75 and εBB = −2εAB in the cell with L = 26) and abruptly changed the interaction parameter to εFAB = εSAB + ΔAB and monitored the transformation of the structure with time, t.
Fig. 10 shows the instant snapshots and structure factor S(q) of the cell with ΔAB = 0.5. The starting system (Fig. 9A) consists of six lamellae parallel to the edge of the grafting plane. At t ∼ 325![[thin space (1/6-em)]](https://www.rsc.org/images/entities/char_2009.gif) 00τ, the top layer has just five lamellae, while the bottom layer contains six lamellae. The system as a whole appears like a set of parallel lamellae connected with each other by bridges. With time the bridges shift closer to the grafting surface, and the thickness of the top layer with a larger domain spacing, d, increases. At t = 100
00τ, the top layer has just five lamellae, while the bottom layer contains six lamellae. The system as a whole appears like a set of parallel lamellae connected with each other by bridges. With time the bridges shift closer to the grafting surface, and the thickness of the top layer with a larger domain spacing, d, increases. At t = 100![[thin space (1/6-em)]](https://www.rsc.org/images/entities/char_2009.gif) 000τ we again observed a perfect lamellar structure but the domain spacing, d, of this structure is larger than that of the initial system.
000τ we again observed a perfect lamellar structure but the domain spacing, d, of this structure is larger than that of the initial system.
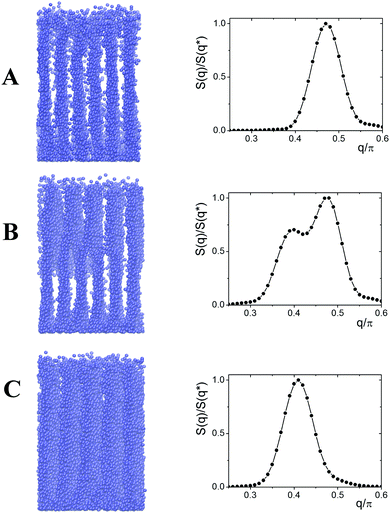 | ||
Fig. 10 Instant snapshots and structure factor at t = 0 (A); 37![[thin space (1/6-em)]](https://www.rsc.org/images/entities/char_2009.gif) 500τ (B); and 100 500τ (B); and 100![[thin space (1/6-em)]](https://www.rsc.org/images/entities/char_2009.gif) 000τ (C). L = 26, ΔAB = 0.5. 000τ (C). L = 26, ΔAB = 0.5. | ||
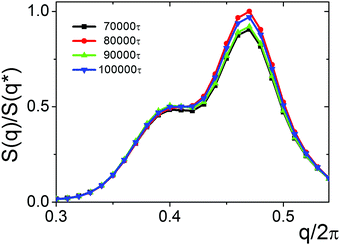
We studied four different values of ΔAB: ΔAB = 0.25, 0.5, 0.75 and 1.0. In the case of the relatively small ΔAB = 0.25 (εFAB = 3.0), the lamellae with small domain spacing (Fig. 10A) are transformed into parking garage structures with the structure factor, S(q), having two peaks with different heights (Fig. 11). It is observed that the positions of the maxima remain intact with time. The relative heights of the maxima fluctuate slightly indicating that the structure is preserved during prolonged calculations, thus it could be treated as an equilibrium state.
In the other cases, the lamellae with big domain spacing were formed and the parking garage structure was the intermediate state. Our calculations show that the time of the lamellae transformation decreases with an increase in ΔAB.
Thus, we conclude that a stable system of mutually connected lamellae could be observed within the region of transformation for lamellae with different domain spacing. In such systems, the domain spacing of the top layer is higher than the spacing between lamellae in the bottom layer and different lamellae are connected with each other. The parallel ordering of lamellae and smooth connections between them justify the comparison of such systems with the parking garage structure. The term “parking garage structure”52 was recently introduced to describe such type of ordering in biological systems, and now finds application in other fields of science.55
The parking garage structure of stacked lamellae (membrane sheets), connected by twisted lamellae (membranes), is typical for the endoplasmic reticulum.52,56 It is believed that such specific organization is caused by the space limitation of the cell and serves to promote the synthesis of secretory protein.35,36,40 Currently, parking garage structures are the subject of theoretical studies based on the analysis of elastic energy of curved and twisted solid surfaces.57–59
In the simulations presented herein, parking garage structures emerge spontaneously as a result of the transformation of lamellae with different domain spacing under space restrictions of dense grafting of macromolecules on a flat surface. We believe that this study is useful for understanding the mechanism of reorganization in systems of densely packed amphiphilic substances and could serve as the basis for new theoretical models and approaches.
Conflicts of interest
There are no conflicts to declare.Acknowledgements
The research was financially supported by the Russian Science Foundation (Project No. 14-13-00745). Authors thank D. E. Larin for fruitful discussions.References
- W. J. Brittain, S. G. Boyes, A. M. Granville, M. Baum, B. K. Mirous, B. Akgun, B. Zhao, C. Blickle and M. D. Foster, Surface rearrangement of diblock copolymer brushes – stimuli responsive films, Adv. Polym. Sci., 2006, 198, 125–147 CrossRef CAS.
- S. Minko, Responsive polymer brushes, J. Macromol. Sci., Polym. Rev., 2006, 46, 397–420 CrossRef CAS.
- J. O. Zoppe, N. C. Ataman, P. Mocny, J. Wang, J. Moraes and H.-A. Klok, Surface-initiated controlled radical polymerization: state-of-the-art, opportunities, and challenges in surface and interface engineering with polymer brushes, Chem. Rev., 2017, 3, 1105–1318 CrossRef PubMed.
- H. Dong, J. F. Marko and T. A. Witten, Phase separation of grafted copolymers, Macromolecules, 1994, 27, 6428–6442 CrossRef CAS.
- D. Gersappe, M. Fasolka, R. Israels and A. C. Balazs, Modeling the behavior of random copolymer brushes, Macromolecules, 1995, 28, 4753–4755 CrossRef CAS.
- E. B. Zhulina, C. Singh and A. C. Balazs, Forming patterned films with tethered diblock copolymers, Macromolecules, 1996, 29, 6338–6348 CrossRef CAS.
- G. Brown, A. Chakrabarti and J. F. Marko, Layering phase separation of densely grafted diblock copolymers, Macromolecules, 1996, 28, 7817–7821 CrossRef.
- P. G. Ferreira and L. Leibler, Copolymer brushes, J. Chem. Phys., 1996, 105, 9362–9370 CrossRef CAS.
- Y. Yin, P. Sun, B. Li, T. Chen, Q. Jin, D. Ding and A.-C. Shi, A simulated annealing study of diblock copolymer brushes in selective solvents, Macromolecules, 2007, 40, 5161–5170 CrossRef CAS.
- J. Wang and M. Muller, Microphase separation of diblock copolymer brushes in selective solvents: Single-chain-in-mean-field simulations and integral geometry analysis, Macromolecules, 2009, 42, 2251–2264 CrossRef CAS.
- B. Akgun, G. Ugur, W. J. Brittain, C. F. Majkrzak, X. Li, J. Wang, H. Li, D. T. Wu, Q. Wang and M. D. Foster, Internal structure of ultrathin diblock copolymer brushes, Macromolecules, 2009, 42, 8411–8422 CrossRef CAS.
- M. W. Matsen and G. H. Griffiths, Melt brushes of diblock copolymer, Eur. Phys. J. E: Soft Matter Biol. Phys., 2009, 29, 219–227 CrossRef CAS PubMed.
- D. Meng and Q. Wang, Solvent response of diblock copolymer brushes, J. Chem. Phys., 2009, 130, 134904 CrossRef PubMed.
- J. Wang and M. Muller, Memory effects of diblock copolymer brushes and mixed brushes, Langmuir, 2010, 26, 1291–1303 CrossRef CAS PubMed.
- O. A. Guskova and C. Seidel, Mesoscopic simulations of morphological transitions of stimuli-responsive diblock copolymer brushes, Macromolecules, 2011, 44, 671–682 CrossRef CAS.
- D. Menga and Q. Wang, Stimuli-response of charged diblock copolymer brushes, J. Chem. Phys., 2011, 135, 224904 CrossRef PubMed.
- K. Gong, B. D. Marshall and W. G. Chapmana, Response behavior of diblock copolymer brushes in explicit solvent, J. Chem. Phys., 2012, 137, 154904 CrossRef PubMed.
- A. A. Rudov, P. G. Khalatur and I. I. Potemkin, Perpendicular domain orientation in dense planar brushes of diblock copolymers, Macromolecules, 2012, 45, 4870–4875 CrossRef CAS.
- R. Jiang, B. Li, Z. Wang and Y. Yin, Self-assembled morphologies of diblock copolymer brushes in poor solvents, Macromolecules, 2012, 45, 4920–4931 CrossRef CAS.
- S. V. Venev and I. I. Potemkin, Swelling of chemical and physical planar brushes of gradient copolymers in a selective solvent, Soft Matter, 2014, 10, 6442–6450 RSC.
- E. B. Zhulina and T. A. Vilgis, Scaling theory of planar brushes formed by branched polymers, Macromolecules, 1995, 28, 1008–1015 CrossRef CAS.
- H.-P. Hsu, W. Paul and K. Binder, Structure of bottle-brush polymers in solution: A Monte Carlo test of models for the scattering function, J. Chem. Phys., 2008, 129, 204904 CrossRef PubMed.
- M. Saariaho, A. Subbotin, I. Szleifer, O. Ikkala and G. ten Brinke, Effect of side chain rigidity on the elasticity of comb copolymer cylindrical brushes: A Monte Carlo simulation study, Macromolecules, 1999, 32, 4439–4443 CrossRef CAS.
- H.-P. Hsu, K. Binder and W. Paul, How to define variation of physical properties normal to an undulating one-dimensional object, Phys. Rev. Lett., 2009, 103, 198301 CrossRef PubMed.
- E. Wernersson and P. Linse, Lateral interactions in brush layers of bottle brush polymers, Langmuir, 2014, 30, 1117–11121 CrossRef PubMed.
- G. M. Leuty, M. Tsige, G. S. Grest and M. Rubinstein, Tension amplification in tethered layers of bottle-brush polymers, Macromolecules, 2016, 49, 1950–1960 CrossRef CAS PubMed.
- W. M. de Vos, F. A. M. Leermakers, S. Lindhoud and S. W. Prescott, Modeling the structure and antifouling properties of a polymer brush of grafted comb-polymers, Macromolecules, 2011, 34, 2334–2342 CrossRef.
- K. J. Modica, T. B. Martin, B. Tyler and A. Jayaraman, Effect of polymer architecture on the structure and interactions of polymer grafted particles: theory and simulations, Macromolecules, 2017, 50, 4854–4866 CrossRef CAS.
- T. T. Pham, S. K. Pattanayek and G. G. Pereira, Morphological structures formed by grafted polymers in poor solvents, J. Chem. Phys., 2005, 123, 034904 CrossRef CAS PubMed.
- K. Binder and A. Milchev, Polymer brushes on flat and curved surfaces: how computer simulations can help to test theories and to interpret experiments, J. Polym. Sci., Part B: Polym. Phys., 2012, 50, 1515–1550 CrossRef CAS.
- A. Synytska, E. Biehlig and L. Ionov, Adaptive PEG–PDMS brushes: effect of architecture on adhesiveness in air and under water, Macromolecules, 2014, 47, 8377–8385 CrossRef CAS.
- A. Synytska, E. Svetushkina, D. Martina, C. Bellmann, F. Simon, L. Ionov, M. Stamm and C. Creton, Intelligent materials with adaptive adhesion properties based on comb-like polymer brushes, Langmuir, 2012, 28, 16444–16454 CrossRef CAS PubMed.
- G. Gunkel, M. Weinhart, T. Becher, R. Haag and W. T. S. Huck, Effect of polymer brush architecture on antibiofouling properties, Biomacromolecules, 2011, 12, 4169–4172 CrossRef CAS PubMed.
- S. Herrwerth, W. Eck, S. Reinhardt and M. Grunze, Factors that determine the protein resistance of oligoether self-assembled monolayers – internal hydrophilicity, terminal hydrophilicity, and lateral packing density, J. Am. Chem. Soc., 2003, 125, 9359–9366 CrossRef CAS PubMed.
- A. Hucknall, S. Rangarajan and A. Chilkoti, In pursuit of zero: polymer brushes that resist the adsorption of proteins, Adv. Mater., 2009, 21, 2441–2446 CrossRef CAS.
- C. Blaszykowski, S. Sheikh and M. Thompson, Surface chemistry to minimize fouling from blood-based fluids, Chem. Soc. Rev., 2012, 41, 5599–5612 RSC.
- E. Wernersson and P. Linse, Spreading and brush formation by end-grafted bottle-brush polymers with adsorbing side chains, Langmuir, 2013, 29, 10455–10462 CrossRef CAS PubMed.
- Q. Cao, C. Zuo, Y. Ma, L. Li, S. Chen and Z. Hu, Molecular dynamics simulations of end-grafted polymers with charged side chains, J. Polym. Sci., Part B: Polym. Phys., 2011, 42, 882–889 CrossRef.
- J.-M. Y. Carrillo and A. V. Dobrynin, Molecular dynamics simulations of grafted layers of bottle-brush polyelectrolytes, Langmuir, 2010, 26, 18374–18381 CrossRef CAS PubMed.
- A. A. Lazutin, E. N. Govorun, V. V. Vasilevskaya and A. R. Khokhlov, New strategy to create ultra-thin surface layer of grafted amphiphilic macromolecules, J. Chem. Phys., 2015, 142, 184904 CrossRef CAS PubMed.
- D. E. Larin, A. A. Lazutin, E. N. Govorun and V. V. Vasilevskaya, Self-assembly into strands in amphiphilic polymer brushes, Langmuir, 2016, 32, 7000–7008 CrossRef CAS PubMed.
- I. M. Okhapkin, E. E. Makhaeva and A. R. Khokhlov, Two-dimensional classification of amphiphilic monomers based on interfacial and partitioning properties. 1. Monomers of synthetic water-soluble polymers, Colloid Polym. Sci., 2005, 284, 117–123 CAS.
- I. M. Okhapkin, A. A. Askadskii, V. A. Markov, E. E. Makhaeva and A. R. Khokhlov, Two-dimensional classification of amphiphilic monomers based on interfacial and partitioning properties. 2. Amino acids and amino acid residues, Colloid Polym. Sci., 2005, 284, 575–585 Search PubMed.
- V. V. Vasilevskaya, P. G. Khalatur and A. R. Khokhlov, Conformational polymorphism of amphiphilic polymers in a poor solvent, Macromolecules, 2003, 36, 10103–10111 CrossRef CAS.
- V. V. Vasilevskaya, A. A. Klochkov, A. A. Lazutin, P. G. Khalatur and A. R. Khokhlov, HA (Hydrophobic/Amphiphilic) copolymer model: coil-globule transition versus aggregation, Macromolecules, 2004, 37, 5444–5460 CrossRef CAS.
- A. A. Glagoleva, V. V. Vasilevskaya and A. R. Khokhlov, Vesicle-like globules of amphiphilic macromolecules, Macromol. Theory Simul., 2015, 24, 393–398 CrossRef CAS.
- S. J. Plimpton, Fast parallel algorithms for short-range molecular dynamics, J. Comput. Phys., 1995, 117, 1–19 CrossRef CAS.
- V. Sadovnichy, A. Tikhonravov, V. l. Voevodin and V. Opanasenko, “Lomonosov”: Supercomputing at Moscow State University. in Contemporary High Performance Computing: From Petascale toward Exascale, ed. J. S. Vetter, Chapman & Hall/CRC Computational Science; CRC Press, Boca Raton, USA, 2013, pp. 283–307 Search PubMed.
- K. Kremer and G. S. Grest, Dynamics of entangled linear polymer melts: a molecular-dynamics simulation, J. Chem. Phys., 1990, 92, 5057–5086 CrossRef CAS.
- F. F. Abraham and Y. Singh, The structure of a hard-sphere fluid in contact with a soft repulsive wall, J. Chem. Phys., 1977, 67, 2384–2385 CrossRef CAS.
- T. Schneider and E. Stoll, Molecular-dynamics study of a three-dimensional one-component model for distortive phase transitions, Phys. Rev. B: Solid State, 1978, 17, 1302–1322 CrossRef CAS.
- M. Terasaki, T. Shemesh, N. Kasthuri, R. W. Klemm, R. Schalek, K. J. Hayworth, A. R. Hand, M. Yankova, G. Huber, J. W. Lichtman, T. A. Rapoport and M. M. Kozlov, Stacked endoplasmic reticulum sheets are connected by helicoidal membrane motifs, Cell, 2013, 154, 285–296 CrossRef CAS PubMed.
- S. Mao, Q. MacPherson, J. Qin and A. J. Spakowitz, Field-theoretic simulations of random copolymers with structural rigidity, Soft Matter, 2017, 13, 2760–2772 RSC.
- A. Arora, D. C. Morse, F. S. Bates and K. D. Dorfman, Commensurability and finite size effects in lattice simulations of diblock copolymers, Soft Matter, 2015, 11, 4862–4867 RSC.
- C. J. Horowitz, D. K. Berry, M. E. Caplan, G. Huber and A. S. Schneider, Parking-garage structures in astrophysics and biophysics, Phys. Rev. C, 2016, 94, 055801 CrossRef.
- L. M. Westrate, J. E. Lee, W. A. Prinz and G. K. Voeltz, Form follows function: the importance of endoplasmic reticulum shape, Annu. Rev. Biochem., 2015, 84, 791–811 CrossRef CAS PubMed.
- J. Guven, G. Huber and D. M. Valencia, Terasaki spiral ramps in the rough endoplasmic reticulum, Phys. Rev. Lett., 2014, 113, 188101 CrossRef PubMed.
- Y. Schweitzer, T. Shemesh and M. M. Kozlov, A model for shaping membrane sheets by protein scaffolds, Biophys. J., 2015, 109, 564–573 CrossRef CAS PubMed.
- E. G. Fedorov and T. Shemesh, Physical model for stabilization and repair of trans-endothelial apertures, Biophys. J., 2017, 112, 388–397 CrossRef CAS PubMed.
| This journal is © The Royal Society of Chemistry 2017 |


