DOI:
10.1039/C7SM01258F
(Paper)
Soft Matter, 2017,
13, 6894-6904
Creasing in evaporation-driven cavity collapse†
Received
26th June 2017
, Accepted 10th August 2017
First published on 22nd August 2017
Abstract
We report on crease morphology and evolution at the surface of contracting cavities embedded within elastomeric solids of varying composition (Sylgard 184: pre-polymer to crosslinker mixing ratios of 10![[thin space (1/6-em)]](https://www.rsc.org/images/entities/char_2009.gif) :1, 12:1, 17.5:1, and 25:1). Cavity contraction is achieved through evaporation of an embedded 10 μL liquid droplet. In validation of recent theoretical predictions, strain-stiffening modeled via the Gent constitutive relation [Jin and Suo, JMPS, 2015, 74, 68–79] is found to govern both crease onset and crease density. Specifically, crease onset matches prediction using only experimentally-measured parameters. Neo-Hookean solids are found to prefer initiating creasing with many short creases that join to form a collapsed state with only a few creases, whereas creasing in Gent solids initiates with a few creases that propagate across the cavity surface. These experimental observations are explained by energy minimization using finite element simulation of a cylindrical crease geometry.
:1, 12:1, 17.5:1, and 25:1). Cavity contraction is achieved through evaporation of an embedded 10 μL liquid droplet. In validation of recent theoretical predictions, strain-stiffening modeled via the Gent constitutive relation [Jin and Suo, JMPS, 2015, 74, 68–79] is found to govern both crease onset and crease density. Specifically, crease onset matches prediction using only experimentally-measured parameters. Neo-Hookean solids are found to prefer initiating creasing with many short creases that join to form a collapsed state with only a few creases, whereas creasing in Gent solids initiates with a few creases that propagate across the cavity surface. These experimental observations are explained by energy minimization using finite element simulation of a cylindrical crease geometry.
1 Introduction
The range of known geometric and material parameters governing creasing1–3 highlight deformation as a means for controlling the surface topology of soft solids. Like the related phenomena of wrinkling and folding, crease-like deformation has been leveraged by technology4–6 and nature7,8 alike. Because these phenomena are primarily found on surfaces, most observations have been on planar2,3,9,10 or convex geometries.8 Recently, creasing on the inner surface of everted cylinders has been observed cross-sectionally,11 here we describe creasing on the inner surface of a spherical cavity within an elastomeric solid.
This study was motivated by both theoretical predictions for osmosis-driven collapse12 as well as an aim toward understanding biological structural changes due to fluid loss from an enclosed cavity. For example, in the animal kingdom, the female reproductivity cycle involves regression of the post-egg-release corpus luteum (a fluid filled transient endocrine gland essential to fertility) to corpus albicans before eventual re-absorption.13 In the plant kingdom, structures in organ-based plants couple water flux to geometric changes in order to achieve motion without muscle.14,15 The latter coupling is found in hygromorphs;16,17 surface tension propulsion;18 and drying-associated, hydrostatic-pressure-driven energy storage that precedes failure19 or cavitation15,20 events. As a result of the large deformations in these soft systems, creases are observed at the inner liquid–solid interface. We begin to explore the formation of these creases in a spherically symmetric geometry by embedding a droplet within a large elastomeric solid (Fig. 1).
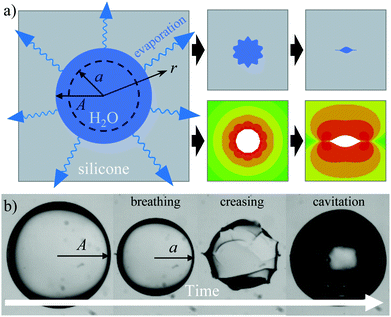 |
| | Fig. 1 Overview of experimental system. (a) Schematic of an embedded water droplet contracting via evaporation through the silicone elastomer. Contraction leads to surface creasing (top right). Bottom right: results from finite element simulation of deformation within a cylindrical cavity. (b) Progression of a cavity during evaporation: breathing mode, creasing at the liquid solid interface, and eventual cavitation of the liquid droplet within. | |
Briefly, creasing in soft solids is due to the application of a globally compressive strain that, after reaching a critical value, results in the onset of localized, self-contacting deformations on the solid's surface.1 An overview of the extensive creasing literature is available in a number of important publications.1,2,21 Here we will focus on three key findings most relevant to describing our observations of creasing in spherical cavities within elastomeric solids. First, recent theory finds that hyperelastic strain-stiffening delays the onset of creasing as a function of applied strain.22 For reference, incompressible, neo-Hookean elastomers, which exhibit no strain-stiffening, crease at a uniaxial plane-strain of 0.35.1,2 This behavior has been validated by experimental observation in several soft materials.2,10 Crease onset occurs at the same strain value, regardless of the material's shear modulus, μ. To our knowledge, most creasing experiments are performed with constant composition materials, i.e., constant modulus, with one notable exception finding a dependence of crease-onset-strain on cross-linker in polyacrylamide gels.10 These authors attributed this observation to possible variation in compressibility with changes in the gel composition; verification was left for future study. More recently however, Jin and Suo22 calculated that for a strain-stiffening Gent material,23 a larger strain is required to induce creasing for materials with earlier onset of strain-stiffening. This behavior is predicted to result in crease suppression for materials with early onset of strain-stiffening (Jlim = 3.1, where Jlim determines the onset of strain-stiffening and is the first strain invariant minus 3 evaluated at the limiting stretch state). The second key finding is that after creasing has occurred, crease density decreases with the increasing application of strain. Quantitative predictions of crease density, dependent on geometry,2,12,24 are based on energetic arguments comparing strain energy between finite element models of differing crease number or number density. Third, creasing behavior can be altered by surface energy, γ, which may act as an energy barrier similar to that found in nucleation theory. Chen et al.3 showed that creases, which nucleate from pre-existing defects then grow via channeling,9 can be induced to grow/channel further when surface energy is decreased. This phenomenon was shown to relate to a film-thickness-normalized elastocapillary number, γ/μt, where t is the thickness of the creased film. The results presented here validate and build upon each of these three findings for a spherical geometry.
Our observations of evaporating liquid droplets embedded within elastomeric solids of varying composition experimentally verify Jin and Suo's prediction of strain-stiffening governed crease onset. We also find, in agreement with the second characteristic described above, that increasing deformation leads to a decrease in crease density for neo-Hookean materials. However, this crease density dependence breaks down for strain-stiffening materials. We qualitatively describe this phenomena using finite element simulation of a cylindrical cavity (Fig. 1a). Further, we find that the morphology of surface creases is largely unaffected by decreased surface energy at large deformations, but near crease onset, surface energy plays a small role. For the macroscale cavities (∼1 mm) studied here, this suggests that at low strains an elastocapillary number, γ/μL, that uses crease size as L rather than system geometry (cavity size) is more appropriate in the deformation regime near crease onset.
This article is organized as follows. We outline the materials used and describe methods for sample fabrication and finite element simulation. Contraction of the liquid-filled cavity in the breathing mode,12 during which the cavity remains spherical, is modeled using mass transport. Dependence of cavity deformation at the onset of creasing is demonstrated to have quantitative agreement with Jin and Suo22's predictions via independent characterization of the elastomer's constitutive behavior. We then show results for crease morphology evolution as a function of decreasing cavity volume, drawing parallels with a simulated cylindrical geometry. All creasing results are interpreted assuming a biaxial compressive state at the liquid/cavity interface as in Cai et al.12 We show evidence for a small surface energy dependence of crease morphology near onset. Finally, we touch on cavitation of the embedded liquid droplet.
2 Methods
2.1 Cavity sample fabrication and testing
Embedded-water-droplet samples are created using polydimethylsiloxane elastomer base and curing agent (Sylgard 184, Dow Corning). Four different base-to-curing agent weight ratios are used: 10:1, 12:1, 17.5:1, and 25:1. After thorough mixing, the uncured polymer is degassed then poured between four supported poly-methylmethacrylate (PMMA) sheets. The PMMA provides an undistorted exterior surface for viewing upon release. 10 μL of reverse osmosis water (Millipore) is pipetted into the bottom of the uncured PDMS. The mold is cured at 80 °C for 75 minutes. During curing, buoyant forces drive the water droplet into the middle of the sample. The same technique is used to embed surfactant droplets within PDMS. We use surfactant 3-[hydro(polyethyleneoxy)propyl] heptamethyltrisiloxane (Gelest) at a concentration of 0.5 mg mL−1.
Upon curing, samples are placed either in front of the camera for observation or in a sealed container containing an open water source. During observation, a hotplate maintains a temperature of 60 °C via constant heat output (Fig. 2a). Images are taken at 30 minute intervals over the course of evaporation (∼3 days) until cavitation occurs. Radii are determined using ImageJ. Images of post-creased droplets are characterized manually, using Matlab to record data (ESI†).
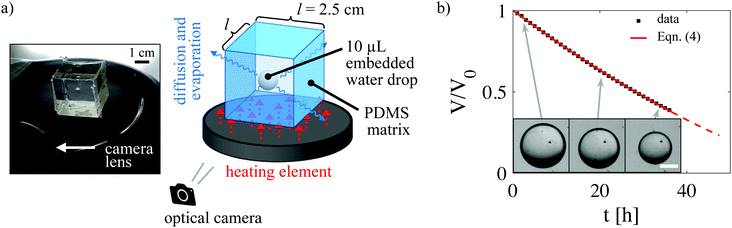 |
| | Fig. 2 Droplet evaporation. (a) A photograph of the experimental setup for scale (left) and a schematic (right) showing the 2.5 cm cubic elastomer with embedded droplet. The heating element increases evaporative flux. (b) Modeling of breathing mode deformation dynamics using quasi-steady state diffusive transport (red line, eqn (4)). The scale bar in the inset images is 1 mm. | |
2.2 Compression sample fabrication and testing
Compression samples are obtained using cylindrical aluminum molds under curing conditions identical to those above. Two molds are used to mitigate issues of barreling and stability during testing: 12.7 diameter, 15.88 mm height (10:1 and 12:1 mixing ratios) and 20.05 mm diameter, 19.05 mm height (17.5:1 and 25:1). Two testing conditions were used: room temperature and after overnight immersion in a 60 °C water bath. The results are compared in Table S1, ESI.† A test stand (Mark-10 ESM 301) displaces the cylindrical specimens at an engineering strain rate of 10−3 s−1 while acquiring loading data. Silicon grease reduces friction at the loading platens.
2.3 Finite element simulation
The finite element software, ABAQUS, was used to model creasing of a cylindrical cavity of radius A in a cylindrical solid of radius B = 10A under plane-strain conditions. Creases were initiated by the addition of a small defect on one of the periodic boundaries2,7,22 with the number of creases present, N, being set by modeling a radial section of the cylinder with periodic boundaries on the section edges. The depth of the defect is 1/100th the cavity radius (see ESI†). The angle of inclusion within the section is given by 180°/N. The mesh is refined around the defect so that element size is approximately 1/100th the size of defect (see ESI† for further detail.) The outer cylinder surface is traction free and a negative pressure load is applied to the inner surface. The material is incompressible and follows either the built-in neo-Hookean, hyperelastic material model or Jin and Suo's user-defined subroutine (UMAT) implementation of the Gent model.22
3 Results and discussion
As the droplet within the PDMS evaporates, the spherical cavity within the polymer contracts (Fig. 1), eventually forming creases at the surface if deformation surpasses critical strain criteria. The cohesive strength and surface energy of water enable the cavity's quasi-static collapse. In most cases, after creasing occurs the water droplet cavitates, allowing the elastomer to relax to an unloaded state. We document the breathing and creasing behavior optically and describe them using mass transport,25 continuum mechanics,12,22 and energetic models.2,3 In particular, we draw upon recent theory predicting the effect of strain-stiffening on creasing.22
3.1 Evaporation during breathing mode
During breathing mode deformation, the cavity volume decreases while maintaining the cavity's spherical shape [inset, Fig. 2b]. Following Rice and Do's25 solution for the diffusive loss of mass from a sphere in an infinite, stagnant medium, changes in the water droplet are predicted using a mass balance at the droplet surface. For water having density ρW comprising a droplet of radius a, a mass balance yields| |  | (1) |
where the diffusive flux at the droplet surface, N|r=a, is given by Fick's Law,| |  | (2) |
Here DWP is the diffusivity of water through the polymer and C is the mass concentration of water such that C*/ρ is the mass fraction of water at the fluid–solid interface. An approximate solution to this expression arises from the assumption of quasi-steady state in the water concentration profile as determined by| |  | (3) |
The solution to this differential equation is| |  | (4) |
where the solubility factor, S, which accounts for initial and boundary conditions, is given by S = (C* − C0)/[ρW(1 − C*/ρ)].25 Initially, water concentration within the polymer is taken to be a uniform value, C0, and the droplet has an initial radius, A. Boundary conditions are: (1) fixed concentration C* at the droplet surface, as determined by solubility of water in Sylgard 184 (C*/ρ = 7.5 × 10⁻⁴ from Randall and Doyle26) and (2) fixed concentration far from the droplet surface, C0, for which we use literature values of water solubility in Sylgard 184 (C0/ρ = 2.6 × 10⁻⁵ from Harley et al.,27 relative humidity: 40%, Henry's law constant: 0.082 cm3 STP per g at 60 °C). Given the low solubility of water in Sylgard, the density ρ, is approximated as that of Sylgard 965 kg m−3 as per manufacturer data.
The droplet dynamics modeled by eqn (4) accurately describe the breathing mode deformation observed experimentally. Radii extracted from time-lapse images of the droplet are fit using a solubility value of S = 7.1 × 10⁻⁴ (as described above) keeping A and DWP as fitting parameters. Fig. 2b shows a representative fit converted to normalized droplet volume versus time, V/V0 = (a/A)3. Fitted values for A differ less than 0.15 ± 0.3% from initial radius values taken from final, unloaded cavities, illustrating consistency between the fit and experiments. Diffusivity did not show a trend as a function of mixing ratio; the mean diffusivity across all samples was 4.9× 10⁻⁹ ± 1.3 × 10⁻⁹ m2 s−1, within the range of previously measured values.26,28 Given the close description of the change in droplet size viaeqn (4) we use an extrapolation of this fit in order to calculate the magnitude of applied deformation, i.e., decrease in cavity volume, to creased cavities that can no longer be assumed to be spherical.
3.2 Crease onset
After a period of breathing mode deformation, creases begin to form at the cavity-liquid interface.‡Fig. 3 illustrates the evolution of this crease-governed deformation over time due to water evaporation. Cavity volume lost, V0 − V, taken to be proportional to the droplet mass under the assumption of incompressibility, is determined through extrapolation of the fit described in the previous section. Fig. 3 compares morphology across mixing ratios, but at identical normalized cavity volume changes, (V0 − V)/V0 = 1 − V/V0. In the higher mixing ratio samples (17.5:1, 25:1), the morphology of crease onset is generally characterized by many short creases. In contrast, for the lower mixing ratio samples (10:1, 12:1), one or two longer creases are present near onset. After significant water loss (1 − V/V0 > 0.8), the cavities become highly deformed and the number of creases becomes similar across all mixing ratios. Both crease onset and evolution compare favorably with modified plane-strain theories for crease formation and behavior as we will discuss.
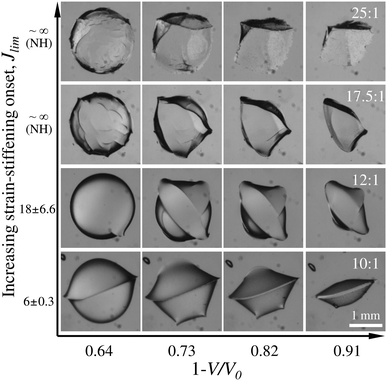 |
| | Fig. 3 Cavity morphology evolution for varying elastomer composition. Bottom row: Stiffest, earliest strain-stiffening onset (10:1 mixing ratio), Top row: Softest, approximately neo-Hookean behavior (25:1). Images along each row correspond to normalized cavity volume losses (1 − V/V0) ranging from 0.64 to 0.91. The axes of abscissas relates to time as determined in Section 3.1. | |
For an incompressible neo-Hookean material, creasing has been predicted1 and observed10,29 to occur under a uniaxial plane strain of ε = 0.354, independent of modulus. Following the parallel made by Cai et al.12 between uniaxial plane strain and deformation at the surface of a spherical cavity,12 we relate the uniaxial strain, ε to the cavity stretch ratio, a/A, as
| |  | (5) |
(Appendix A). The predicted cavity stretch ratio for crease onset,
a/
A|
c = 0.75, resulting from this relation fails to capture the composition dependence of crease onset shown in
Fig. 4 (dashed line).
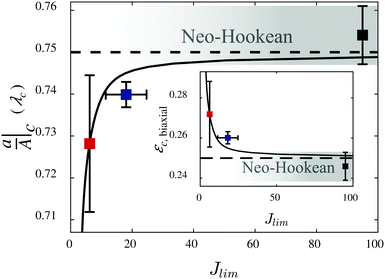 |
| | Fig. 4 Verification of delayed crease onset due to early onset of strain-stiffening as quantified by Jlim. The y-axis is the normalized cavity radius, a/A, at crease onset, which is equivalent to the critical biaxial stretch ratio at the cavity surface, λc. Red, blue, and black symbols correspond to mixing ratios of 10:1, 12:1, and combined 17.5:1 and 25:1 data, respectively. Error bars are the standard deviation from four or more samples. The black curve corresponds to Gent model creasing onset predicted by Jin and Suo,22 modified for a spherical geometry using eqn (5). The dashed curve represents crease onset for neo-Hookean behavior. For measured values of Jlim > ∼40 strain stiffening occurs at such a high stretch that the behavior is indistinguishable from neo-Hookean behavior, as depicted in the gradient region. Inset: Results re-plotted as critical biaxial strain, εc, versus Jlim. | |
Mixing ratio is often oversimplified to a change in linear shear modulus, μ, for Sylgard 184 under the assumption of neo-Hookean behavior at all compositions.30,31 However, changes in modulus for a neo-Hookean solid would have no effect on crease onset or morphology,1 failing to describe the composition dependence we observe in Fig. 3. We show that this composition dependence is primarily due to strain-stiffening, in validation of Jin and Suo's predictions.22 These results illustrate the importance of accounting for material constitutive behavior in creasing systems.
3.2.1 Strain-stiffening material behavior.
Validating Jin and Suo's22 predictions requires evaluation of each composition as a strain-stiffening, Gent hyperelastic solid.23 The strain energy function for the Gent model is given by| | 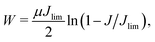 | (6) |
where μ is the small strain shear modulus, J = I − 3 (I is the first strain invariant of the Cauchy–Green strain tensor), and Jlim determines the stretch value at which the strain energy asymptotes to infinity. We experimentally determine Jlim from uniaxial compression tests as shown in Fig. 5a. True stress (assuming incompressibility) under uniaxial load, σ, and stretch, λu = l/L (Fig. 5a), data are fit to the Gent hyperelastic model under uniaxial loading:| | 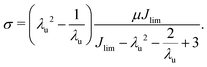 | (7) |
Four representative compression curves and their corresponding fits are shown in Fig. 5a. For the lowest mixing ratios (10:1 and 12:1), Fig. 5 illustrates the improved fit of the Gent model (solid lines) in comparison to a neo-Hookean model fit using the low stretch response (thin dashed lines). For the largest mixing ratios used (17.5:1 and 25:1), behavior is indistinguishable from neo-Hookean within the limitations of this testing geometry. Resulting fit parameters μ and Jlim, plotted in Fig. 5b, quantify the increase in Jlim with increasing mixing ratio. Characterization under two environmental conditions, hydrated at 60 °C and room temperature (Table S1, ESI†), revealed a weak dependence of Jlim and a moderate dependence of μ on environment. We conclude from these findings that gradients in either temperature or water concentration within the polymer have negligible effect on Jlim and therefore no effect on the interpretation to follow.
 |
| | Fig. 5 Strain-stiffening material behavior of hydrated Sylgard 184 at 60 °C. (a) Selected uniaxial compression curves for 10:1 (red diamonds), 12:1 (blue circles), 17.5:1 (green squares), and 25:1 (orange ×'s) mixing ratios. Gent model (eqn (7)) fits are given with solid lines. Black, dashed curves denote neo-Hookean fits to the initial loading data (0.9 ≤ λu ≤ 1). (b) Gent model fit parameters, Jlim and μ determined from (a). Jlim and experimentally determined crease onset values comprise the experimental data in Fig. 4. | |
3.2.2 Effect of strain-stiffening on crease onset.
Jin and Suo22 predict that decreased Jlim delays the onset of creasing for a plane strain geometry. Numerical interpolation of these predictions yields a relation between Jlim and the critical strain, εc. (ESI,† eqn (S1) is used for interpolation.) The latter is converted to a critical radius a/A|c using eqn (5). The resulting prediction of a/A|c as a function of Jlim (solid black line, Fig. 4) describes the experimentally-measured dependence of crease onset on experimentally-determined Jlim well, with no fitting parameters. Notably, the measured Jlim of the 10:1 ratio falls near the asymptotic region (Jlim = 3.1) and the scatter in the crease onset measurements reflect this behavior.
3.3 Crease morphology and evolution
We find that differences in crease morphology are primarily due to the strain-stiffening material response. As summarized at the beginning of Section 3.2 and illustrated in Fig. 3, the number of creases near onset increases with increased mixing ratio. We observe that lower modulus, neo-Hookean samples (17.5:1 and 25:1) initially produce short creases distributed across the cavity surface (Fig. 3, top two rows). Conversely, high modulus, strain-stiffening samples (12:1 and 10:1) crease in one to three locations (Fig. 3, bottom two rows). All compositions tend toward similar creased shape at greater losses of cavity volume, 1 − V/V0. However, the mechanism by which these final shapes form differs with composition as well. The short initial creases join together as they increase in density (with only small increases in length), eventually giving rise to a few creases that nearly span the cavity's surface. The fewer, longer creases channel across the cavity's surface (Fig. 3, bottom two rows). (Time-lapse videos illustrating these dynamics for each composition are available in the ESI.†) The plots in Fig. 6 quantify this morphology variation with sample composition. Data is obtained via human-eye, automated in Matlab; each crease is digitally traced on one half of the cavity (ESI†). We note that this quantification technique fails to account exactly for increases in length due to surface curvature and encounters difficulty in resolving the smallest creases near crease onset. The former issue will not change our results as the error in using the 2-D projection is expected to be on the order of 2/π − 1 ≈ 40%, whereas the scatter in our length data is on the order of 100%. The latter issue only applies to the first 1 − V/V0 value. This data is essential to performing a comparison with simulated crease morphologies.
 |
| | Fig. 6 Quantified crease morphology evolution. Quantities are plotted as a function of normalized cavity volume loss (1 − V/V0) and overstrain as calculated using the average of the experimentally observed point of crease onset. Each curve corresponds to an averaging across five or more cavity deformations. Total crease length, (a and d), is the sum of all measured crease lengths. Average crease length, (b and e) is determined on a per cavity basis before averaging across droplets. Number of creases, (c and f), is a simple counting of the number of crease lengths measured. Crease measurements are extrapolated to the entire cavity surface based on measurements of half of the surface. Data is given for the following mixing ratios: 10:1 (red diamonds), 12:1 (blue circles), 17.5:1 (green squares), and 25:1 (orange ×'s). The right column, (d–f), includes crease data for a surfactant droplet within a 25:1 mixing ratio elastomer and illustrates the minimal influence of decreased surface energy at low overstrain. | |
A trend toward decreasing number of creases (decreased density) accompanying an increase in applied strain has been both predicted12 and observed2,12 for cylindrical and planar geometries in neo-Hookean materials. A similar trend is followed in the spherical geometry characterized here for the low modulus, neo-Hookean materials as shown in Fig. 6c. In contrast, strain-stiffening elastomers initiate few creases at low applied deformation and those creases channel across the surface with increasing deformation. Visually, the strain-stiffening creases appear deeper than those in the neo-Hookean materials. This supposition is supported by the observation that the total length of all creases combined is lower in strain-stiffening solids versus neo-Hookean solids under the same deformation, 1 − V/V0 (Fig. 6a). The strain must be accommodated through increased crease depth. To compare ‘near-onset’ effects we use an overstrain term, Vc/V0 − V/V0, similar to that in Chen et al.3 (Fig. 6e and f). Doing so, we observe that creases in 25:1 samples initiate approximately ten times more frequently with around one tenth the length of creases in 10:1 samples (Fig. 6e and f). The mechanism leading to these crease morphology changes with increasing strain-stiffening will be explained through a combination of existing models of crease evolution.
3.3.1 Crease spacing in Gent and neo-Hookean materials.
Finite element analysis has been used previously to predict crease onset and model crease morphology in planar1,2 and radially symmetric geometries.7,12 Here, we show qualitative similarity between the energetically preferred number of creases in a simulated cylindrical cavity and our experimental observations as a function of material behavior. These calculations provide evidence that the observed morphological variation is primarily due to the material's strain-stiffening response.
We performed finite element simulations of cylindrical cavities in ABAQUS using neo-Hookean and Gent22 constitutive models in order to calculate strain energy. This cylindrical cavity approximation provides a qualitative description of the observed phenomena while avoiding complexity associated with fully three-dimensional crease simulation8,32 or the selection of experimentally inapplicable boundary conditions associated with a planar simulation (ratio of film width to height). The energetically preferred number of creases is determined by finding the minimum strain energy among simulations containing periodically-spaced numbers of creases ranging from 2 to 10. Creases are initiated at small geometric defects. Following Cai et al.,2,12 the strain energy per unit thickness of the creased state relative to a homogeneously deformed uncreased state undergoing the same outer surface displacement (eqn (7)) takes the form
where
A in this case refers to the initial cylindrical cavity radius and
S is the cylindrical cavity's area.
f(
S) is obtained from subtracting the analytically obtained strain energy of homogeneous deformation (Appendix B) from the strain energy calculated in ABAQUS.
Fig. 7a compares
f(
S) between a neo-Hookean and Gent material behavior (
Jlim = 5) plotted as a function of the cylindrical overstrain,
i.e., the departure from the area at which crease onset occurs,
Sc −
S. Neo-Hookean results agree qualitatively with earlier simulations by Cai
et al.12 (who used a different ratio of outer to inner boundary radii). Gent curves are cut-off at high overstrains due to an exponential increase in the homogeneous strain energy as the limiting stretch is approached; this leads to imaginary values of Δ
Π at overstrains available to the creased state, but unavailable to the homogeneous state. The inset in
Fig. 7a illustrates an energetic preference for the maximum number of creases simulated in neo-Hookean materials (purple inverted-triangle, solid line). In contrast, for a Gent material having
Jlim = 5, the preferred number of creases is two just after onset. Note that in order to construct this comparison, the strain energy at crease onset is set to zero
via| | 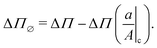 | (9) |
Crease onset in the cylindrical geometry is determined using previously calculated critical strains for plane strain
1,22 (
eqn (3)), following Cai
et al.12 (Appendix A). Without performing this zeroing operation, small numerical errors due to the presence of an initial defect lead to crease-number-related error near crease onset. This numerical error originates prior to creasing due to the presence of the defect and becomes similar in magnitude to free energy differences just after crease onset. This numerical variation would be eliminated for an infinitesimally small initial defect. (ESI,
† Fig. S6 demonstrates the trend toward zero Δ
Π at crease onset for decreasing defect size.)
Fig. 7b summarizes the preferred number of creases among those values simulated (2, 3, 5, 7, 10) for a neo-Hookean solid (black squares), Gent material with
Jlim = 10 (blue circles), and Gent materials with
Jlim = 5. In agreement with experimental observation of spherical cavities, materials initiate creasing with fewer number of creases the earlier onset of strain-stiffening occurs,
i.e., lower
Jlim. This result is visualized in
Fig. 8. Given the lengthy deformation zone in which the maximum number of creases simulated is energetically preferred for the neo-Hookean solid, we believe an energetic minimum likely occurs at an even larger number of creases.
 |
| | Fig. 7 Simulated results for crease number trends for a cylindrical tube. (a) f(S − Sc) from eqn (8) and (9) as a function of normalized cylindrical overstrain, Sc/S0 − S/S0 where S0 = πA2, for neo-Hookean (solid lines) and Gent (Jlim = 5, dotted lines) material behaviors. The inset illustrates that near crease onset, Sc − S = 0, a free energetic preference for the largest number of creases simulated (10) exists for a neo-Hookean response. This is in opposition to a preference for the fewest number of creases simulated (2) for the Jlim = 5 response. At high overstrain, both behaviors prefer the fewest number of creases. (b) The progression of free energetically-preferred crease number among those simulated for neo-Hookean (black squares), Jlim = 10 (blue circles), and Jlim = 5 (red triangles). These trends for the cylindrical geometry match those observed in spherical cavities (Fig. 3 and 6). | |
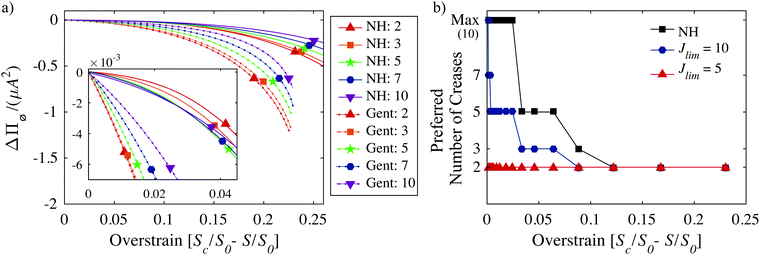
 |
| | Fig. 8 Cavities in neo-Hookean (top row), Jlim = 10 (middle row), and Jlim = 5 (bottom row) materials undergoing increasing deformation. Strain energy density contours are plotted for energetically-preferred crease number at each overstrain value. | |
3.3.2 Limited role of surface energy.
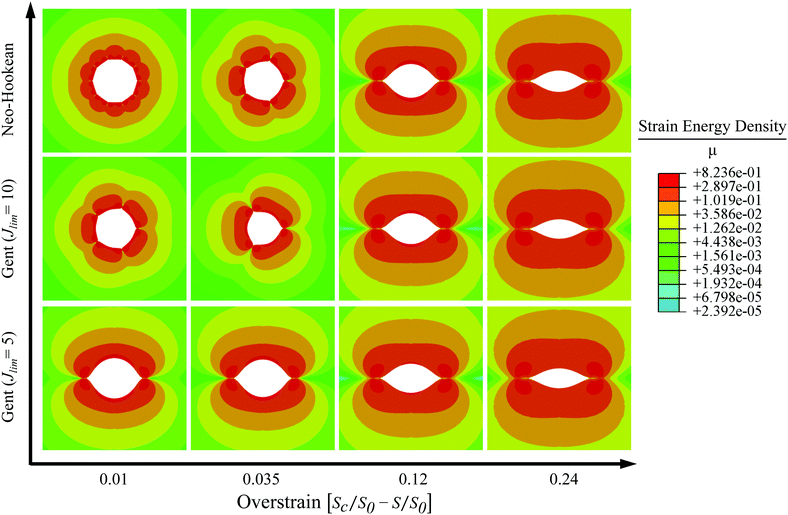
Crease growth via channeling has been previously shown to arrest or propagate based on elastocapillary control.3 Low elastocapillary numbers, γ/μL, and therefore creases that more readily channel are achieved with either high moduli or low surface energies. Estimation of the elastocapillary number for this system, where the relevant length scale L is taken to be the initial cavity radius, A = 1.5 mm, yields a range from 4.1 × 10⁻⁵ (10:1) to 3.7 × 10⁻⁴ (25:1). Within this regime, surface energy should play a negligible role and surface energy should provide no barrier to channeling. However, we observe little channeling in the softest compositions. Even an order of magnitude change in surface energy should have no effect. To test the assumption that initial cavity radius, A, was the appropriate length scale, we changed the surface energy while keeping composition constant, similar to Chen et al.3
Liquid drops embedded in 25:1 Sylgard were altered through the addition of the surfactant 3-[hydro(polyethyleneoxy) propyl] heptamethyltrisiloxane (Gelest) above its critical micelle concentration.§33 Interestingly, as reported by Chen et al.,3 creases formed under the effect of surfactant channeled further than those in non-surfactant cavities at low overstrain (Fig. 6e, f and Fig. 9). The morphology of these 25:1/surfactant systems more closely resembles that in the 10:1 and 12:1 mixing ratios immediately after crease onset. To understand this effect, we estimate the elastocapillary length scales for 25:1/water, 25:1/surfactant, and 10:1/water as 550 nm, 6.5 nm, and 61 nm, respectively (μ10:1 = 0.65 ± 0.04 MPa, μ25:1 = 0.073 ± 0.004 MPa, γH2O = 40 mN m−1, γsurf = 0.5 mN m−3). It appears that this length scale in the surfactant cavity approaches that of the 10:1/water system, mirroring the approach of surfactant cavity morphology to that of the 10:1 cavity.¶ This result indicates that crease size, as opposed to system geometry, may be the governing length scale for calculation of the elastocapillary number in the initial stages of creasing. Using previously determined experimental values for the crease depth (d ∼ 20 μm from Cai et al.2) as estimate for the length scale, L, the elastocapillary numbers for 25:1/water, 25:1/surfactant, and 10:1/water systems are 0.07, 9 × 10⁻⁴, and 5 × 10⁻³, respectively. The elastocapillary number for the 25:1/water system is within the range reported by Chen et al.3 as having elastocapillary governed channeling. Therefore, while surface energy does not predominately account for the morphology differences observed here, it is interesting to note its role in a system for which it would typically be considered negligible.
 |
| | Fig. 9 Surface energy effects. The reduction of surface energy due to the addition of surfactant (middle row) within droplets embedded in low modulus materials (middle and bottom rows) enabled more channeling, similar to the highest modulus, strain-stiffening materials (top row). Columns compare cavity deformation at identical values of overstrain. | |
3.4 Cavitation and surface ‘bubble’ formation
All cavities expand to an unloaded state upon cavitation of the embedded liquid. Upon cavitation, the sudden release of load at the cavity surface is accompanied by rapid oscillatory deformation (see Video in ESI†) until the final unloaded state is reached. We observe a higher proportion of cavities achieving large, creased deformation in the lower modulus formulations as opposed to the highest modulus formulation (Table S2, ESI†). The reason for early onset of cavitation in the stiffest mixing ratio (10:1) is likely that for the same loss of droplet volume, a stiffer material will produce a higher hydrostatic tension in the droplet. This higher tension leads to a higher probability of cavitation.34 A few, statistically insignificant, cavities within the softest formulation (25:1) cavitated early. The reason for this remains unclear, though it may be due to the increased number of creases or silicone ‘microbubbles’ (see next paragraph) in those cavities that lead to more sites for heterogeneous nucleation. The cavitation behavior of this system is left for future study.
Another phenomena observed during cavity contraction is the formation of ‘microbubbles’ at the PDMS-water interface (Fig. S4, ESI†). These structures grow in size as deformation increases, eventually appearing to coalesce, and are more prominent in the stiffer elastomer formulations. Such microbubbles would lead to cavitation if they were water vapor or would require any gas within them to be under tension if they were air. We therefore suggest that they might be formed from squeezing small volumes of un-crosslinked silicone35 out of the bulk of the PDMS. Similarly, silicone nanobubbles have been observed to coalesce in PDMS-water mixtures.36 Given our primarily continuum mechanics, negligible surface energy description of the observed creasing phenomena, these fluid bubbles are expected to have minimal effect on the results reported herein.
4 Conclusions
We observe the contraction, creasing, and cavitation of a liquid-filled spherical cavity within an elastomer. Deformation is driven by evaporation. For elastomer compositions that exhibit strain-stiffening as modeled by the Gent relation, the onset of creasing follows recent theoretical predictions, namely that strain-stiffening at lower stretch values increases the compressive strain required to initiate creasing. After crease onset, increasing deformation is quantified by extrapolating the results of a diffusive mass transport model for the liquid within the cavity. This assumption establishes a basis of cavity volume with which to compare crease morphologies between compositions. We then qualitatively describe differences in the time-evolution of crease morphology by drawing a parallel with plane strain creasing of a simulated cylindrical cavity. In both simulation and experiment:
• The deformation at which crease onset occurs depends on strain-stiffening.
• Neo-Hookean solids have an energetic preference for many creases near crease onset.
• The number of creases near onset decreases with decreasing Jlim. (In the Gent model, Jlim characterizes strain at onset of stiffening.)
• All material behaviors tend toward similar crease numbers at large overstrain.
These results experimentally validate the important role that strain-stiffening plays in determining crease morphology in this contracting cavity system. It follows that strain-stiffening may be a critical consideration in predicting biologically relevant crease morphologies in other geometries.7,8,13
Conflicts of interest
There are no conflicts to declare.
Appendix
A Crease onset
The critical condition for the onset of creasing in a planar sample under plane strain conditions is calculated by Hong et al.1 who wrote it more generally as| |  | (A1) |
where εc refers to the critical strain value, λ1 is the stretch parallel to the applied deformation and λ3 is the stretch perpendicular to the applied deformation. In a spherical geometry the principal circumferential stretches are given by λ1 = λ2 = r/R. r and R are the deformed and undeformed coordinates within the material. For an incompressible solid, λ1λ2λ3 = 1, then λ3 = (R/r)2. At the surface of the cavity, r = a and R = A. Applying these definitions of stretch to (A1), a/A at crease onset is given by| |  | (A2) |
Similarly, in a cylindrical geometry under plane strain conditions, the principal stretches are λ1 = r/R, the circumferential stretch, λ2 = 1, the longitudinal stretch, and λ3 = R/r, the radial stretch. Following the same procedure as above, a/A at crease onset in the cylindrical geometry is
| |  | (A3) |
B Homogeneous cylinder deformation
The strain energy per unit thickness associated with the homogeneous contraction of a cylindrical cavity of initial inner radius, A, within a cylinder having outer radius, B is determined by integrating the strain energy density, W, over the entire solid region.| |  | (B1) |
where a is the deformed cavity radius, b is the deformed outer radius, and r and θ define the deformed coordinate system within the solid. Under the assumptions of incompressibility and plane strain (λz = 1), the area within any annulus of undeformed material R2 − A2 must equal the area within that deformed annulus, r2 − a2.When the radii of the initial and deformed void are known, the field of deformation is determined by this equality. The circumferential stretch, λθ isHere we introduce a dimensionless stretch parameter, λ. Incompressibility relates λrλθλz = λrλθ = 1 such thatFor the strain energy density as a function of J, J can then be writtenUsing eqn (2), r can be re-written as a function of λ,| | | r = (a2 − A2)1/2(1 − λ−2)−1/2. | (B6) |
Re-expressing the strain energy integral in eqn (B1) in terms of λ, substituting eqn (B5) for J, and integrating over θ yields.| |  | (B7) |
Eqn (B7) is solved analytically for a neo-Hookean strain energy function and numerically for the Gent strain energy function (eqn (6)).
Acknowledgements
The authors would like to acknowledge Shenqiang Cai for his helpful insight of creasing behavior and Abe Stroock for his thoughtful suggestions relating to fluids under tension. The authors also thank the reviewers for their constructive feedback. Matt and Shelby acknowledge start-up funding provided by the Mechanical Science and Engineering Department at UIUC. Lihua acknowledges the startup fund from the Henry Samueli School of Engineering and Applied Science at UCLA.
References
- W. Hong, X. Zhao and Z. Suo, Appl. Phys. Lett., 2009, 95, 111901 CrossRef.
- S. Cai, D. Chen, Z. Suo and R. C. Hayward, Soft Matter, 2012, 8, 1301 RSC.
- D. Chen, S. Cai, Z. Suo and R. C. Hayward, Phys. Rev. Lett., 2012, 109, 038001 CrossRef PubMed.
- E. P. Chan, J. M. Karp and R. S. Langer, J. Polym. Sci., Part B: Polym. Phys., 2011, 49, 40–44 CrossRef CAS PubMed.
- J. Yoon, P. Bian, J. Kim, T. J. McCarthy and R. C. Hayward, Angew. Chem., Int. Ed., 2012, 51, 7146–7149 CrossRef CAS PubMed.
- P. Shivapooja, Q. Wang, B. Orihuela, D. Rittschof, G. P. López and X. Zhao, Adv. Mater., 2013, 25, 1430–1434 CrossRef CAS PubMed.
- L. Jin, S. Cai and Z. Suo, EPL, 2011, 95, 64002 CrossRef.
- T. Tallinen, J. Y. Chung, F. Rousseau, N. Girard, J. Lefèvre and L. Mahadevan, Nat. Phys., 2016, 12, 588–593 CrossRef CAS.
- J. Yoon, J. Kim and R. C. Hayward, Soft Matter, 2010, 6, 5807 RSC.
- V. Trujillo, J. Kim and R. C. Hayward, Soft Matter, 2008, 4, 564 RSC.
- X. Liang, F. Tao and S. Cai, Soft Matter, 2016, 12, 7726–7730 RSC.
- S. Cai, K. Bertoldi, H. Wang and Z. Suo, Soft Matter, 2010, 6, 5770 RSC.
- J. Tomac, D. Cekinovć and J. Arapović, Period. Biol., 2011, 113, 43–49 Search PubMed.
- C. Llorens, M. Argentina, N. Rojas, J. Westbrook, J. Dumais and X. Noblin, J. R. Soc., Interface, 2016, 13, 20150930 CrossRef CAS PubMed.
-
J. Dumais and Y. Forterre, “Vegetable Dynamicks”: The Role of Water in Plant Movements, 2012 Search PubMed.
- E. Reyssat and L. Mahadevan, J. R. Soc., Interface, 2009, 6, 951–957 CrossRef CAS PubMed.
- S. Lee, J. Prosser, P. Purohit and D. Lee, ACS Macro Lett., 2013, 2, 960–965 CrossRef CAS.
- X. Noblin, S. Yang and J. Dumais, J. Exp. Biol., 2009, 212, 2835–2843 CrossRef PubMed.
- P. T. Martone, M. Boiler, I. Burgert, J. Dumais, J. Edwards, K. MacH, N. Rowe, M. Rueggeberg, R. Seidel and T. Speck, Integr. Comp. Biol., 2010, 50, 888–907 CrossRef PubMed.
- X. Noblin, N. O. Rojas, J. Westbrook, C. Llorens, M. Argentina and J. Dumais, Science, 2012, 335, 1322 CrossRef CAS PubMed.
- Y. Cao and J. W. Hutchinson, Proc. R. Soc. A, 2012, 468, 94–115 CrossRef.
- L. Jin and Z. Suo, J. Mech. Phys. Solids, 2015, 74, 68–79 CrossRef.
- A. N. Gent, Rubber Chem. Technol., 1996, 69, 59–61 CrossRef CAS.
- X. Liang and S. Cai, Appl. Phys. Lett., 2015, 106, 041907 CrossRef.
- R. Rice and D. Do, Chem. Eng. Sci., 2006, 61, 775–778 CrossRef CAS.
- G. C. Randall and P. S. Doyle, Proc. Natl. Acad. Sci. U. S. A., 2005, 102, 10813–10818 CrossRef CAS PubMed.
- S. J. Harley, E. A. Glascoe and R. S. Maxwell, J. Phys. Chem. B, 2012, 116, 14183–14190 CrossRef CAS PubMed.
- J. M. Watson and M. G. Baron, J. Membr. Sci., 1995, 106, 259–268 CrossRef CAS.
- A. N. Gent and I. S. Cho, Rubber Chem. Technol., 1999, 72, 253–262 CrossRef CAS.
- R. N. Palchesko, L. Zhang, Y. Sun and A. W. Feinberg, PLoS One, 2012, 7, e51499 CAS.
- I. D. Johnston, D. K. McCluskey, C. K. L. Tan and M. C. Tracey, J. Micromech. Microeng., 2014, 24, 035017 CrossRef.
- T. Tallinen, J. S. Biggins and L. Mahadevan, Phys. Rev. Lett., 2013, 110, 1–5 CrossRef PubMed.
-
D. Chen, Doctoral dissertation, University of Massachusetts, Amherst, 2014.
- T. D. Wheeler and A. D. Stroock, Nature, 2008, 455, 208–212 CrossRef CAS PubMed.
- K. Sivasailam and C. Cohen, J. Rheol., 2000, 44, 897–915 CrossRef CAS.
- R. P. Berkelaar, E. Dietrich, G. A. M. Kip, E. S. Kooij, H. J. W. Zandvliet and D. Lohse, Soft Matter, 2014, 10, 4947 RSC.
Footnotes |
| † Electronic supplementary information (ESI) available. See DOI: 10.1039/c7sm01258f |
| ‡ Water within a few samples cavitated prior to crease onset, see ESI.† |
| § Concerns of surfactant migration into the uncured necessitated an increase in curing temperature and reduction in curing time, 150 °C and 10 min. As a control, pure water cavities in rapidly cured 25:1 polymer behaved identically to those created using the slower curing conditions reported above. |
| ¶ Large deformations in surfactant cavities were not observed, likely due to early cavitation facilitated by the presence of surfactant. |
|
| This journal is © The Royal Society of Chemistry 2017 |
Click here to see how this site uses Cookies. View our privacy policy here. 
 Open Access Article
 This Open Access Article is licensed under a
  a,
Lihua
Jin
a,
Lihua
Jin


