 Open Access Article
Creative Commons Attribution 3.0 Unported Licence
Evaporation of liquid droplets of nano- and micro-meter size as a function of molecular mass and intermolecular interactions: experiments and molecular dynamics simulations†
Robert
Hołyst
 *a,
Marek
Litniewski
a and
Daniel
Jakubczyk
b
aInstitute of Physical Chemistry of the Polish Academy of Sciences, Kasprzaka 44/52, 01-224 Warsaw, Poland. E-mail: rholyst@ichf.edu.pl; mlitniewski@ichf.edu.pl
bInstitute of Physics of the Polish Academy of Sciences, Al. Lotnikow 32-46, PL-02668, Warsaw, Poland
First published on 26th July 2017
Abstract
Transport of heat to the surface of a liquid is a limiting step in the evaporation of liquids into an inert gas. Molecular dynamics (MD) simulations of a two component Lennard-Jones (LJ) fluid revealed two modes of energy transport from a vapour to an interface of an evaporating droplet of liquid. Heat is transported according to the equation of temperature diffusion, far from the droplet of radius R. The heat flux, in this region, is proportional to temperature gradient and heat conductivity in the vapour. However at some distance from the interface, Aλ, (where λ is the mean free path in the gas), the temperature has a discontinuity and heat is transported ballistically i.e. by direct individual collisions of gas molecules with the interface. This ballistic transport reduces the heat flux (and consequently the mass flux) by the factor R/(R + Aλ) in comparison to the flux obtained from temperature diffusion. Thus it slows down the evaporation of droplets of sizes R ∼ Aλ and smaller (practically for sizes from 103 nm down to 1 nm). We analyzed parameter A as a function of interactions between molecules and their masses. The rescaled parameter, A(kBTb/ε11)1/2, is a linear function of the ratio of the molecular mass of the liquid molecules to the molecular mass of the gas molecules, m1/m2 (for a series of chemically similar compounds). Here ε11 is the interaction parameter between molecules in the liquid (proportional to the enthalpy of evaporation) and Tb is the temperature of the gas in the bulk. We tested the predictions of MD simulations in experiments performed on droplets of ethylene glycol, diethylene glycol, triethylene glycol and tetraethylene glycol. They were suspended in an electrodynamic trap and evaporated into dry nitrogen gas. A changes from ∼1 (for ethylene glycol) to approximately 10 (for tetraethylene glycol) and has the same dependence on molecular parameters as obtained for the LJ fluid in MD simulations. The value of x = A(kBTb/ε11)1/2 is of the order of 1 (for water x = 1.8, glycerol x = 1, ethylene glycol x = 0.4, tetraethylene glycol x = 2.1 evaporating into dry nitrogen at room temperature and for Lennard-Jones fluids x = 2 for m1/m2 = 1 and low temperature).
Introduction
An evaporation process occurs at the interface between liquid and gas in the region of nanometer size. This region is very hard to access in direct thermodynamic experiments and therefore profiles of thermodynamic parameters governing evaporation in the vicinity of the interface are not easily available from experiments.1,2 Computer simulations, on the other hand, give full information about evaporation in nano-sized systems, but unfortunately cannot be easily scaled to macroscopic systems studied in experiments.1 In this paper we combine molecular dynamics (MD) simulations in nano-meter size liquid–gas systems and experiments performed on micro-meter size droplets evaporating into inert gas to study evaporation. We obtain a simple formula for evolution of liquid droplet radius R(t) at time t, during evaporation as a function of thermodynamic and material parameters characterizing the system.Liquids evaporate into inert gas at the expense of internal energy of the gas. The heat transfer from the gas to the liquid is the limiting step in the process of evaporation. During evaporation the bulk temperature of the gas, Tb, is higher than the temperature of the evaporating liquid, Tliq. Far from the interface heat is transported towards the interface via temperature diffusion. Close to the interface temperature has a discontinuity (at the scale of mean free path in the gas phase). This effect was first measured by Ward and coworkers3–6 in water close to the triple point, where the mean free path was of the order of micro-meters. This effect was later observed in molecular dynamics simulations7 of Lennard-Jones molecules in small nanoscopic systems. Due to the temperature discontinuity heat is transported in a ballistic manner in this region. The ballistic transport modifies the standard formula for evaporation where only temperature diffusion is taken into account. In our previous paper8 we have established in experiments and MD simulations the following formula for liquid droplet radius R(t) as a function of time t during evaporation into inert gas:
 | (1) |
We performed computer simulations of a two-component Lennard-Jones system. Both components differed in mass and size. We performed MD simulations at a few temperatures in the gas phase. Additionally we re-analysed our previous experimental data8 for very small liquid droplets (i.e. comparable to Aλ) to obtain reliable values of A. For R ≫ Aλeqn (1) is not sensitive to the ballistic transport of energy, and therefore the experimental data should be fit separately for large and small R values. We get ΔT = Tb − Tliq from fits to eqn (1) at large R. Next we fix ΔT and fit A parameter at small R.
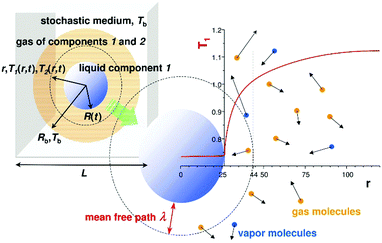
In the computer simulations component 2 played the role of inert gas and component 1 formed a liquid droplet. During evaporation component 1 also entered into the gas phase, but component 2 did not dissolve in the liquid phase. The temperature of the bulk gas was set between the critical temperatures of the components. The gas component was well above its critical point and the liquid phase was below its critical point. The liquid droplet maintained a constant temperature during evaporation, with Tliq being smaller than Tb. After a short initial transient state, the temperature profile T(r,t) was quasi-stationary i.e. it quickly adapted to the changes of the droplet radius R(t) at time t. Thus we had T(r,t) = T(r/R(t)) during the evaporation. A schematic drawing of our system is shown in Fig. 1.
The system studied using computer simulations mimicked the typical two-component systems studied by us experimentally i.e. evaporation of ethylene glycol, diethylene glycol, triethylene glycol and tetra-ethylene glycol into a dry nitrogen atmosphere. We combined our MD simulations and experimental studies of these four compounds to find A as a function of molecular parameters characterizing the molecules in the system.
Computer simulations
Molecular Dynamics (MD) simulations were performed using the Verlet “leapfrog” method9,10 to solve the Newton equations of motion that describe the time evolution of a two-component system composed of low volatile (the first component indexed by 1) and high volatile (the second component indexed by 2) molecules. The molecules of the same kind (ii = 11 or 22) interact via the short range Lennard-Jones (LJ) based potential given in the following form: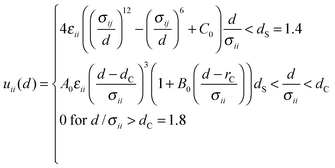 | (2) |
 | (3) |
Simulations of droplet evaporation were performed in the three dimensional sphere of radius Rb. The list of all simulation runs is given in Table S1 of the ESI.† A schematic picture of the system is shown in Fig. 1. The distance from the centre of the sphere is denoted by r. Initially, the sphere was filled with the gas of component 2 at density ρ2 = ρ02 and the liquid droplet that is composed of molecules of component 1 was placed with the centre of the mass at r = 0. Two systems were considered: the first of Rb = 340.6, ρ02 = 0.015, σ11 = 1.0 with the total number of particles N = 2.91 × 10⁶ and the second of Rb = 557.3, ρ02 = 0.0065, σ11 = 2.0, N = 4.91 × 10⁶. The number of molecules of component 1 was always N1 = 2.15 × 10⁵. The particles of component 2 were reflected elastically and specularly from the boundary of the sphere at r = Rb. The way the particles are reflected has no influence on the evaporation process. (Rb − R(t))/λ is many times larger than 1. As a consequence, the particle distribution function close to the liquid surface does not depend on the way the conditions at Rb are imposed. The boundary temperature Tb was imposed by appropriate scaling of velocities of molecules of component 2 for r > Rb − kσ22 where k = 3 to 5 depending on ρ02. The droplet volume was negligible if compared to the total volume of the system. Far from the droplet surface the density, ρ2, was constant and equal to the initial value, ρ02. To make simulation conditions closer to real ones the molecules of component 1 could go out as well as come back into the simulation sphere. For r > Rb the molecules of component 1 moved independently in stochastic gas (see Fig. 1) characterized by the temperature, Tb, and the self-diffusion constant,9D2. The stochastic medium was simulated introducing the Langevin force into the Verlet scheme (here with no 11 interaction). The random force was taken from the Euler–Maruyama approximation for the stochastic term.11 The approximation was used to generate random force to move molecules of component 1 at distances r > Rb. Also for r > Rb gas 2 was replaced by the Brownian gas. For r < Rb no random force was used and the time evolution was always performed using a classical MD method. Molecules of component 1 could cross (in both sides) the Rb border and spread all over the space as in real systems for which movement of particles 1 is not restricted (i.e. like for Rb → ∞).
The molecules of component 1 formed the droplet of radius R of the number liquid density, ρliq, and the liquid temperature, Tliq. The droplet radius, R, was defined via the total number density i.e. ρ(r = R) = ρliq/2. Based on additional simulations we estimated the critical temperature for the interactions given by eqn (2) to TC ≈ 0.65εii (ESI†). The pressure value as a function of r was calculated during simulations using the standard formula (ref. 9). In the simulations we considered only a quasi-stationary stage during which the droplet evaporated at constant temperature and density. The pressure maintained its value in the initial non-stationary regime (ref. 7). During the whole quasi-stationary stage (ref. 7, 8 and Supplementary Information to ref. 8) the pressure value was constant.
The liquid was under thermodynamic conditions well below its critical point while the gas of component 2 (ε22 = 1/4) formed an inert gas well above its corresponding TC. Such simulations correspond to the experimental case of evaporation of liquids (e.g. water) into the inert gas e.g. air. The values of κv in eqn (1) were determined from additional MD simulations (ESI†) applying the method of Muller-Plathe12 and Δh was calculated from the simulation data. As in our previous paper,8λ was estimated from
 | (4) |
Kinetic parameter A from computer simulations
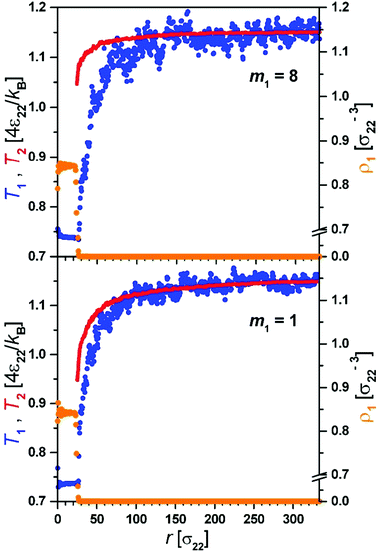
The evaporation process observed in simulations proceeds via an initial strongly non-equilibrium process characterized by the fast decrease of R, rapid decrease of Tliq and increase of ρliq.Thus initially the enthalpy needed for evaporation comes from the decrease of temperature of the droplet. This stage is very short. In the second quasi-stationary stage the temperature in the gas phase develops a profile adjusting to the change in the radius of the droplet R(t), T(r,t) = T(r/R(t)). At this stage of evaporation the temperature of the droplet, Tliq, was constant. During this process we observed (Fig. 2) that molecules of component 1 leaving the droplet–gas interface had markedly lower temperature than the temperature of the gas.
In order to determine A we solved eqn (1):
 | (5) |
 | (6) |
 | (7) |
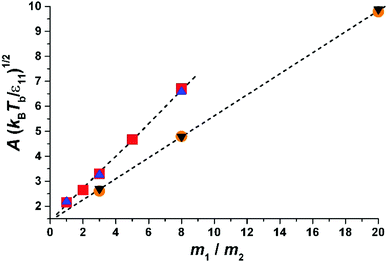 | ||
| Fig. 3 Parameter A as a function of the molecular mass of liquid divided by the mass of gas molecules, m1/m2. The results for two sizes of molecules are shown. The inclination decreases with the size of particle 1. The triangles-up (blue) – σ11 = 1.0, Tb = 1.05; the squares (red) – σ11 = 1.0, Tb = 1.15; the circles (orange) σ11 = 2, Tb = 1.05; the triangles down (black) σ11 = 2, Tb = 1.25. The dashed lines are obtained from fits to eqn (5) for a given σ11. We find (eqn (7)) α1 = 0.65 and α0 = 1.42 for σ11/σ22 = 1.0 and α1 = 0.42 and α0 = 1.40 for σ11/σ22 = 2.0. Thus α1 weakly decreases with an increase in the size of molecules forming a liquid, while α0 is a constant and probably depends on molecular shape (as we show in the Experimental section). | ||
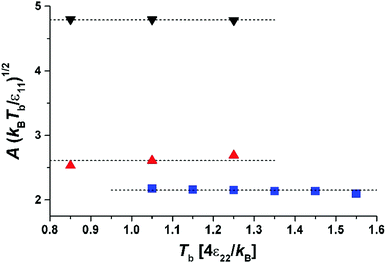 | ||
| Fig. 4 Parameter A versus temperature of the gas phase, Tb, for different masses and sizes of molecules: the squares (blue) – σ11 = 1, m1 = 1; the triangles up (red) – σ11 = 2, m1 = 3; the triangles down (black) – σ11 = 2, m1 = 8. The dotted lines are given by the fit to eqn (7). | ||
Experimental determination of parameter A
We have used previously obtained data8 on diethylene glycol and triethylene glycol and performed additional experiments on ethylene glycol and tetraethylene glycol.In the case of real molecules, the dependence of evaporation coefficient A on molecular parameters is not as straightforward as in computer simulations. In MD simulations we could independently change the masses, interaction parameters and sizes of spherical molecules and in this manner we find A as a function of each of these parameters separately. In real molecules their masses, sizes and interaction parameters are inter-dependent. Eqn (7) shows which of the molecular parameters most strongly influence the value of A. Here we further verify eqn (7) in experiments.
We estimate the influence of both molecular mass and interactions upon A in a series of glycols: ethylene glycol (EG; 99.9% SPECTRANAL, GC, Riedel-de Haën), diethylene glycol (DEG; 99.99% BioUltra, GC, Fluka), triethylene glycol (TEG; 99.96% BioUltra, anhydrous, GC, Fluka) and tetraethylene glycol (TTEG; 99.7% puriss., GC, Fluka). The molecules of these four compounds have similar chemical structures, but differ in mass and interaction parameters ε11.
Liquids of all these compounds were introduced into the droplet injector with a sterile syringe. Next the droplets were injected into the electrodynamic trap. They were charged during injection and thus could be trapped by appropriate combination of AC and DC electrodynamic fields. The initial droplet radius was several μm. In the electro-dynamic trap single droplets levitated in a small volume set by the trapping geometry and parameters of the system. The evolution of the droplet radius R(t) in time was obtained via the recorded angle-resolved light scattering and analysis based on the Mie scattering theory. Details of the experimental set-up are given in our previous publication.8
In Fig. 5 we show a radius of a droplet of triethylene glycol (very small droplet) and of ethylene glycol (a slightly large droplet) as a function of time. The data were fit to solution of eqn (1) (see eqn (5)). There were two free parameters in the fit: the kinetic parameter, A, and the temperature difference between the vapour temperature far from the droplet, Tb, and the droplet temperature, Tliq. The second of the fitting parameters was important for all sizes of studied droplets. The parameter A was important only for small droplets i.e. at times when the droplet size decreased to a value comparable to Aλ (where the mean free path in nitrogen was λ = 66 nm). Therefore in order to find both Tb − Tliq and A reliably, a droplet, which during evaporation reached a size below ∼2 μm, was selected. The presence of impurities influences the results very severely1,12,13 and therefore we used pure liquids. The ballistic mode of evaporation is utterly negligible for droplets larger than ∼6 μm. Thus, fitting the model to the radius evolution above 6 μm was used to find the Tb − Tliq parameter only (see the lower panel of Fig. 5). Extending the fit to further evaporation enables finding both Tb − Tliq and A reliably. Tb − Tliq should not change in the extended fit and serves as a check against the influence of impurities. In short, after the fit of Tb − Tliq we fixed its value and for longer times (and thus smaller droplets) fitted only A.
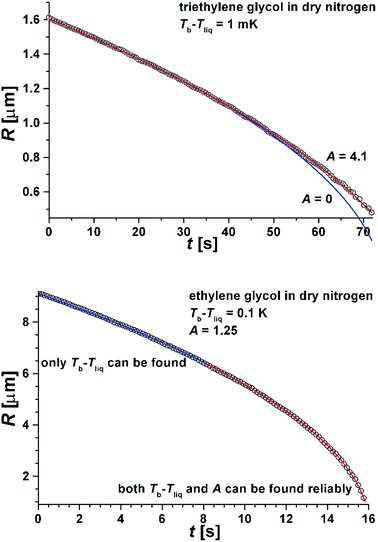 | ||
| Fig. 5 Upper panel: The radius R(t) as a function of time for triethylene glycol droplets evaporating into the dry nitrogen atmosphere. The following parameters characterized the system: Δh = 80 kJ mole−1, ρliq = 1121 kg m−3, κv = 0.0258 J m−1 s−1 K−1, λ = 66 nm. The blue line is a fit with Tb − Tliq as the only fitting parameter and A = 0. The red line is a fit with suitably chosen A and Tb − Tliq (see eqn (5)). Lower panel: The radius R(t) as a function of time for ethylene glycol droplets evaporating into the dry nitrogen atmosphere. The following parameters characterized the system: Δh = 62 kJ mole−1, ρliq = 1109 kg m−3, κv = 0.0258 J m−1 s−1 K−1, λ = 66 nm. The red line is a fit with suitably chosen A and Tb − Tliq in eqn (5). The blue line shows the region of droplet sizes affected only by the temperature difference and not by the kinetic parameter, A. | ||
In Fig. 6 we show the dependence of A on molecular mass, temperature and intermolecular interactions of liquid molecules. The interaction between molecules is proportional to the enthalpy of evaporation ε11 ∼ Δh (Δh is given in the ESI† for all studied compounds). The dependence of A(kBT/ε11) is nearly linear as a function of m1/m2 in very good agreement with MD results presented in eqn (7). The value of A for TTEG (tetra-ethylene glycol) is loaded with relatively high uncertainty since a TTEG droplet is more prone to contamination (e.g. with water) due to its hour-long evaporation. The dependence of A upon temperature, as predicted by MD calculations, is hardly accessible in our experiments. For the 273–298 K temperature range studied experimentally the square root of temperature changes is ∼4% while the accuracy of A is at least several %.
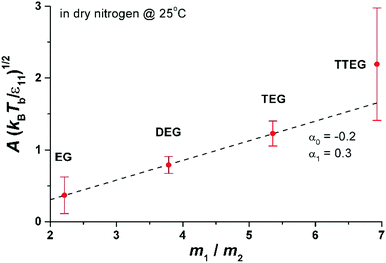 | ||
| Fig. 6 Parameter A as a function of molecular mass, m1, divided by the mass of nitrogen, m2. The interaction energy ε11 = 2Δh/(sNA), where Δh is the enthalpy of evaporation14 (per mole; see also the ESI†) at 273 K, s is the number of nearest neighbours in the liquid (we set s = 4 from computer simulations of ethylene glycol (EG)15) and NA is the Avogadro number. The dashed line is the linear fit to eqn (7). From the fit to eqn (7) we find α1 = 0.3 and α0 = −0.2, to be compared with α1 = 0.42 to 0.65 and α0 = 1.40 obtained in simulations of LJ fluid. The Lennard-Jones liquid of spherical molecules studied in MD simulations (Fig. 3) is very much different from the linear chain molecules studied experimentally. Nonetheless eqn (7) works very well for both systems giving very similar values of α1 (compare Fig. 6 with Fig. 3). However α1 and α0 are not universal and vary from system to system depending probably on subtle differences in the range of intermolecular interactions and the structure of the liquid. In general we do not have a physical interpretation of these parameters. For example for water we found A(kBTb/ε11)1/2 = 1.8(m1/m2 = 0.64) and for glycerol A(kBTb/ε11)1/2 = 1(m1/m2 = 3.3). More simulations and experiments on different compounds are needed to elucidate the origin of α1 and α0. Nonetheless, since both α1 and α0 are of the order of 1 eqn (7) seems to grasp most of the physical ingredients of ballistic transport of energy in the system and its influence on the evaporation flux. | ||
Conclusions
Kinetic effects and ballistic transport of energy is being currently studied in computer simulations.16–25 The main difficulty in the quantitative prediction of the evaporation flux is the appropriate estimate of the energy flux from the gas to the surface of the liquid in the close vicinity of the interface. In the ballistic region close to the interface gas molecules individually collide with molecules in the liquid, but the collisions involve all nearest neighbours of a given molecule in the liquid and become multiple particle processes that cannot be simply reduced to binary collision. The finite range of intermolecular-interactions couples many liquid molecules during collisions with a gas molecule. Therefore we cannot describe this effect as a pure binary collision with well-known energy transfer. The phenomenological formula for A (eqn (7)) contains information about such processes. The practical message from our study is that slowly evaporating liquids consisting of high molecular mass are affected by the ballistic mode of energy transfer even for large, micro-meter size droplets. In the nanometric size range of droplets, evaporation of all liquids is very strongly influenced by parameter A. Eqn (1) together with eqn (7), the main result of this work, should apply to evaporation of all liquids from LJ liquids to water and for all sizes of droplets. The details of molecular structure affect the evaporation process. In our equations interactions between liquid molecules are mainly included in the enthalpy of evaporation, Δh, (eqn (1)) and in parameter A (eqn (7)). The origin of two parameters (α0 and α1) in eqn (7) is not known. Most probably they depend on the range of interactions and structure of the liquid and tell us how well molecules in the liquid are coupled during collisions with gas molecules. Therefore eqn (7)i.e. dependence of A on molecular mass, can be used for a series of compounds having similar chemical structures and the corresponding structure of the liquid as we have shown for a series of Lennard-Jones liquids (Fig. 3) and a series of glycols (Fig. 6).The temperature discontinuity, ΔT, across an interface crossed by a thermal flux, j, is related to the Kapitza resistance, Rk = ΔT/j. The temperature discontinuity at the liquid droplet–gas interface (eqn (6)) (first observed by Ward and coworkers2–6 and explained by Bond and Struchtrup26) allows us to quantify the Kapitza resistance using energy flux from eqn (1). We find the Kapitza resistance for our system: Rk = Aλ/κv. The typical values of Rk are 10−5 to 10−6 m2 K W−1; for water 1.3 × 10⁻⁵, glycerol 10−5, TEG 1.3 × 10⁻⁶, TTEG 2.5 × 10⁻⁶ m2 K W−1 and similarly for the Lennard-Jones liquid.
The ballistic mode of energy transfer discussed in this paper is important for various phenomena, when characteristic sizes in the system become comparable to the mean free path in the gas. For example this mode of energy transfer arises when gas bubbles are formed in liquid by e.g. laser heating27 or for the flow of gases through nanoholes of sizes comparable to the mean free path.28
In this paper we have not discussed the issue of nucleation and growth just after the nucleation. All studied systems (LJ or glycols) were under thermodynamic conditions far from the region where nucleation plays a role.29
Acknowledgements
This work was supported by the National Science Centre, Poland, under grant 2014/13/B/ST3/04414.Notes and references
- R. Hołyst, M. Litniewski, D. Jakubczyk, K. Kolwas, M. Kolwas, K. Kowalski, S. Migacz, S. Palesa and M. Zientara, Rep. Prog. Phys., 2013, 76, 034601 CrossRef PubMed.
- A. Persad and C. Ward, Chem. Rev., 2016, 116, 7727–7767 CrossRef CAS PubMed.
- G. Fang and C. A. Ward, Phys. Rev. E: Stat. Phys., Plasmas, Fluids, Relat. Interdiscip. Top., 1999, 59, 417 CrossRef CAS.
- C. A. Ward and G. Fang, Phys. Rev. E: Stat. Phys., Plasmas, Fluids, Relat. Interdiscip. Top., 1999, 59, 429 CrossRef CAS.
- G. Fang and C. A. Ward, Phys. Rev. E: Stat. Phys., Plasmas, Fluids, Relat. Interdiscip. Top., 1999, 59, 441 CrossRef CAS.
- A. J. H. McGaughey and C. A. Ward, J. Appl. Phys., 2002, 91, 6406 CrossRef CAS.
- R. Hołyst and M. Litniewski, Phys. Rev. Lett., 2008, 100, 055701 CrossRef PubMed.
- R. Hołyst, M. Litniewski, D. Jakubczyk, M. Zientara and M. Wozniak, Soft Matter, 2013, 9, 7766–7774 RSC.
- M. P. Allen and D. Tildesley, Computer Simulations of Liquids, Oxford University Press, 1987 Search PubMed.
- L. Verlet, Phys. Rev., 1967, 159, 98–103 CrossRef CAS.
- P. E. Kloden and E. Klaten, Numerical Solutions of Stochastic Diferential Equations, Springer, Berlin, 1992 Search PubMed.
- F. Muller-Plathe, J. Chem. Phys., 1997, 106, 6082 CrossRef.
- D. Jakubczyk, M. Kolwas, G. Derkachov, K. Kolwas and M. Zientara, Acta Phys. Pol., A, 2012, 122, 709–716 CrossRef CAS.
- J. B. Pedley, R. D. Naylor and R. B. Kirby, Thermochemical Data of Organic Compounds, Chapman and Hall, New York, 1986, pp. 1–792 Search PubMed.
- A. V. Gubskaya and P. G. Kusalik, J. Phys. Chem. A, 2004, 108, 7151–7164 CrossRef CAS.
- D. Albernaz, D. M. Do-Quang and G. Amberg, Phys. Rev. E: Stat., Nonlinear, Soft Matter Phys., 2015, 91, 043012 CrossRef PubMed.
- N. M. Kovalchuk, A. Trybala and V. M. Starov, Curr. Opin. Colloid Interface Sci., 2014, 19, 336 CrossRef CAS.
- T. Ishiyama, S. Fujikawa, T. Kurz and W. Lauterborn, Phys. Rev. E: Stat., Nonlinear, Soft Matter Phys., 2013, 88, 042406 CrossRef PubMed.
- M. Heinen, J. Vrabec and J. Fischer, J. Chem. Phys., 2016, 145, 081101 CrossRef PubMed.
- A. Lotfi, J. Vrabec and J. Fischer, Int. J. Heat Mass Transfer, 2014, 73, 303–317 CrossRef.
- J. Zhang, F. Mueller-Plathe, M. Yahia-Ouahmed and F. Leroy, J. Chem. Phys., 2013, 139, 134701 CrossRef PubMed.
- S. Cheng, J. B. Lechman, S. J. Plimpton and G. S. Grest, J. Chem. Phys., 2011, 134, 224704 CrossRef PubMed.
- O. Wilhelmsen, T. T. Trinh, S. Kjelstrup and D. Bedeaux, J. Phys. Chem. C, 2015, 119, 8160–8173 CAS.
- R. Ledesma-Aguilar, D. Vella and J. M. Yeomans, Soft Matter, 2014, 41, 8267–8275 RSC.
- R. Hołyst, M. Litniewski and D. Jakubczyk, Soft Matter, 2015, 11, 7201–7206 RSC.
- M. Bond and H. Struchtrup, Phys. Rev. E: Stat., Nonlinear, Soft Matter Phys., 2004, 70, 061605 CrossRef PubMed.
- J. Lombard, T. Biben and S. Marabia, Nanoscale, 2016, 8, 14870–14876 RSC.
- M. Savard, C. Tremblay-Darvea and G. Gervais, Phys. Rev. Lett., 2009, 103, 104502 CrossRef CAS PubMed.
- J. L. Katz and J. Ostermier, J. Chem. Phys., 1967, 47, 478–487 CrossRef CAS.
Footnote |
| † Electronic supplementary information (ESI) available. See DOI: 10.1039/c7sm00804j |
| This journal is © The Royal Society of Chemistry 2017 |

