 Open Access Article
Patterned oscillating topographical changes in photoresponsive polymer coatings†
M.
Hendrikx
 ab,
A. P. H. J.
Schenning
 ab and
D. J.
Broer
 *ab
*ab
aFunctional Organic Materials and Devices, Department of Chemical Engineering and Chemistry, Eindhoven University of Technology, 5612 AZAE, Eindhoven, The Netherlands. E-mail: D.Broer@tue.nl
bInstitute for Complex Molecular Systems, Eindhoven University of Technology, P.O. Box 513, 5600 MB, Eindhoven, The Netherlands
First published on 24th May 2017
Abstract
The light-induced surface topography of a liquid crystal polymer coating is brought into a patterned oscillatory deformation. A dichroic photo-responsive azobenzene is co-aligned with the planar oriented nematic liquid crystal network molecules which makes the surface deformation sensitive to polarized UV light. Locally selective actuation is achieved in coatings with a complex alignment pattern. Dynamic oscillation, as controlled by the actuation and relaxation kinetics of the polymer, is obtained by a continuous change in the polarization of the UV source. The atypical deformation at the defect lines between the domains is of special interest. The amplitude and presence of the oscillation can be manipulated by changing the ratio between blue and UV light and by varying the ambient temperature of the coating.
Introduction
The concept of making materials smart by design, meaning that they can change their properties or shape by exposure to an external stimulus, has the potential to change our daily life in many ways. Special attention is given to responsive surfaces as they mediate between the bulk of the material and the outside world with properties related to friction and tribology, touch perception, capability to remove dirt or to reject liquids. A powerful example is cell manipulation at surfaces that reveals that changes on the nanoscale can be used in cellular adhesion and motility.1,2 Studies have been performed to produce responsive surface topographies.3–7 For example, coatings based on liquid crystal networks (LCNs) containing azobenzene moieties have been shown to produce dynamic topographies. The topographies form and disappear on demand by turning the light on and off, resulting in controllable surface structures.8,9 In all these cases, the surface deformation is binary, i.e. the whole surface is in its ‘on’ state or in its ‘off’ state. Local variations are not possible other than exposure through a mask. This allows for an easy remote-like actuation which can be utilized in different applications. The use of light as a trigger also allows for a self-powered approach to smart materials, removing electronics and batteries from the device itself.Coating materials that can switch their surface topography in an oscillating manner between an ‘on’ corrugated state and an ‘off’ flat state would be of even more interest. Oscillatory systems can be found in Nature. Cardiovascular rhythm, respiration, cell cycles and other biological rhythms are energy-driven actions without the need for an on/off switch or trigger. These processes show a non-equilibrium state in which the system constantly modifies its behaviour to address a continuous change. A large effort has been made to achieve such autonomous oscillators, unfortunately most of them rely on wet conditions. These are mainly based on responsive hydrogels or chemical reactions leading to out-of-equilibrium states; e.g. the Belousov–Zhabotinsky reaction,10,11 self-oscillation12 and self-walking hydrogels13 and photoregulated worm-like motion14 and binary light switching.15 Attempts to create oscillators in a dry environment with an autonomous behavior have been made.16–18 These oscillatory actuators are all freestanding polymer films and are based on the isomerization of azobenzenes. Inducing trans-to-cis and cis-to-trans isomerization leads to continuous actuation and relaxation of the polymer films.19,20 However, coatings that change their surface topography in an oscillating manner have not been reported.
It is the aim of the research presented here to control the local actuation of selected elements at the surface by means of polarized light. We designed coatings with a patterned nematic organization that benefit from the dichroic properties of azobenzene to preferentially address those elements in the surface that are aligned parallel to the direction of polarization of the light. This approach will allow us to use a continuous power source to obtain a patterned oscillatory response in a coating.
Experimental
Materials
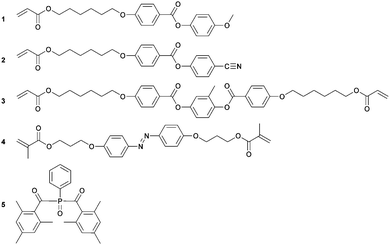
LCN coatings were made from a mixture of liquid crystalline acrylates and necessary additives, as shown in Scheme 1, and have been described previously in more detail.4,21 Monomers 1–3 were obtained from Merck UK. Monomer 4 was custom-synthesized by Syncom (Groningen, the Netherlands). Photoinitiator 5 was obtained from Ciba. A typical LCN composition consists of 41.4 wt% monomer 1, 20.6 wt% monomer 2, 31 wt% monomer 3, 5 wt% monomer 4 and 2 wt% photoinitiator 5. This amount of photoinitiator is chosen to produce a fully crosslinked LC polymer film. The amount of monomer 5 is chosen to be higher than previously reported due to the bottom-to-top illumination technique used. The constituents were mixed by dissolving in dichloromethane and stirred until a homogeneous solution was obtained. Dichloromethane was removed under a reduced atmosphere to achieve a reactive LC monomer mixture. The photoalignment layer, LPP ROP-108/2CP, was obtained from Rolic. All chemicals were used as received.Fabrication of the patterned azo-LCN coating
Glass substrates (3 × 3 cm) were cleaned by sonication using acetone and propanol-2 followed by UV ozone cleaning. The photoalignment material (linearly photopolymerizable polymer, LPP) was spin-coated onto the cleaned substrates. Two substrates were glued together using adhesive containing 6 μm spacers. The LPP surfaces of the thus obtained LC cells were patterned by a 2-step exposure. In the first step, the sample was exposed to polarized light through a mask for 15 minutes. In the second step, the mask was removed and a shorter flood exposure, 3 minutes, was applied with light with polarization orthogonal to the first exposure. The second exposure aligned the areas that were unaddressed but did not overwrite the alignment achieved by the first exposure step, thus creating an orthogonally aligned pattern. The LC cells were filled with the LC monomer mixture by capillary forces and cured at 38 °C with light >400 nm (EXFO Omnicure S2000) followed by a short post-cure at 125 °C for 5 minutes. Afterwards, one of the glass plates was removed leaving a coating adhering to glass on one side and with a free surface on the other side.Characterization and actuation of the azo-LCN coating
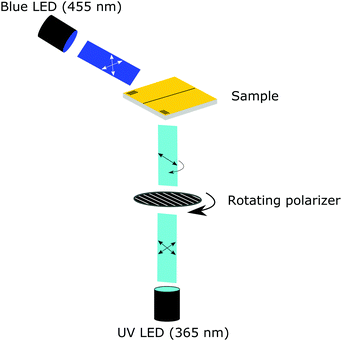
The monomeric mixture and coating were characterized using a crossed-polarized microscope (Nikon Ci Eclipse) equipped with a thermo-controlled stage (Linkam). For the monomeric mixture, the nematic to isotropic transition temperature is determined by cooling from the isotropic liquid to the nematic LC phase. Both the polymeric and monomeric transitions were confirmed using differential scanning calorimetry (DSC Q1000, TA Instruments). The surface of the coating was monitored using a digital holographic microscope (DHM® R210, Lyncée Tec SA, Switzerland) equipped with a thermo-controlled stage (Linkam) and mounted with UV (λ = 365 nm) and blue light (λ = 455 nm) collimated LEDs (M365L3 and M455L3, respectively, Thorlabs). The UV light originating from the UV LED was redirected by a UV mirror (Thorlabs) and polarized by a polarizer (10LP-UV, Newport) mounted in a rotating stage (Thorlabs), see Fig. 1. The coating was triggered by turning the blue and UV light LEDs on (typically 20 and 200 mW cm−2, respectively) together with the rotating stage (typically 2.5° s−1). The initial resting state was monitored for 30 s without illumination, after 20 s the rotating stage was turned on and 10 s later the UV and blue lights were turned on and monitored for approximately 25 minutes. In each experiment, 10 full rotations of the polarizer were monitored to investigate the development and relaxation of topographies formed by the polarization selective absorption of the azobenzene moieties. After 10 full rotations, the UV light was turned off. Monitoring of the changes in real-time was performed at 15 fps, and the acquisition rate of the holograms was set to 0.5 fps. This resulted in a captured hologram every 5° of rotation. The LCN coating relaxed in the presence of blue light until an equilibrium state was reached. Post processing of the holograms was performed using Koala software (Lyncée Tec SA). Videos of the oscillating deformations were made with ImageJ and were sped up 40×.Results and discussion
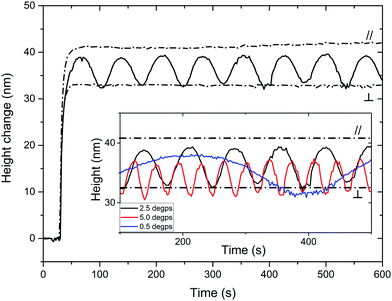
A liquid crystal network coating with a uniaxial planar and patterned director orientation is made between two glass plates. The local director orientation is controlled by photoalignment layers based on a linearly photopolymerizable polymer (LPP).22 After curing the LC mixture, the polymeric coating is obtained by removing one of the glass substrates. The coated glass is placed in the setup depicted in ESI,† Fig. S3. The surface topography formation is monitored by digital holographic microscopy (DHM®) upon illumination with polarized 365 nm light in a bottom-to-top fashion and simultaneous illumination with unpolarized 455 nm light at an angle from the top. The modulation is here reported as a height change compared to the average of the observed area, unless stated otherwise. The azobenzene moiety has an absorption maximum around 365 nm in its trans state and at 455 nm in its cis configuration. Memorizing the shape of the azobenzene moiety, it is important to note that the elongated configuration (E-isomer) is most sensitive for actuation by light with its field vector parallel to its long axis. The bend configuration (Z-isomer) is less dependent on the polarization of light. The dichroic ratio, the ratio between absorbance parallel and perpendicular to the director, is 3.6 and 1.7 at 365 nm and 455 nm, respectively. An irradiance ratio of 0.1 between both wavelengths, 365 nm and 455 nm respectively, should result in an optimal response, as previously published by Liu.23 This ratio was used as a basis for the following experiments.Firstly, we will discuss the influence of actuating a uniaxial planar aligned coating with polarized light parallel and perpendicular to the director. The height change is measured with respect to the glass substrate. As visualized in Fig. 2, the height changes for the coating illuminated with parallel polarized light (//) are largest. Within 60 s, the photostationary state is reached for both the parallel and perpendicular illumination. The expansion of the film is of the order of 0.75–1% under the influence of light. This result is rather low compared to the published results for cholesteric phases. Moreover, due to the illumination setup, most actuation will occur in the bottom regions of the coating, limiting the strain of the material. Furthermore, we observed that even with perpendicular polarized UV illumination (⊥), there is still a remarkable actuation present which is approx. 30% smaller than with parallel actuation. The height increase upon illumination with perpendicular polarized light can be ascribed to the still considerable absorption of UV light related to the relatively poor dichroic ratio. Upon rotation of polarization, the maximum oscillation will be between the given extrema for parallel and perpendicular exposure. The actual height oscillation is determined by the polarized rotation speed and the kinetics of the relaxation of the azobenzene moiety. As can be seen in Fig. 2, at a polarizer rotation speed of 2.5° s−1 the sinusoidal height wave oscillated for a period of 72 seconds, as expected. The amplitude is between the height obtained by perpendicular and parallel illumination and the period corresponds to the time needed to fully rotate the polarization. This result suggests that after each rotation a photostationary state of the cis–trans azobenzene equilibrium is reached. The oscillation is formed by a continuous change in the local ratio of absorbed UV light and blue light causing each time a different cis–trans photostationary state and therefore a different height. Slowing the polarizer rotation speed down does not increase the amplitude further. However, increasing the rotation speed reduces the oscillation amplitude: doubling the rotation speed decreases the amplitude by 17%. The actuation height of the parallel exposure (//) almost overlaps with the maximum of the oscillation given by the 2.5° s−1 rotation, while the minimum overlaps with the perpendicular exposure (⊥). At increased rotation speeds, the oscillation starts diverging from the sinusoidal shape, being the result of a mismatch between the kinetics and the rotation speed. Increasing the rotation speed hardly changes the response leading to the conclusion that 2.5° s−1 is the optimal speed for these oscillations.
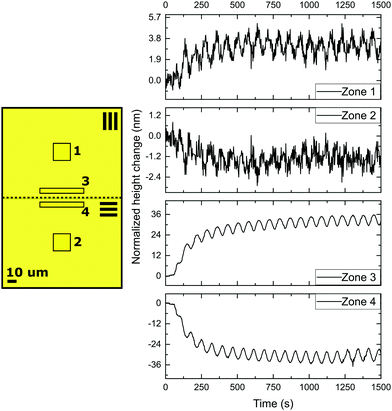
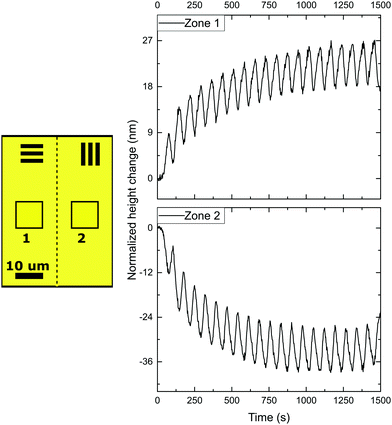
Next, in order to create different simultaneous oscillations, we studied coatings with patterned alignment. Thereto we created adjacent striped domains with an orthogonal uniaxial orientation with a periodicity of 200 μm and 40 μm, respectively. We first consider the 200 μm periodic structures with 0°/90° orientation, with 0° and 90° meaning the parallel and perpendicular alignment of the director with respect to the topological defect line. The domains are orthogonal with respect to each other, while the transition (Néel wall) between both domains forms a +1/2 or −1/2 topological defect line governed by the LC stresses prior to polymerization. The initial state of the coatings is quasi-flat after opening of the cell with very small topographies visible around the topological defect lines due to local stresses. Then, the domains are simultaneously exposed by rotating polarized UV light. The results of the topographical actuation upon LED irradiation through a rotating polarizer, shown in Fig. 3, demonstrate the oscillating responses of the two different zones in the coating. In comparison with the experiment performed with uniaxial aligned planar coatings, we measure a difference in actuation for the two adjacent orthogonally aligned domains, resulting in different height changes, as depicted in Fig. 2.
When measured 50 μm away from the defect line, indicated as zones 1 and 2 in Fig. 3, the deformations oscillate out of phase around their initial height corresponding that shown in Fig. 2 for a uniaxial film. The difference between height changes of zones 1 and 2 can be dedicated to a small tilt of the sample during the measurement.
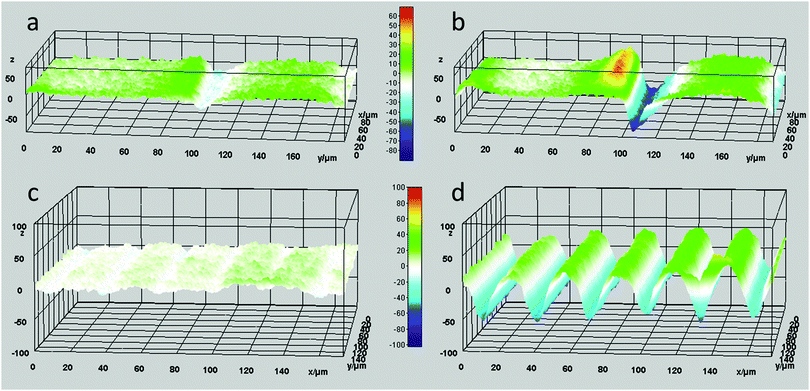
However, the situation is different closer to the defect line. We measure in zones 3 and 4 which are at a distance less than 20 μm from the defect line. Here, we observe much larger deformations (see the supplementary video, ESI†). Fig. 3 shows an apparent increase of the normalized height for zone 3 and a decrease for zone 4. The increase and decrease is related to the average. The photostationary states for the zones located close to the defect line are completely different from that observed for zones further away, as shown in the supplementary video, ESI†. Moreover, for zones 3 and 4 the oscillatory growth and descent, leading to patterned oscillations are out-of-phase with respect to each other. This results in two different oscillations, one increasing and one decreasing, with out-of-phase characteristics while only changing the polarization of the UV irradiation. Most interestingly, the largest deformations in this coating are completely concentrated around the topological defect line, illustrated by the dotted line in the schematic representation in Fig. 3, and determined by the molecular orientation of the adjacent domains. The largest oscillatory topography is formed on the side of the 90° domain, while a valley is created on the 0° domain. The lateral dimensions at which these surface deformations are expressed reach approximately 20 μm in both directions (see Fig. 5 and also ESI,† Fig. S4). This is a factor 10 larger than the topological defect line width which is in the order of 1–2 μm.
With the oscillation mostly present in the areas at or near the topological defect line, it is believed that the origin of the oscillating topographies is from accumulated stresses in these regions. Taking the stresses into account that the azo-LCN develops during actuation, one can believe that one domain dominates the stresses over the adjacent orthogonal domain. Stresses push perpendicular to the director of the LCN coating and a contraction along this director. For perpendicularly aligned domains in a 0°/90° design, this leads to a decrease of stress in the “0° domain” and an increase in the “90° domain”, as observed by us.
In order to study this phenomenon further, a patterned coating with a pitch of 40 μm was investigated (Fig. 4). Here, the domain sizes are in the order of the lateral dimensions of the topographies observed during the actuation for large pitches, i.e. 200 μm (Fig. 5 and ESI,† Fig. S5). Therefore, a pure asymmetric response is observed where one domain increases and the adjacent domain decreases in height, as observed in the supplementary video, ESI†. These patterned oscillations are a result of the deformations created on and near the topological defect line.
In all previous cases, all experiments were performed at room temperature. This could result in rather slow cis-to-trans kinetics.24–26 To monitor the effect of temperature, the patterned coating with a pitch of 40 μm was investigated at temperatures between 30 °C and 80 °C. Prior to any UV illumination, the sample was left in place and allowed to relax back to its quasi-flat state for approximately 30 min in the presence of blue light while equilibrating at the elevated temperature. The height changes are normalized to show the effect of the resulting light actuation. It is important to note that the surface starts deforming upon heating well above the glass transition at 46 °C, measured using differential scanning calorimetry (see ESI,† Fig. S6), due to thermal expansion. These deformations are of the same order as observed with polarized light actuation at room temperature (see ESI,† Fig. S7 and S8). After equilibration of the sample at the set temperature, the same procedure of actuation was applied. The results of individual temperature runs are shown in Fig. 6, the monitored zone is the same for each experiment (i.e. zone 1). The first observation is that during heating above the glass transition the actuation is still present. Furthermore, the presence of oscillation is also maintained. Hence, the average photostationary states around which the oscillation occurs, measured from the resting state, decreases significantly with increasing temperature. To visualize the influence, a plot expressing the maximum and minimum of the oscillation as a function of temperature is shown in the right side of Fig. 6. It is visible that below 50 °C the absolute height and amplitude of the oscillation increase. Upon further increasing the temperature, the absolute height starts to decrease significantly, while the amplitude remains unchanged. Interestingly, a maximum amplitude of the oscillation is reached at 50 °C. Without the presence of any light, this temperature is close to the material's glass transition. However, from previous work, we know the glass transition changes upon irradiation with blue light due to photosoftening.25
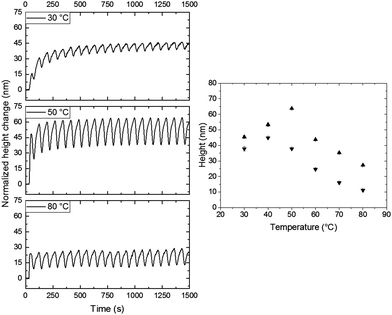 | ||
| Fig. 6 Influence of temperature upon illumination of rotating polarized UV light and unpolarized blue light. Left: Normalized height changes over time during polarized actuation with a rotating speed of 2.5° s−1 at different temperatures for the 0°/90° design. Right: The height maximum (▲) and minimum (▼) of the oscillation as a function of temperature. The intensities of 365 nm and 455 nm illumination were 200 mW cm−2 and 20 mW cm−2, respectively. In all the measurements, the monitored zone was the same and normalized. The chosen zone corresponds to zone 1 in Fig. 4. | ||
Therefore, the influence of the amount of blue light was investigated to determine an optimal balance at room temperature. In Fig. 7, the results of the rotating linear polarized light actuation with different intensity ratios of blue and UV light are given. One can clearly observe the same type of trend as in the temperature scanning run and therefore it is believed that the increase of blue light, leads to the photosoftening of the azo-LCN coating. One important result from this is the presence of blue light. In order to achieve any oscillation governed by the rotation of polarized UV light, blue light must be present. In the absence of blue light, the thermal isomerization from the cis to trans-isomer is too slow and the relaxation of the topography is unachievable at room temperature. Upon the addition of blue light, a maximum of response combined with oscillation is achieved under illumination containing 10% of blue light compared to UV light intensity, however this does lead to a decrease in the maximum actuation. Lower or higher values lead to a decrease of the oscillation or disappearance of the actuation, respectively. At an intensity ratio of 1.00, the azo-LCN coating is unable to achieve any pronounced actuation and even a disappearance of the oscillation is observed, leading to the near complete relaxation of the azobenzene moiety. Furthermore, the presence of blue light during relaxation of the coating's topographies is important (see ESI,† Fig. S9 and S10). In the absence of blue light, the relaxation is in the order of days, with a slow linear decay, while in the presence of blue light, the relaxation of the topographies follows an exponential decay.
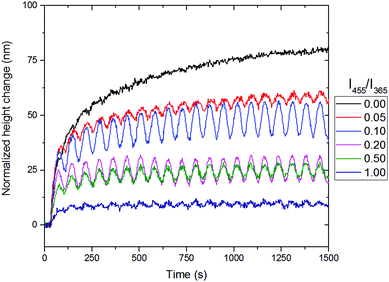 | ||
| Fig. 7 The influence of the ratio between the intensity of blue (455 nm) and UV light (365 nm) for the 0°/90° designed coatings with the phase snapshot of the coatings. The comparisons shown in the graph correspond to zone 1 in Fig. 4. | ||
Conclusions
It was demonstrated that nematic LCN coatings can be aligned in orthogonal domains to create polarization selective responses. Upon illumination with rotating linear polarized UV light while tuning the isomerization with blue light, patterned oscillations of topographies can be achieved. The speed of rotation of polarized UV light is optimal at 2.5° s−1. Most importantly, in all cases the topographies form around the topological defect lines and extend approximately 20 μm laterally. Changing the pitch of the patterned domains to match this lateral deformation resulted in a larger amplitude. The maximum amplitude is found at an intensity ratio, I365/I455, of 0.10. The temperature of the coating also determines the amplitude of the oscillation during actuation. The best results are obtained at temperatures just above the glass transition temperature, here 50 °C. Typical topographical deformations are in the order of 1% of the initial coating thickness with oscillations in the scales of nanometers, approximately 35% of the actuation height. Such dynamic topographies can be imprinted on materials for haptic feedback or easy-to-clean solutions under dry and extreme conditions by mechanical removal of sand or dust or even to control cellular adhesion and mobility. For the latter, both pitch and defect patterns can be optimized to provide different patterned oscillations.Acknowledgements
MH thanks the NWO (TOP PUNT grant 10018944) for funding. MH also thanks Danqing Liu, Jérôme Parent, Xie Shenqi and Yves Emery for the helpful discussions.References
- M. Nikkhah, N. Eshak, P. Zorlutuna, N. Annabi, M. Castello, K. Kim, A. Dolatshahi-Pirouz, F. Edalat, H. Bae, Y. Yang and A. Khademhosseini, Biomaterials, 2012, 33, 9009–9018 CrossRef CAS PubMed.
- G. Koçer, J. ter Schiphorst, M. Hendrikx, H. G. Kassa, P. Leclère, A. P. H. J. Schenning and P. Jonkheijm, Adv. Mater., 2017, 1606407 CrossRef PubMed.
- K. Hermans, I. Tomatsu, M. Matecki, R. P. Sijbesma, C. W. M. Bastiaansen and D. J. Broer, Macromol. Chem. Phys., 2008, 209, 2094–2099 CrossRef CAS.
- D. Liu and D. J. Broer, Langmuir, 2014, 30, 13499–13509 CrossRef CAS PubMed.
- D. Liu, L. Liu, P. R. Onck and D. J. Broer, Proc. Natl. Acad. Sci. U. S. A., 2015, 112, 1–6 CrossRef.
- N. K. Viswanathan, D. Y. Kim, S. Bian, J. Williams, W. Liu, L. Li, L. Samuelson, J. Kumar and S. K. Tripathy, J. Mater. Chem., 1999, 9, 1941–1955 RSC.
- D. Liu and D. J. Broer, Soft Matter, 2014, 10, 7952–7958 RSC.
- D. Liu, C. W. M. Bastiaansen, J. M. J. den Toonder and D. J. Broer, Angew. Chem., Int. Ed., 2012, 51, 892–896 CrossRef CAS PubMed.
- D. Liu and D. J. Broer, Angew. Chemie - Int. Ed., 2014, 126, 4630–4634 CrossRef.
- V. Petrov, V. Gáspár, J. Masere and K. Showalter, Nature, 1993, 361, 240–243 CrossRef CAS.
- H. Zhou, Z. Zheng, Q. Wang, G. Xu, J. Li and X. Ding, RSC Adv., 2015, 5, 13555–13569 RSC.
- D. Suzuki, T. Kobayashi, R. Yoshida and T. Hirai, Soft Matter, 2012, 8, 11447 RSC.
- S. Maeda, Y. Hara, T. Sakai, R. Yoshida and S. Hashimoto, Adv. Mater., 2007, 19, 3480–3484 CrossRef CAS.
- S. Shinohara, T. Seki, T. Sakai, R. Yoshida and Y. Takeoka, Angew. Chem., Int. Ed., 2008, 47, 9039–9043 CrossRef CAS PubMed.
- S. Coleman, J. ter Schiphorst, A. Ben Azouz, S. Bakker, A. P. H. J. Schenning and D. Diamond, Sens. Actuators, B, 2017, 245, 81–86 CrossRef CAS.
- T. J. White, N. V. Tabiryan, S. V. Serak, U. a. Hrozhyk, V. P. Tondiglia, H. Koerner, R. a. Vaia and T. J. Bunning, Soft Matter, 2008, 4, 1796–1798 RSC.
- K. Kumar, C. Knie, D. Bléger, M. A. Peletier, H. Friedrich, S. Hecht, D. J. Broer, M. G. Debije and A. P. H. J. Schenning, Nat. Commun., 2016, 7, 11975 CrossRef CAS PubMed.
- A. H. Gelebart, G. Vantomme, B. E. W. Meijer and D. J. Broer, Adv. Mater., 2017, 1606712 CrossRef PubMed.
- Y. Yu, M. Nakano and T. Ikeda, Nature, 2003, 425, 145 CrossRef CAS PubMed.
- K. M. Lee, H. Koerner, R. a. Vaia, T. J. Bunning and T. J. White, Soft Matter, 2011, 7, 4318 RSC.
- C. L. van Oosten, C. W. M. Bastiaansen and D. J. Broer, Nat. Mater., 2009, 8, 677–682 CrossRef CAS PubMed.
- L. T. de Haan, C. Sánchez-Somolinos, C. M. W. Bastiaansen, A. P. H. J. Schenning and D. J. Broer, Angew. Chem., Int. Ed., 2012, 51, 12469–12472 CrossRef CAS PubMed.
- D. Liu and D. J. Broer, Nat. Commun., 2015, 6, 8334 CrossRef CAS PubMed.
- J. M. Harrison, D. Goldbaum, T. C. Corkery, C. J. Barrett and R. R. Chromik, J. Mater. Chem. C, 2015, 3, 995–1003 RSC.
- K. Kumar, A. Schenning, D. J. Broer and D. Liu, Soft Matter, 2016, 12, 3196–3201 RSC.
- J. Vapaavuori, A. Laventure, C. G. Bazuin, O. Lebel and C. Pellerin, J. Am. Chem. Soc., 2015, 137, 13510–13517 CrossRef CAS PubMed.
Footnote |
| † Electronic supplementary information (ESI) available. See DOI: 10.1039/c7sm00699c |
| This journal is © The Royal Society of Chemistry 2017 |

