 Open Access Article
Creative Commons Attribution 3.0 Unported Licence
Bulk advection and interfacial flows in the binary coalescence of surfactant-laden and surfactant-free drops†
Emilia
Nowak
 *ab,
Zhihua
Xie
cd,
Nina M.
Kovalchuk
a,
Omar K.
Matar
c and
Mark J. H.
Simmons
a
aSchool of Chemical Engineering, University of Birmingham, Birmingham, B15 2TT, UK
bCollege of Sciences, Massey University, Auckland, 0745, New Zealand. E-mail: e.nowak@massey.ac.nz
cDepartment of Chemical Engineering, Imperial College London, London, SW7 2AZ, UK
dSchool of Engineering, Cardiff University, Cardiff, CF24 3AA, UK
First published on 14th June 2017
Abstract
This work focuses on the study of bulk flows accompanying the coalescence of two aqueous drops, one containing surfactant and the other surfactant-free, in silicone oils of various viscosities. It is observed that the surfactant-free drop intrudes into the surfactant-laden drop in the form of a penetrating jet whose speed increases and average radius decreases with increasing outer phase viscosity. Mixing patterns within the coalescing drops are due to the force imbalance caused by capillary pressure difference and surfactant-induced Marangoni stresses. The driving force for mixing associated with the difference in interfacial tension between the drops is considerably stronger than that related to the drop size. The long timescale mixing of the drops is driven by rapid interior convection, and the subsequent, slow, diffusive process. Three-dimensional numerical simulations show excellent qualitative and quantitative agreement with the experimental results. The implications of our results to formulation strategies of complex microstructures in practical applications are also discussed.
1. Introduction
The flow accompanying the merging of drops in binary coalescence events has been investigated extensively in the literature. The coalescence of drops of different properties, however, has received far less attention despite its importance for a plethora of industrial applications; these include tightly-controlled merging of reactants, and the formation of bespoke multiphase structures, which deliver specific function via novel manufacturing routes. In pursuing the formulation of complex liquid/solid products via the merging of droplets of varying compositions, the delicate interplay of the interfacial dynamics, advection, diffusion, and where relevant, physico-chemical effects, and chemical reaction kinetics must be accounted for.Currently, multiple microfluidic applications exploit the coalescence of drops for a variety of biological applications such as the mixing of cell- and nutrients-containing droplets,1 microreactors,2 numerous lab-on-a-chip (bio-) analytical devices,3 protein crystallisation,4 and nanoparticle synthesis.5 In particular, droplet-based micro-reactors can be exploited in the initiation, or quenching, of reactions at well-defined times and locations in, for instance, biochemical reactions. Merging droplets are also currently used widely in polymerisation to create particles/capsules, e.g. hydrocolloids polymerisation for medical applications, such as hydrogel bead-generation and cell-transplantation for therapeutic applications.6,7
The majority of the literature that focuses on the events following the fluid film drainage and rupture considers only the evolution of the bridge connecting the merging drops of similar composition in air,8,9 or in a surrounding, immiscible liquid.10,11 When the effect of different interfacial tensions between drops on the mixing within the droplets was considered, air was used as the external phase,12 even though applications in microfluidics require the presence of a surrounding liquid rather than a gas. The rate of mixing of the dispersed phase upon coalescence of initially stationary drops surrounded by another immiscible liquid has also been examined experimentally,13 and numerically;14 this, however, was done for the case of two drops with initially uniform, and equal, interfacial tensions only. The merging of two interfaces characterised by initially different interfacial tensions was considered experimentally for the case of a drop of one liquid coalescing with a reservoir of another.15 The mixing patterns inside two drops of initially different interfacial tension coalescing in a surrounding liquid have been studied numerically.16
In microfluidics applications, mixing is rather slow, and diffusion-dominated, due to the absence of large inertial contributions characterised by low Reynolds number flows. The merging of drops following a coalescence event, however, often results in internal flows within the dispersed phase that lead to mixing. The mixing intensity increases with the degree of system asymmetry, which is brought about, for instance, by coalescing drops of different size and/or composition. The imbalance in capillary pressure between two droplets of different size results in a pressure gradient that drives jetting motion of the smaller drop into the larger one.13 Differences in drop composition, due to the presence of surfactant in one of the drops, for example, leads to additional motion driven by Marangoni stresses. This was shown experimentally for the case of a surfactant-laden drop coming into contact with a surfactant-free drop.17 In such systems, it is expected that dispersed phase mixing will reflect a balance between a number of processes: the rate of injection of one drop into the other due to capillary pressure gradients, Marangoni stresses, in addition to diffusion at the latest stages of coalescence.12 The aim of the present paper is to consider the mixing processes in the system similar to that studied by Nowak, Kovalchuk et al.17 The bulk convective patterns developing by merging of dissimilar drops will be quantified for the cases of different initial drop diameters, interfacial tension and viscosity of surrounding oil.
2. Experimental
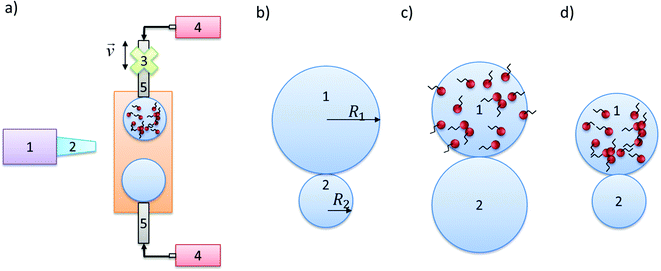
In this section, we provide details of the experimental setup, and data-collection procedure. The focus of the work is on comparing the coalescence dynamics of drops of initially different size and/or composition with that of identical drops; Fig. 1 shows the various scenarios investigated. Double-distilled water (Aquatron A 4000 D, Stuart) was used for pure, surfactant-free drops. The surfactant-laden drops were produced by addition of sodium lauryl ether sulphate (SLES, 70%, ES-70, R&D Laboratories Ltd), an anionic surfactant commonly used in industry, with a concentration of 0.84 g L−1, which exceeds the critical micelle concentration, CMC (CMC ∼ 0.2 g L−1); for the surface tension isotherm.17 The silicone oils (Sigma Aldrich) used for the continuous phase had viscosities of 9.3, 48, 96, 338, and 485 mPa s.For flow visualisation purposes, Nigrosin dye (Alfa Aesar, Johnson Matthey) was used with a concentration of 0.1 g L−1. For the velocity field measurements, hollow glass spheres (Dantec) with an approximate diameter of 10 μm were used, which are typical of particle-image-velocimetry (PIV) applications. Analysis of particle motion during drop coalescence to obtain the associated velocity fields was carried out using open-source PIVlab v 1.4 MATLAB toolbox.18
Surface and interfacial tensions were measured with the drop shape analysis method using a Goniometer DSA 100 Krüss. The interfacial tensions between silicone oil and water (with and without PIV particles), and silicone oil and aqueous Nigrosin solution, were 37 mN m−1 and 30 mN m−1, respectively; both values are significantly higher than the interfacial tension between silicone oil and aqueous SLES solution, 10 mN m−1 for a concentration of 0.84 g L−1. The interfacial tension between 50/50 wt% ethanol/water mixture and oil was 10 mN m−1.
The coalescence was studied by creating two drops from two metal capillaries (1.81 mm outer diameter) with independent syringe pumps (World Precision Instruments, model AL-1002X) aligned horizontally in a transparent cuvette, 45 mm height, 10 × 10 mm cross-section that was filled with various silicone oils (see Fig. 1). The bottom capillary was fixed in the holder whereas the top one was attached to a micromanipulation rig (THORLABS, Model BSC101 and Longshore Systems Engineering) allowing precise approaching speed of 0.01 mm s−1 in the vertical direction. Drops were formed by increasing volume to the desired diameter of drops (approx. 3 mm) by pumping the liquids (rate of 30 nL s−1) and minimal internal flow was observed. Subsequently, after the pumping was stopped and motionless conditions achieved, one of the capillaries moved (at 0.01 mm s−1) until the coalescence occurred. This sequenced procedure assured no internal flow at the moment of coalescence related to the drop growth.
The cell was lit by cold back light (Krüss Optronic, model KL5125) and the coalescence events were recorded with a high-speed camera (Photron SA3 or SA5) with additional objective (Navitar, 2X F-mount); this was used to zoom into the region of interest with varying frame rates depending on the type of measurements, e.g. simple visualisation, or PIV analysis (2000–10![[thin space (1/6-em)]](https://www.rsc.org/images/entities/char_2009.gif) 000 fps). The experimental results are presented next.
000 fps). The experimental results are presented next.
3. Experimental results and discussion
We begin the discussion of our results by considering the coalescence of drops of the same diameters, d, and interfacial tension, γ. As shown in Fig. 2a, this case is characterized by very little internal mixing, which is a well-established result.13,19 Upon drops merging, the resulting excess in surface energy (from having two smaller drops than the larger, post-coalescence drop) is dissipated via interfacial oscillations of the final drop, which, as is evident in Fig. 2a, take place on a time scale of the order of milli-seconds. The coalescence of asymmetrically-sized drops shown in Fig. 2b demonstrates that the small drop is injected into the larger one driven by a pressure gradient arising from a larger Laplace pressure in the smaller drop. In the present case, the magnitude of the pressure gradient is insufficient to cause a large degree of mixing: there is very little transport of particles from the smaller drop to the larger one during coalescence.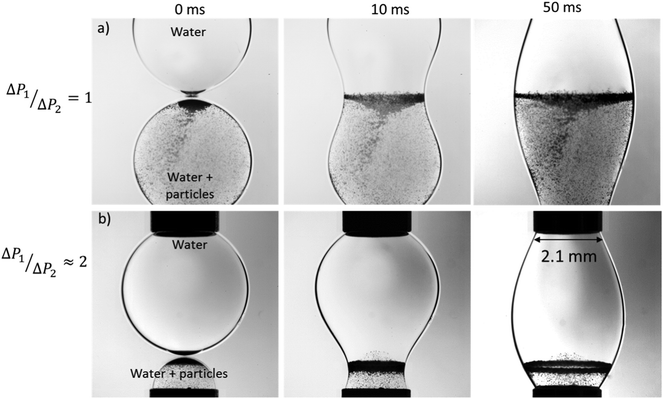 | ||
| Fig. 2 The stages of coalescence from the initial point of contact of equal-sized pure water droplets (one seeded with particles), (a), and unequal-sized droplets in 96 mPa s surrounding silicone oil, (b) (ESI,† S1). | ||
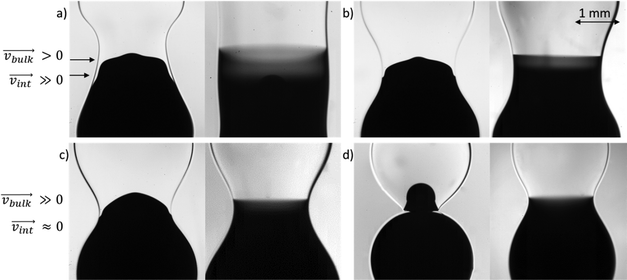
The effect of surfactant on the coalescence process is investigated next, and this is shown in Fig. 3 for various values of the Laplace pressure ratio; this ratio is achieved in a number of ways. In Fig. 3a, we consider the case of unity drop size ratio but an initial Laplace pressure ratio of ∼4 is due to the addition of surfactant to one of the drops. In this case, fluid flow is driven from the surfactant-free drop to the surfactant-laden one since the former has higher interfacial tension. As indicated by the motion of the particles, present initially in the surfactant-free drop only, this flow corresponds to a jetting motion, which injects the particles rapidly into the surfactant-laden drop.
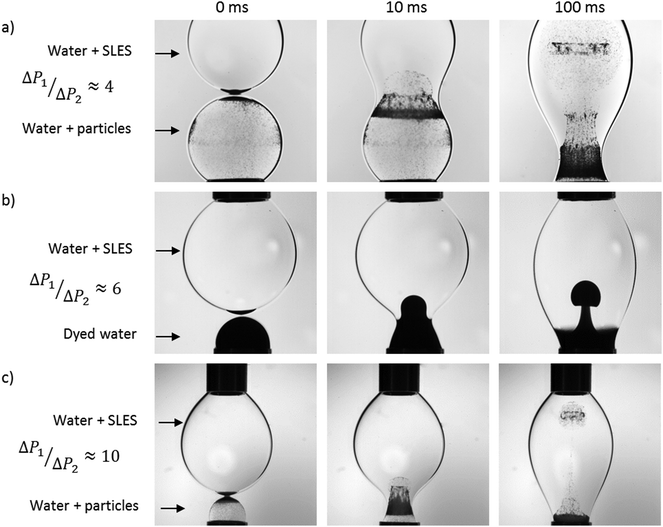 | ||
| Fig. 3 The stages of coalescence from the initial point of contact of surfactant-free and surfactant-laden drops of initially equal, (a), and unequal diameters, (b and c), in a 96 mPa s viscosity silicone oil (ESI,† S1). | ||
In Fig. 3b, the Laplace pressure ratio is increased to 6 by bringing together a small, surfactant-free drop (containing a surface-inactive dye) with a larger, surfactant-laden drop. Once again, it is seen clearly that the flow follows the direction of the pressure gradient. Here, the dyed fluid in the smaller drop assumes the shape of a plume though it is clear that the extent of penetration of the dyed fluid in the present case is considerably lower than that shown in Fig. 3a; this will be discussed further below. An increase in the Laplace pressure ratio, to a value of 10, resulting from a further decrease in the diameter of the smaller drop, leads to strong jetting motion, as demonstrated by Fig. 3c; here, the particles from the smaller drop penetrate very rapidly into the larger one.
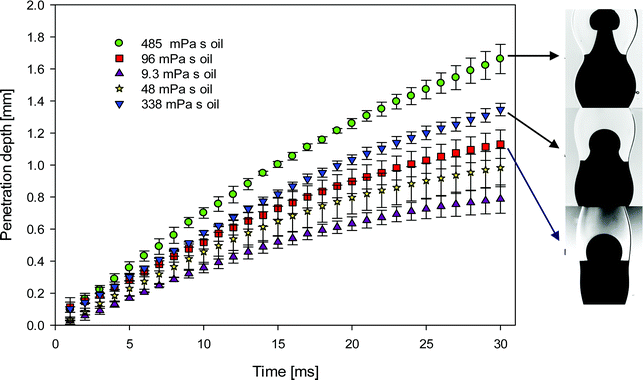
In order to quantify the degree of fluid penetration depicted in Fig. 2 and 3, we show in Fig. 4 the temporal variation of this depth, h, plotted parametrically for various Laplace pressure ratios. For the lowest value of this ratio, it is seen that h exhibits oscillatory behaviour, increasing during the earliest stages of the coalescence process, then decreasing to very small magnitudes, before increasing again. Increasing the pressure ratio from 2 to 4 leads to a substantial rise in h, whose rate diminishes with time. Although raising the pressure ratio from 4 to 10 results in a further rise in h, increasing this ratio from 4 to 6 leads to significantly lower terminal h values.
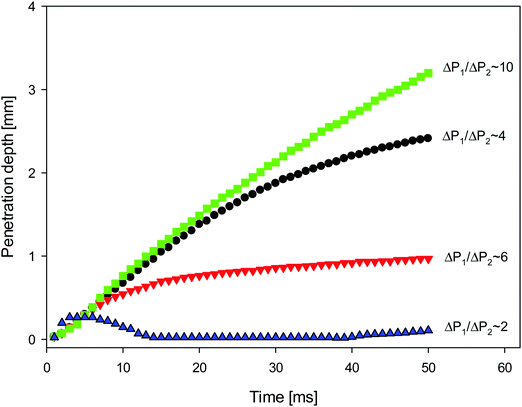 | ||
| Fig. 4 Temporal evolution of the penetration depth of the surfactant-free drop into surfactant-laden one as shown in Fig. 2 and 3. | ||
Clearly, the trend shown in Fig. 4 cannot be explained solely by appealing to the motion induced by the Laplace pressure differences. In the case of same interfacial tensions but different droplet size ratios (see panels (a) and (c) of Fig. 3), faster penetration occurs for the larger ratio of the Laplace pressures. However, a comparison of results presented in Fig. 3a and b, and the corresponding curves in Fig. 4, shows that the effect of the interfacial tension ratio is stronger than that of the drop size ratio. Indeed, the interfacial tension between silicone oil and particle-laden water (Fig. 3a) is 37 mN m−1, whereas that between silicone oil and aqueous Nigrosin solution (Fig. 3b) is 30 mN m−1. Thus the ratio of interfacial tensions between drops is 3.7 and 3 in Fig. 3a and b, respectively. The larger ratio of the Laplace pressures is because the diameter of the surfactant-free drop in Fig. 3b is half of that of the surfactant-laden one.
The trends shown in Fig. 3 and 4 may be due to the Marangoni flow along the interface separating the surfactant-laden drop and the exterior, oil phase, towards the surfactant-free drop, which, in turn, drive a return, upwards flow whose existence is dictated by mass conservation. This return flow acts to enhance the upwards bulk flow in the surfactant-free drop caused by the difference in the Laplace pressure. This hypothesis is explored later in the paper. Furthermore, as shown via inspection of Fig. 2b, and the corresponding curve in Fig. 4, which depict results for the coalescence of surfactant-free drops with no interfacial tension variations, the relaxation time-scale of size-induced Laplace pressure differences is rather rapid. In the case of drops of similar size, one of which is surfactant-laden, there is no essential difference in the radii of curvature after 10 ms, as shown in Fig. 3b, yet the velocity associated with Marangoni convection on this time-scale remains unchanged;17 that is, the difference in the interfacial tension between drops remains essentially constant despite Marangoni-driven surfactant transport. It can, therefore, be concluded that the difference in Laplace pressure due to size decreases with time much faster than that due to interfacial tension, implying that the latter ultimately controls the coalescence dynamics.
The characteristic relaxation time for coalescence of two drops of equal interfacial tension but different size can be estimated from the propagation time of a capillary wave caused by the capillary pressure difference between the drops over the characteristic length scale.20 In the considered case, both the characteristic length and the capillary wave length are of the order of the capillary diameter (d ∼ 2 mm). In this case gravity can be neglected and characteristic relaxation time
 | (1) |
In the case of surface tension induced difference in the capillary pressure between the drops there are two different characteristic time scales. The first is responsible for replenishment of surfactant onto the expanded interface of the surfactant-laden drop due to Marangoni flow and desorption of surfactant transferred by Marangoni flow into the bulk of the (initially) surfactant-free drop. This characteristic time scale can be estimated as
 | (2) |
The velocity of surface flow, Us for the considered system is 0.1–0.2 m s−1.17 Using the capillary diameter as a characteristic length scale for the interfacial flow, the characteristic time of interface deformation can be estimated as τd = d/Us ∼ 10–20 ms, i.e. it is close to the characteristic time of surfactant replenishment τσ. Therefore it can be expected that surfactant will be replenished at the surface of surfactant-laden drop and desorbed from the surface of the surfactant-free drop, provided the bulk concentration does not change considerably.
The second surfactant-related time-scale describes the equilibration of bulk concentration between the drops. There will be diffusion of surfactant from the surfactant-laden to surfactant-free drop, but this timescale τD = d2/D ∼ 104 s much larger than the time of the experiment. Taking into account the velocity of surface flow given above and assuming that surface concentration remains equal to the limiting adsorption value, the characteristic time corresponding to the transfer of 10% of surfactant from the surfactant-laden to the surfactant free drop by surface convection τσc > 100 ms. For the experiment time presented in Fig. 4 only around 4% of surfactant should be transferred, which would not noticeably change the interfacial tension difference between the drops.
In Fig. 5, we show snapshots of the interfacial shape of the merged drop, and of the bulk fluid distribution following the coalescence of surfactant-free and surfactant-laden drops. Results are shown for four values of the continuous phase viscosity; in each case, the coalescence of a surfactant-laden drop with a surfactant-free drop is contrasted with that of surfactant-free drops, with the rest of the parameters remaining fixed. Visualisation of the flow patterns within the merged drop was facilitated via injection of a dye into the surfactant-free drop in each case. Inspection of Fig. 5 reveals a qualitative difference between the coalescence of surfactant-laden and surfactant-free drops. At the lowest value of the viscosity ratio investigated (see Fig. 5a), the interfacial shape of the liquid bridge formed between the merged drops in the surfactant-laden case is markedly different from that in the surfactant-free case. The bridge takes on an amphora-like shape in the surfactant-laden case in contrast to that in the surfactant-free case which is essentially cylindrical. With increasing continuous phase viscosity, the shape of the surfactant-free bridge is no longer cylindrical, displaying an increased resemblance to that associated with the surfactant-laden case for all but the largest viscosity ratios studied; for these ratios, the two merged drops remain essentially spherical linked by a narrow region whose radial extent corresponds to a small fraction of the initial drop diameter. In all considered cases bridge diameter at coalescence of two surfactant-free drops is larger than at coalescence of surfactant-laden and surfactant free drop. Merging slows down in the latter case due to smaller capillary pressure in the surfactant-laden drop.
When the liquid bridge is formed between the drops following the coalescence event, the surfactant, present initially in the upper drop only, diffuses into the bottom drop while the gradients in surfactant interfacial concentration induce a Marangoni stress that transports surfactant from the upper drop to the lower one by interfacial convection. This stress also drives motion in the adjoining fluid in the bulk of the liquid bridge. At the lowest viscosity ratios studied, the external fluid does not exert a significant drag on the Marangoni-driven flow, and, as can be seen in Fig. 5a, (transparent) surfactant-laden fluid from the upper drop invades the lower one, moving counter-current to (dyed) fluid from the lower drop which penetrates the upper one. The latter motion is driven by a Laplace pressure gradient due to the difference in mean surface tension between the two drops. Close to the interface, it is opposed by the Marangoni flow, whereas close to the axis it can be reinforced by the return flow discussed above. With increasing continuous phase viscosity, the drag exerted on the interface becomes more significant, reducing the interfacial velocity. As shown in panel (b) and (c) of Fig. 5, the degree of penetration of the fluid from the upper (lower) drop decreases (increases) with increasing viscosity ratio. For the largest viscosity ratio, the Marangoni-driven flow is all but suppressed, and the flow of the lower drop fluid into the upper one resembles a jetting motion with the jet diameter corresponding approximately to the radial extent of the merged region following the coalescence event.
Close inspection of the dyed fluid in the lower drop shown in Fig. 5 reveals that the degree of diffusive mixing in the surfactant-laden case is significantly smaller than that in the surfactant-free case. In the latter case, the fluids in the two drops remain separated by a flat, diffuse ‘interface’ whose width grows rather slowly. Clearly, an enhancement in mixing occurs via the fast, convective motion of the jet of surfactant-free drop penetrating into the surfactant-laden one, which greatly increases the interfacial area for any slow, diffusion-driven mixing that may follow.
The shape of the jet formed by the injected dyed surfactant-free droplet and its rate of penetration into the surfactant-laden drop can be seen in Fig. 6. It can be noticed that with the increase of the surrounding oil viscosity the jet becomes narrower and has a larger penetration speed. Previously, it was shown that the interfacial flow is much faster in the lower viscosity surrounding oil, 0.26 m s−1 in 9.3 mPa s oil vs. 0.08 m s−1 in 96 mPa s oil.17 This arrested motion on the interface in high viscosity oils affects significantly the bulk motion of one drop in the other. It is seen in Fig. 6 that the difference in the penetration depth due to viscosity of surrounding oil increases with time. The penetration slows down earlier for the less viscous surrounding oil. There are two possible reasons for that. First the bridge between drops grows faster in the less viscous surroundings (see Fig. 5 and 6), therefore the radius of curvature in the axial direction also increases faster and related capillary pressure decreases more rapidly. Second, Marangoni flow and therefore surfactant redistribution is also faster in the less viscous surroundings, therefore the capillary pressure ratio due to difference in the surface tension also decreases faster.
In Fig. 7, we plot the temporal evolution of the jet width, taken to correspond to the horizontally-widest portion of the jet, as a parametric function of the surrounding oil viscosity. It is clearly shown that with increasing external phase viscosity, as the jet penetration rate increases (Fig. 6), the width of the jet decreases due to mass conservation.
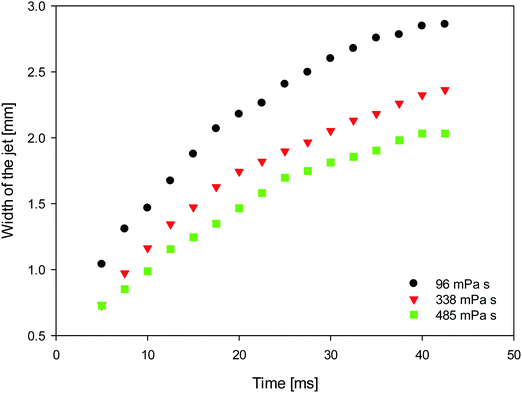 | ||
| Fig. 7 Temporal evolution of the width of the jets penetrating from the surfactant-free into the surfactant-laden drop as a parametric function of the viscosity of the surrounding oils. | ||
The evolution of the jet injection of the surfactant-free into surfactant-laden drop was followed using high speed bright field PIV which made possible measurement of the flows within the coalescing droplets. In Fig. 8, the lower drop is surfactant-free, whereas the upper one contains the surfactant. Particles are initially added to the surfactant-free drop only. The coalescence of surfactant-free drops (viz. the sequence of left-hand-side images) in Fig. 8 shows no evidence of internal advection and interfacial movement of the particles seeded inside. Here, coalescence occurs, and the drops become a single larger oscillating drop, before any significant mixing has taken place; all other silicone oils investigated gave rise to qualitatively similar observations. The coalescence in the surfactant-loaded case, on the other hand, is accompanied by internal flows generated by the confluence of the Marangoni effect (interfacial flow) and Laplace pressure-difference (bulk flow). These flows manifest themselves through the creation of a sufficiently strong central jet that reaches the top of the upper, surfactant-laden drop, and subsequent vortex-formation and enhanced mixing (viz. the right-hand-side sequence of images in Fig. 8).
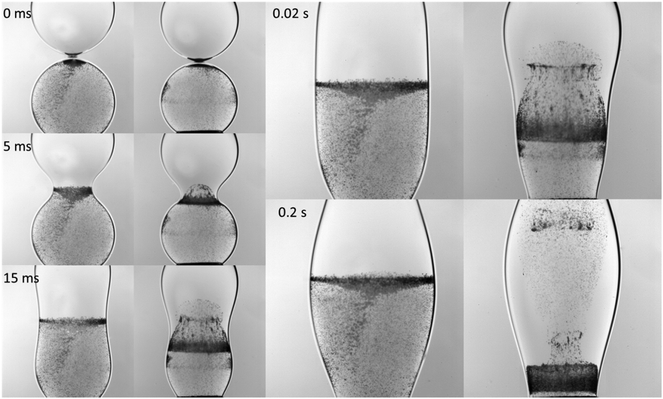 | ||
| Fig. 8 Sequence of the merging of the drops in the surrounding 96 mPa s silicone oil (see Movie S2 in ESI†). In each panel, corresponding to the certain time moment left hand-side image is for two surfactant-free drops, whereas right hand side image is for surfactant-laden and surfactant-free drops. | ||
To gain a better insight into the process of drop coalescence, the instantaneous velocity vectors (scaled green arrows) and velocity magnitudes in the drops at three different viscosities of the surrounding oil and at various stages of the drop coalescence are presented in Fig. 9 obtained using PIV. It is clearly shown that the highest velocity magnitudes are in the region of the jet. The velocities are largest at the early stages of coalescence, decreasing at the latter stages as the jet penetrates into the upper regions of the surfactant-laden drop. This type of jet-induced mixing was previously observed using μ-PIV visualisation in microfluidics channels, where the coalescence of two droplets showed the penetration or envelopment depending on the channel geometry.21 The velocity at the axis of the jet, was also examined and is plotted as a function of time in Fig. 10 for a range of external phase viscosities. For all values of viscosity, the velocity exhibits a well-defined maximum for an intermediate time during the coalescence process. The velocity increases with the increase of viscosity of surrounding oil.
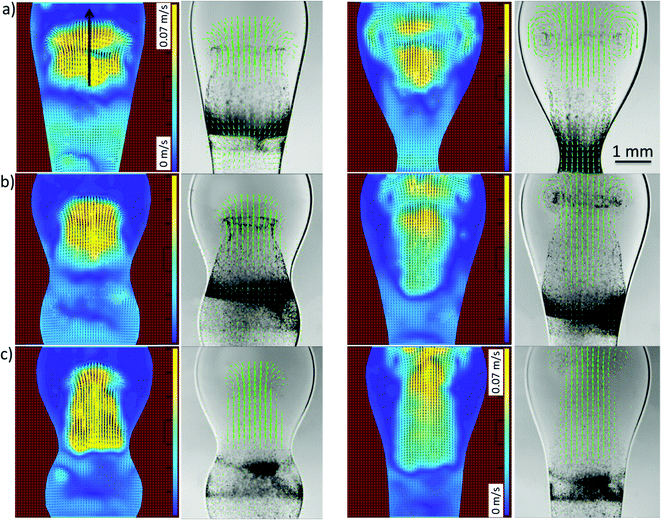 | ||
| Fig. 9 Velocity magnitudes and vectors at 25 ms (left columns) and 50 ms (right columns) in (a) 96 mPa s, (b) 338 mPa s and (c) 485 mPa s silicon oil obtained during the coalescence of surfactant-free (but particle-seeded) and surfactant-laden drops. The arrow indicates the axis of the jet penetrating into the surfactant-laden drop (see Fig. 10). | ||
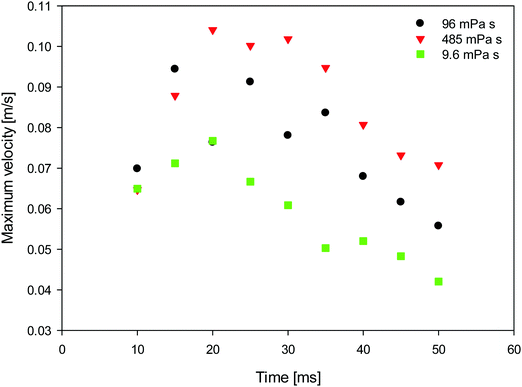 | ||
| Fig. 10 Temporal evolution of the maximum velocity at the axis of the jet (represented by the arrow on Fig. 9) during drop coalescence as a parametric function of oil viscosity. | ||
4. Comparison of drops coalescence with numerical simulations
In this section, we compare the experimental data to numerical predictions. For this purpose, experiments were carried out with droplets of two different liquids that differed in interfacial tension without surfactant included in either one of them. Two distinct droplets were formed: a water droplet, and a droplet of a 50% (by wt) ethanol/water solution. The ethanol/water, and the water droplets had 10 mN m−1 and 37 mN m−1 interfacial tensions with oil, respectively. As will be shown below, this difference in interfacial tension was sufficiently large to give rise to qualitatively very similar phenomena to those observed in the previous section in the presence of surfactant; this obviated the need to model the surfactant spatio-temporal dynamics explicitly. Instead, the coalescing drops were modelled as three-phase systems (water, ethanol–water solution, and oil) with two different interfacial tensions. The bulk penetration of the higher interfacial tension, water droplet into the ethanol/water solution droplet was observed using seeding particles, as shown in Fig. 13.A three-phase, three-dimensional Navier–Stokes numerical framework, Fluidity, is employed to study the coalescence problem, in which each drop is considered as a separate phase, with the surrounding fluid as a third phase. Each phase has its own fluid properties, such as density and viscosity, and the interfacial tension between each pair of phases is taken into account. This model is now outlined briefly below. Let αi be the mass fraction of phase i, where i = 1, 2, 3. The density and dynamic viscosity of phase i are thus defined as ρi and μi, respectively.
For each fluid phase i, the conservation of mass may thus be defined as:
 | (3) |
 | (4) |
 , the bulk dynamic viscosity is
  , g is the gravitational acceleration vector, and Fσ is the interfacial tension force. The above system of equations is subject to the constraint that
 | (5) |
The framework also features a novel interface capturing scheme based on the compressive control volume advection method,22 involving a high-order accurate finite-element method to obtain fluxes on the control volume boundaries; the latter are subject to flux-limiting using a normalised variable diagram approach to obtain bounded and compressive solutions for the interface. The implementation of capillary/surface tension force in the framework using an unstructured mesh minimises spurious velocities often found in interfacial flows.23 Finally, use of anisotropic, adaptive unstructured mesh24 allows the grid resolution to be concentrated in relatively important regions, such as the vicinity of interfaces, while lower resolution can be used in other regions; this leads to a significant gain in computational efficiency without sacrificing accuracy. The numerical framework has been employed to study various multiphase flow problems,25,26 and the dynamics of three-dimensional bubbles, droplet and liquid films.23,27
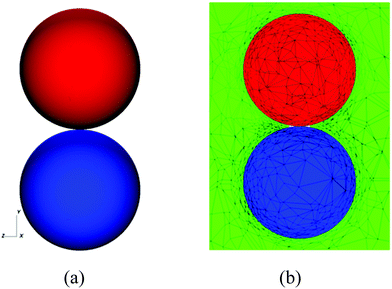
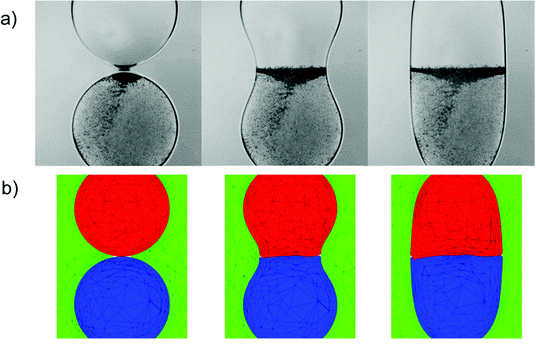
In order to carry out the computations, we take the initial shapes of the drops to be spherical, as shown in Fig. 11: we do not account for the fact that the drops are attached to two capillaries as is the case in the experiments (see Fig. 1). In Fig. 12, we present the results of a numerical simulation of the coalescence of two initially spherical water drops of the same initial diameter. The numerical predictions (shown in a two-dimensional cut plane) are in good agreement with the experimental observations. In particular, both the experiments and the simulations show that very little mixing or interfacial motion occurs in this case.
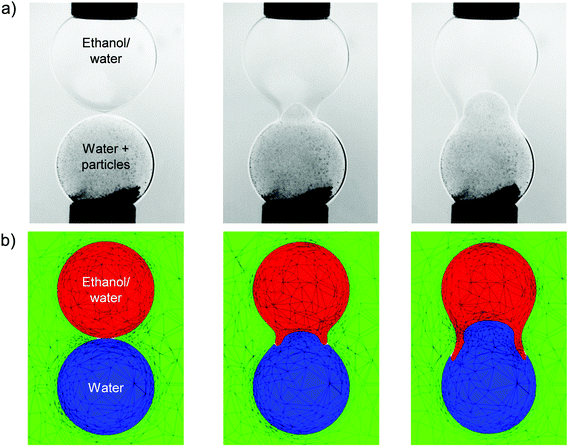
The dynamics described in Fig. 12 is in contrast with that observed for the coalescence of a drop of ethanol solution with a particle-seeded water drop, both of which are initially spherical and have identical diameters. As shown in Fig. 13, the coalescence process proceeds via the penetration of the droplet of higher interfacial tension, which corresponds to the particle-seeded water drop, into the lower interfacial tension, ethanol solution drop. As discussed in the previous section, this results directly from the difference in Laplace pressure inside the drops. The details of the interfacial motion are well captured by the corresponding simulations in Fig. 13: the water drop is deformed into the shape of a jet, which penetrates into the ethanol solution drop; this results in the formation of a thin annular layer of ethanol solution, which is dragged in the direction of the lower, water drop.
We also plot the penetration depth of the water drop into the drop of ethanol solution in Fig. 14 for the same parameters as those used to generate Fig. 13. Inspection of Fig. 14 reveals that the numerical predictions and the experimental data are in very good quantitative agreement over an extended period of the coalescence process, with deviations arising during the latter stages of coalescence. We attribute this divergence to the fact that the capillaries to which the drops are attached are absent from the model. It is also noteworthy that the ethanol solution/water/oil experimental results shown in Fig. 13 and 14 are in qualitative agreement with those presented in the previous section, which are associated with the SLES solution/water/oil system; this indicates that the mechanisms underlying the phenomena reported in this paper are generic, and do not depend on the detailed chemical nature of the surfactants under consideration.
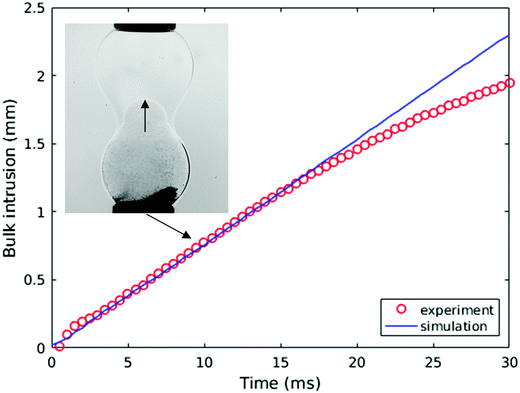 | ||
| Fig. 14 Experimental and numerical comparison of the rate of bulk intrusion of water drop (seeded with particles) into the ethanol/water drop in 96 mPa s oil. | ||
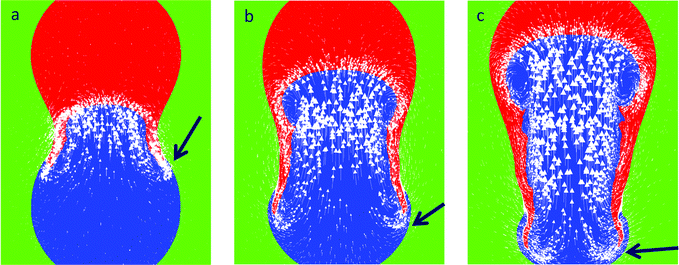
Analysis of the development of the predicted velocity field inside the coalescing drops, shown in Fig. 15, also shows very good agreement with the experimental results presented in Fig. 9. It can be seen that the larger velocities are in the jet region, where the surfactant-free fluid penetrates the surfactant-laden drop. Fig. 15 also confirms the presence of a return flow, as indicated by the arrows in Fig. 15.
5. Conclusions
This study has shown that that the coalescence of two dissimilar drops is accompanied by convective mixing within the drops driven by the difference in the capillary pressure. The driving force for mixing associated with difference in interfacial tension is considerably stronger than that related to the drop size because (i) difference in the capillary pressure due to the difference in interfacial tension persist during long time (tens of millisecond) due to surfactant adsorption from the bulk to the surface of (initially) surfactant-laden drop and surfactant desorption from the surface to the bulk of (initially) surfactant-free drop; (ii) Marangoni flow provides additional contribution to the mixing in the bulk.A comparison of the penetration kinetics associated with the merging of pure water drops with drops of either SLES surfactant or 50 wt% ethanol-in-water solution has shown that there is a negligible effect of the precise chemical composition on the generic features of the coalescence dynamics at the studied concentrations. The characteristics of the penetrating jet depend on the viscosity of the surrounding fluid oil: an increase in the oil viscosity results in a narrower jet, and a larger penetration depth. Immediately after coalescence, the jet velocities are comparable for the various oils considered in the present study, but the penetration rate reduces earlier for oils of lower viscosity.
Particle-image-velocimetry (PIV) experiments have shown that the jet velocity has a maximum along the drop axis at an intermediate time-scale in the lifetime of the coalescence process. PIV has also demonstrated vortex formation at the leading edge of the penetrating jet.
Transient, three-dimensional numerical simulations of drop coalescence yielded predictions that are in good qualitative and quantitative agreement with all the flow features observed in the experiments for the same system. The main mechanisms underlying the coalescence process are adequately described by the numerical model, which takes into account the difference in Laplace pressure of the two drops owing to variances in their size and interfacial tension. Numerical study confirmed that Marangoni flow contributes to the bulk mixing at the coalescence of drop having different interfacial tension.
Acknowledgements
This work is funded by the Engineering and Physical Sciences Research Council, UK, Programme Grant “MEMPHIS – Multiscale Examination of Multiphase Physics in Flows” (through grant number EP/K003976/1).References
- N. T. Nguyen and W. Zhigang, J. Micromech. Microeng., 2005, 15, R1 CrossRef.
- H. Song, D. L. Chen and R. F. Ismagilov, Angew. Chem., Int. Ed., 2006, 45, 7336 CrossRef CAS PubMed.
- V. Srinivasan, V. K. Pamula and R. B. Fair, Lab Chip, 2004, 4, 310 RSC.
- B. Zheng, L. S. Roach and R. F. Ismagilov, J. Am. Chem. Soc., 2003, 125, 11170 CrossRef CAS PubMed.
- L. H. Hung, K. M. Choi, W. Y. Tseng, Y. C. Tan, K. J. Shea and A. P. Lee, Lab Chip, 2006, 6, 174 RSC.
- S. Sugiura, T. Oda, Y. Izumida, Y. Aoyagi, M. Satake, A. Ochiai, N. Ohkohchi and M. Nakajima, Biomaterials, 2005, 26, 3327 CrossRef CAS PubMed.
- H. Shintaku, T. Kuwabara, S. Kawano, T. Suzuki, I. Kanno and H. Kotera, Microsyst. Technol., 2007, 13, 951 CrossRef CAS.
- S. T. Thoroddsen, K. Takehara and T. G. Etoh, J. Fluid Mech., 2005, 527, 85 CrossRef.
- S. T. Thoroddsen, B. Qian, T. G. Etoh and K. Takehara, Phys. Fluids, 2007, 19, 072110 CrossRef.
- J. D. Paulsen, J. C. Burton and S. R. Nagel, Phys. Rev. Lett., 2011, 106, 114501 CrossRef PubMed.
- J. D. Paulsen, R. Carmigniani, A. Kannan, J. C. Burton and S. R. Nagel, Nat. Commun., 2014, 5, 3182 Search PubMed.
- S. I. Yeh, W. F. Fang, H. J. Sheen and J. T. Yang, Microfluid. Nanofluid., 2013, 14, 785 CrossRef CAS.
- A. V. Anilkumar, C. P. Lee and T. G. Wang, Phys. Fluids A, 1991, 3, 2587 CrossRef CAS.
- M. R. H. Nobari and G. Tryggvason, The flow induced by the coalescence of two initially stationary drops, National Aeronautics and Space Administration, Lewis Research Center, Institute for Computational Mechanics in Propulsion, Cleveland, Ohio, 1994 Search PubMed.
- F. Blanchette, L. Messio and J. W. M. Bush, Phys. Fluids, 2009, 21, 072107 CrossRef.
- F. Blanchette, Phys. Rev. Lett., 2010, 105, 074501 CrossRef PubMed.
- E. Nowak, N. M. Kovalchuk, Z. Che and M. J. H. Simmons, Colloids Surf., A, 2016, 505, 124 CrossRef CAS.
- W. Thielicke and E. J. Stamhuis, J. Open Res. Software, 2014, 2, e30 Search PubMed.
- C. Tang, J. Zhao, P. Zhang, C. K. Law and Z. Huang, J. Fluid Mech., 2016, 795, 671 CrossRef CAS.
- V. G. Levich, Physicochemical hydrodynamics, Prentice-Hall, 1962 Search PubMed.
- B. J. Jin and J. Y. Yoo, Exp. Fluids, 2012, 52, 235 CrossRef CAS.
- D. Pavlidis, J. L. M. A. Gomes, Z. Xie, J. R. Percival, C. C. Pain and O. K. Matar, Int. J. Numer. Methods Fluids, 2016, 80, 256 CrossRef.
- Z. Xie, D. Pavlidis, P. Salinas, J. R. Percival, C. C. Pain and O. K. Matar, Comput. Fluids, 2016, 138, 38 CrossRef.
- C. C. Pain, A. P. Umpleby, C. R. E. de Oliveira and A. J. H. Goddard, Comput. Methods Appl. Mech. Eng., 2001, 190, 3771 CrossRef.
- Z. Xie, D. Pavlidis, J. R. Percival, J. L. M. A. Gomes, C. C. Pain and O. K. Matar, Int. J. Multiphase Flow, 2014, 67, 104 CrossRef CAS.
- D. Pavlidis, Z. Xie, J. R. Percival, J. L. M. A. Gomes, C. C. Pain and O. K. Matar, Int. J. Multiphase Flow, 2014, 67, 85 CrossRef CAS.
- Z. Xie, G. F. Hewitt, D. Pavlidis, P. Salinas, C. C. Pain and O. K. Matar, Chem. Eng. Sci., 2017, 166, 303 CrossRef CAS.
Footnote |
| † Electronic supplementary information (ESI) available. See DOI: 10.1039/c7sm00328e |
| This journal is © The Royal Society of Chemistry 2017 |

