 Open Access Article
Creative Commons Attribution 3.0 Unported Licence
Structures in the meniscus of smectic membranes: the role of dislocations?
M.
Selmi
ac,
J.-C.
Loudet
 *a,
P. V.
Dolganov
b,
T.
Othman
c and
P.
Cluzeau
a
aUniversité de Bordeaux, CNRS, Centre de Recherche Paul Pascal, Avenue A. Schweitzer, F-33600 Pessac, France. E-mail: loudet@crpp-bordeaux.cnrs.fr
bInstitute of Solid State Physics, Russian Academy of Sciences, Moscow Region, 142432 Chernogolovka, Russia
cUniversité de Tunis El Manar, Faculté des Sciences de Tunis, LR99ES16 Laboratoire Physique de la Matière Molle et de la Modélisation Electromagnétique, 2092, Tunis, Tunisia
First published on 18th April 2017
Abstract
We report an experimental investigation of the structure of periodic patterns observed in the meniscus of free-standing smectic films. Combination of polarizing optical microscopy and phase shifting interferometry enabled us to obtain new information on the structure of the meniscus, and in particular, on the topography of the smectic–air interface. We investigate the profile of the undulations in the striped structure in the thin part of the meniscus, change of the stripe period with the meniscus thickness and subsequent transition into a two-dimensional structure. It is shown that the two-dimensional structure has an unusual complex profile of “egg-box” type. The striped texture occurs upon cooling from the nontilted smectic-A to the smectic-C* phase, whereas the two-dimensional pattern is present in both phases. We discuss the possible origin of the modulated structures, the role of the dislocations in the meniscus, the elasticity of smectic layers, and the mechanical stress induced by dislocations.
1 Introduction
Free-standing smectic films (FSFs) are well-known to serve as excellent model systems for 2-dimensional (2D) liquids. They bear similarities to soap films, made from mixtures of water and surfactant molecules, and consist of molecular layers parallel to upper and lower free surfaces. The film is connected to a supporting solid boundary (of rectangular or circular geometry) by a meniscus. Unlike soap films, the partial ordering of the molecules inside each layer imparts elastic properties to FSFs, whose thickness can be finely tuned from thousands of layers down to 2 layers thanks to thinning transitions.1,2 In smectic-A and smectic-C phases (noted SmA and SmC, respectively), there is no positional order of the molecules within the layers, and the corresponding films can be considered as 2D isotropic (SmA phase) or anisotropic (SmC phase) liquids. In the SmA phase, the long axes of the molecules are perpendicular to the layer plane, whereas in the SmC phase (noted SmC* for chiral compounds) the molecular long axes are tilted with respect to the layer plane normal. In the latter case, projections of the molecular long axes on the layer plane define the so-called c-director, which can reorient in the layer plane. However, deformations of the c-director field cost elastic energy.1,3The meniscus in smectic films is of paramount importance in many aspects. It controls the film stability, the disjoining pressure, the defect dynamics (dislocations) as well as phenomena related to elastic interactions and self-organization of colloidal inclusions in smectic films.4,5 The physical properties of smectic menisci greatly differ from those of isotropic liquids. Among the main differences, we may cite the meniscus circular profile, the existence of a nonzero contact angle between the meniscus and the film, and the fact that the film can support a normal elastic stress.1 Recently, it was shown that the difference is essentially a bit deeper. The meniscus free surface in SmC (SmC*) films exhibits nontrivial undulations, which manifest themselves optically in a quasi-periodic striped pattern parallel to the thickness gradient.6–9 The patterns are long lived and remain as long as the smectic film is stable. These experiments clearly show that LC menisci can be rugged, in contrast to their isotropic counterparts. This is obviously a direct consequence of the elastic properties of smectics.
Striped textures in the meniscus of the SmC films were first evidenced by Meyer and Pershan.10 They interpreted the patterns as a result of a surface polarity-induced c-director splay: since a uniform splay deformation cannot be achieved, a series of domains with a uniform c-director splay forms; each domain is separated from its neighbors by disclination sheets extending over a short distance into the film. Seemingly similar splay domains, together with additional features, were also noticed by Maclennan in the meniscus of smectic ferroelectric compounds.11 Dhara et al.12 and Smalyukh et al.13 further explored the behavior of FSFs made of twist grain boundary TGBA and undulating twist grain boundary UTGBC* compounds. Optical microscopy observations reveal that the meniscus of these LCs also exhibits radial stripes with a varying periodicity that depends on the meniscus thickness. However, the authors found that these domains are not consistent with Meyer's original splay model.10 Using Fluorescence Confocal Polarizing Microscopy (FCPM), they clearly demonstrated that the stripes actually correspond to layer undulations in the bulk of the meniscus. Additional interest in the field was later fueled by the first observation of corona patterns in the small meniscus surrounding solid micro-particles embedded in SmA films.14 As in ref. 13, the authors attributed the modulation to bulk layer undulations due to dilative strain caused by the meniscus curvature,  , which induces a transverse pressure gradient equal to
  , where γsa is the smectic-air surface tension. And it is well-known that smectics can minimize their energy through a buckling of the layers above a critical dilative strain.15,16 However, layer undulation was not experimentally demonstrated in the work of Conradi et al. Harth and Stannarius confirmed the existence of striped domains encircling micrometer-sized glass particles and glycerol drops trapped inside smectic films, as well as in the outer meniscus close to the holding frame.6 Upon testing a variety of compounds, they noticed that the patterns only existed in the tilted SmC and SmC* phases but not in the SmA phase. Indeed, the stripes start to appear at the SmA–SmC (SmC*) transition and are very sensitive to temperature. The same authors also showed that the director structure was actually more complicated than that of Meyer's model and that the presence of stripes is not related to the chiral nature of the compounds. Furthermore, using both optical and Atomic Force Microscopy (AFM) methods, Loudet et al.9 and Harth et al.7 clearly demonstrated that the linear stripes are associated with undulations of the smectic free surface in the SmC phase. In ref. 9, it was suggested that undulations originate from a mechanically-induced instability at the SmA–SmC transition due to the contraction of the layers. Assuming a constant layer number, this contraction is constrained by the strong anchoring of the film to the outer wall. The resulting mechanical stress induces a dilation which then triggers the buckling of the smectic layers.15,16 However, despite this likely scenario, several distinct features of the striped patterns remain to be explained, namely: (i) formation of the modulated texture in the meniscus (i.e. in a region with thickness gradients) and its absence in flat regions of the film irrespective of its thickness; (ii) the modulation is always perpendicular to the thickness gradient; (iii) the dependence of the stripe period on the sample thickness.
In this article, we present new experimental data that shed some light on the physical mechanisms that drive the formation of the meniscus structures. We made an extensive use of optical microscopy and phase shifting interferometry (PSI) methods to probe the director field and the meniscus profile in both thin and thick regions as a function of temperature. In the thick zones, we show that the texture consists in a 2-dimensional array made of focal conic domains (FCDs), featuring a very bumpy smectic free surface with dimples exceeding 250 nm. FCDs are present in both SmC and SmA phases and are very likely to originate from giant edge dislocations as we will see below. Since the transition between the radial stripes and the FCDs is “continuous”, i.e. there exists a crossover region, it is suggested that dislocations play also an essential role in catalyzing the undulation instability at the SmA–SmC transition. In fact, we show that a scenario based on dislocations is able to address the points listed above and can account for most of the meniscus structures.
Understanding these phenomena is a necessary prerequisite prior to dealing with the interactions and the self-organisation of an assembly of exogenic inclusions, e.g. solid micro-particles, trapped in FSFs. As recalled above, radial wrinkles also decorate the small meniscus, or wedge, around the particles, just like in the outer meniscus of FSFs. In fact, both the director field and free surface distortions are intertwined in these phenomena, leading to potentially very interesting elasto-capillary interactions, which have received little attention so far.17–20
The article is organized as follows. Experimental details, dealing with the preparation of FSFs and their characterization via optical methods, are described in the next section. Section 3 is devoted to the experimental results. We offer detailed characterization of the various patterns that decorate the FSF meniscus. The meniscus surrounding the micro-particles embedded in the film is also briefly analyzed. A discussion is presented in Section 4. As aforesaid, we propose a general interpretation based on the presumably important role of dislocations that are ubiquitous in the meniscus. A brief summary and some prospects (Section 5) close the paper.
2 Experimental details
Free-standing smectic films were standardly prepared by spreading a small amount of a smectic liquid crystal over a 3 mm circular opening, drilled in a 1 mm thick glass slide. Three ferroelectric compounds, namely ZLI-3488 (bulk phase sequence: Iso [85 °C] N [66 °C] SmA [61 °C] SmC*),21 SCE-9 (Merck, England; bulk phase sequence: Iso [116 °C] N* [80 °C] SmA [70 °C] SmC*), and SCE-12 (Merck, England; bulk phase sequence: Iso [117 °C] N* [81 °C] SmA [71 °C] SmC*), were used in all our experiments. The films were created either in the high-temperature SmA phase or directly in the SmC* phase at room temperature. Prior to any measurements, the films were let to homogenize at constant temperature for several hours, until they were uniformly colored, as checked in reflected light optical microscopy. We used the Newton color chart to estimate the membrane thickness, which was typically less than 1 μm after film relaxation.A few experiments were dedicated to the observation of the meniscus around micrometer-sized particles embedded in the smectic membrane. For that purpose, a very dilute aqueous dispersion (mass fraction ≪0.01%) containing either polystyrene (PS) spheres (Polysciences, diameter 10 μm) or prolate ellipsoids (see ref. 22 and 23 for the fabrication process) was then sprayed in the air above the FSF with a fine nozzle, after film relaxation. The water drops evaporated quickly while a few particles gently landed on the film where they got trapped without rupturing the film provided it was not too thin. In all cases, the particle size was always larger than the film thickness (≲1 μm); and in both the SmA and SmC* phases, a meniscus of finite spatial extension systematically surrounds the particles, meaning that the used smectic compounds actually wet the particle surface. The smectic membrane is therefore strongly deformed in the vicinity of particles as we will see in more detail hereafter.
We used polarized and depolarized optical microscopy (in both transmitted and reflected light) and phase shifting interferometry to characterize the textures observed in the menisci of FSF. PSI is a powerful technique to compute the phase of an object wave and thereby determine optical path differences with nanometer resolution. Here, we applied it to probe the topography of the smectic–air interface in the meniscus region as a function of temperature thanks to a home-made hot stage designed to accommodate the FSF samples. The basic principles of PSI and details of our experimental setup can be found elsewhere.24,25
3 Results
3.1 Textures in the outer meniscus
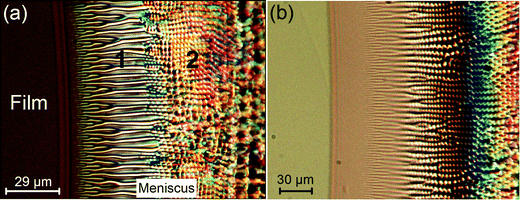
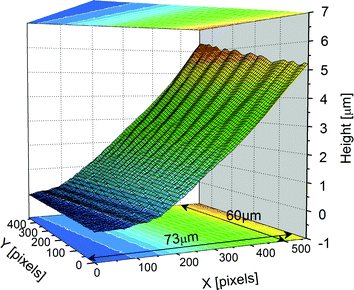
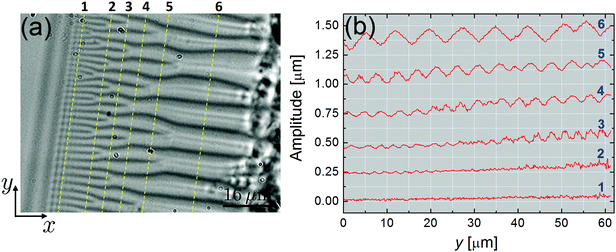
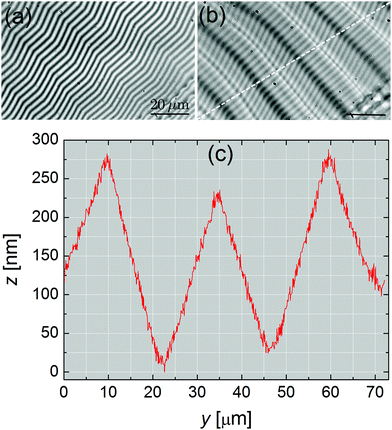
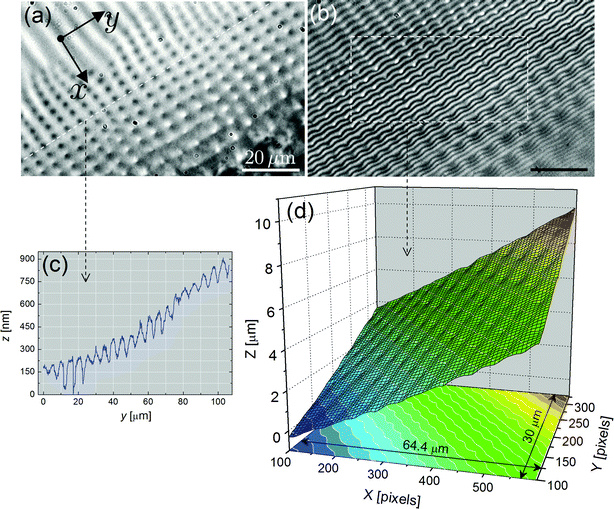
In this section, we provide valuable information on the patterns that decorate the meniscus of FSF thanks to optical microscopy observations and extensive PSI measurements at the smectic–air interface. Different regions are clearly visible in the meniscus of Fig. 1a: (i) the flat film, (ii) edge dislocations near the meniscus, (iii) a 1D structure made of radial stripes (label 1) with a varying periodicity, (iv) a crossover region from a 1D to a 2D structure, and (v), a 2D structure consisting of focal conic domains (FCDs) (label 2), again with a varying periodicity. The flat film region (simply named “film” in the following), in the center of the sample, remains free of any pattern in all our experiments. In the following, we will mainly focus on the 1D and 2D structures.In the SmC (or SmC*) phase, radial stripes are known to correspond to both c-director splay distortions6,10 and undulations of the smectic–air interface.7–9 The latter phenomenon is further illustrated in the optical microscopy images of Fig. 2. The interference fringes (PSI) are not straight but rather distorted in the presence of stripes (Fig. 2b), which is not the case in the SmA phase where the stripes are absent. The stripes are directly responsible for the wavy character of the fringes and this is best seen in Fig. 2c, where a bright-field image and the corresponding interferogram have been superimposed. The meniscus free surface is rugged, as revealed by the 3D reconstruction of Fig. 3, obtained through PSI measurements. Crests and valleys are clearly visible. The average slope in this area is usually below 10% within our experimental conditions.
The data of Fig. 4 show the evolution of the undulations as a function of the distance x to the film. The greater the x value, the thicker the meniscus. As aforesaid, both the amplitude, u0, and the wavelength, λ, of the undulations are increasing functions of x. If we make a simple analogy to the planar case, it is indeed expected that λ grows with the sample thickness h.15,16 We will come back to this point in the discussion part.
In the thick stripes area (curve 6 on Fig. 4b), the undulations are no longer sinusoidal and exhibit a saw-tooth profile with u0 ≳ 100 nm and λ ∼ 5–10 μm. This is even more spectacularly illustrated in Fig. 5 in the case of very large stripes, just before the FCD network. There, u0 > 200 nm and λ ≃ 30 μm. In contrast, close to the film (e.g., curves 1 & 2 in Fig. 4b), the amplitude of the modulation is below our experimental resolution (∼5 nm). Similar features, for both u0 and λ, were found with atomic force microscopy measurements carried out directly on the meniscus of FSFs.7
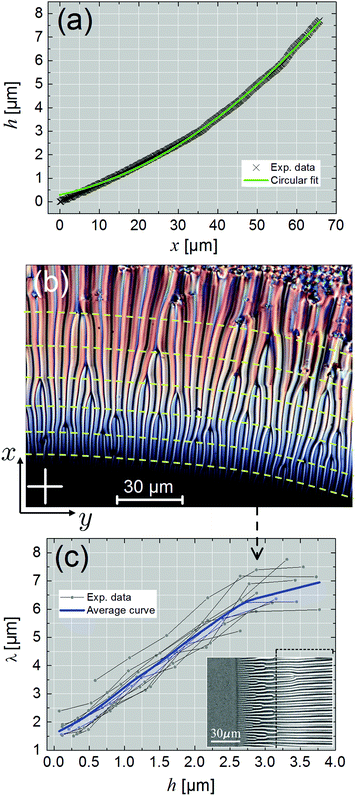
We may use the PSI data to examine the meniscus profile in the stripe region. This is displayed in Fig. 6a, where the meniscus height relative to the film, h, is plotted as a function of x. According to ref. 26 and 27, the profile should be circular, which is reasonably verified by the best circular fit to the experimental points. The typical curvature radius, R, deduced from the fits, is in the range (400–600) μm. From the average slope of Fig. 6a, we expect a rather high density of (edge) dislocations in the striped area, approximately one per 20 nm (assuming they remain single), from a simple geometrical estimate.
Use of the circular fit in Fig. 6a allows us to plot the variations of λ versus h, at various positions in the meniscus (Fig. 6b). The corresponding graph is exhibited in Fig. 6c, where it is seen that λ grows with h, but tends to level out at “large” h. This can be attributed to the fact that, quite often, the big stripes extend over a large length scale (>40 μm) with a uniform periodicity, as illustrated by the photograph inserted at the bottom right corner of Fig. 6c. A plateau is therefore expected in the λ(h) graph. No simple scaling can be inferred from the data of Fig. 6c, in contrast to the “historical” planar geometry for which  , where d is the sample thickness.15,16 In ref. 6, the authors reported a linear relationship between λ and h.
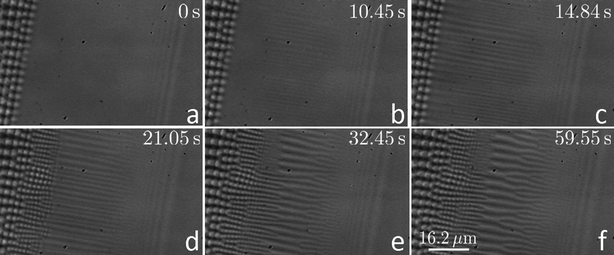
The striped domains are very sensitive to temperature, as shown previously:6,8,9 on heating to the SmA phase, the stripes become less contrasted and gradually disappear (Fig. 1b). Just above the SmA–SmC (or SmC*) transition temperature, TAC, the existence of stripes can be attributed to surface-induced molecular tilt: the tilt angle is nonzero, albeit small, only near the surface of the film.6 Well above TAC, the stripes disappear completely, while most of the FCD network holds. In this case, a sharp boundary exists between the FCDs and the defect-free area of the meniscus (Fig. 7a). Upon cooling back to the SmC* phase, the stripes reappear; the whole process is very reproducible over numerous heating and cooling cycles. However, it is important to note that the stripes pop out rather suddenly just below TAC and span the whole range of region 1 in the form of thin, straight periodic wrinkles (see Fig. 7b and c) with a period ≈2 μm. Upon further cooling, small FCDs start to nucleate on thick stripes (Fig. 7d; see also Fig. 1b) and the stripes start to branch (Fig. 7e and f). The transitional region between the 1D and 2D structures is no longer sharp and most stripes become curved a little. At lower temperature, the textures become more and more contrasted because of greater molecular tilt.
Note that, at constant temperature, the 1D structure shown here is long lived and survives for many months. As long as the film is stable, the structure is conserved. This situation differs greatly from the undulation instability in a sandwich cell, which is metastable, and disappears after a few seconds because dislocations glide between layers to relax the stress.1,3,15,16,28 We will further comment on this point in Section 4.
To end this section, let us mention that very similar striped patterns, with a varying periodicity, were also reported in the meniscus of twist grain boundary (TGB) LCs featuring SmA and SmC* blocks.13
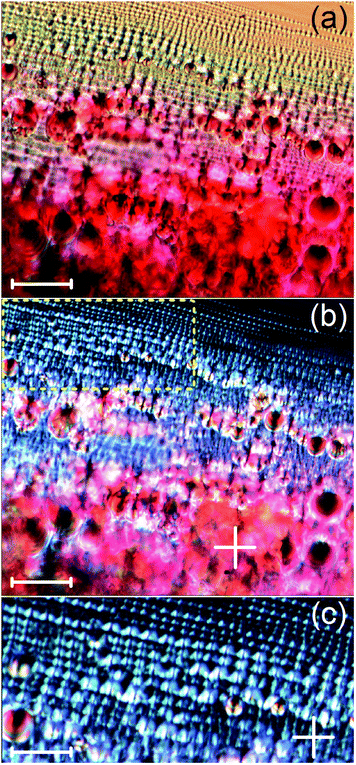 | ||
| Fig. 8 Optical microscopy pictures of the FCD network (transmitted light, compound SCE-9, SmC* phase at T = 25 °C). (a) Bright-field image. The meniscus thickness increases from top to bottom. Rounded and colorful domains of tens of micrometers can be observed in the thickest zones. Scale bar: 33.5 μm. (b) Corresponding polarization image recorded between crossed polarizers, whose directions are indicated by the white cross. The focus was made in the thin parts of the meniscus, such as that marked by the dashed yellow rectangle, which is enlarged in (c). Scale bar: 33.5 μm. (c) Zoomed-in view of the area enclosed by the dashed yellow rectangle drawn in (b). The bright brushes and the dark lines within domains seem to be consistent with those observed for type I-FCDs (FCDs), as in ref. 29 (see text for details). Scale bar: 17.8 μm. | ||
Like the 1D structure described previously, the 2D FCD network is also sensitive to temperature, but to a lesser extent. Deep in the SmA phase, small FCDs begin to fade away row by row, starting from the thinner region. But large FCDs still remain with a high contrast in the thickest regions of the meniscus. Close to the nematic–smectic (or cholesteric–smectic) transition, FCDs eventually disappear completely in the meniscus. Like the radial stripes, FCDs survive for many months, as long as the film is stable. A similar 2D lattice was also mentioned in ref. 8.
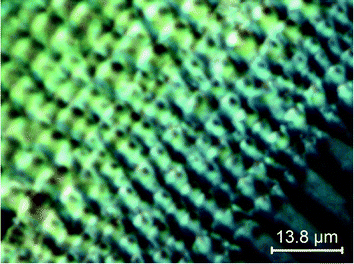
PSI measurements show that the interference fringes are quite distorted and pinned within each FCD. The fringes form rounded arches (Fig. 9b), unlike the chevron-like fringes obtained with stripes (Fig. 2b and 5a, b). The resulting 3D profile reveals that the smectic–air interface in this area consists of a regular array of depressions and hills, leading to an “egg-box” like structure (Fig. 9d). The graph of Fig. 9c clearly indicates that each depression, with amplitudes up to 150 nm, is associated with the dark area located in the center of each domain. Even greater dimple amplitudes, exceeding 250 nm, can be measured in thicker regions of the meniscus with bigger domains, which are less ordered (Fig. 10). In this area, the 3D plot of Fig. 10e gives evidence that the smectic–air interface is very bumpy with significant pinches.
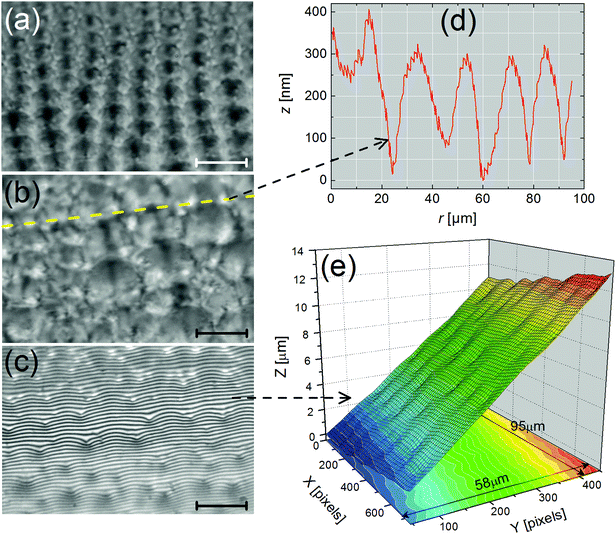 | ||
| Fig. 10 Characterization of FCDs in the meniscus (thick zone) (compound SCE-12, T = 25 °C). (a and b) Bright-field optical microscopy images recorded at two different locations. In (a), the meniscus thickness is less than in (b). The domain size grows as the meniscus thickens but the spatial organization of FCDs becomes less ordered. (c) Interferogram corresponding to (b). As in Fig. 9b, the interference fringes are strongly pinned at the centers of the domains. (d) Height profile along the oblique dashed cut plotted in (b). The dimple amplitudes can exceed 250 nm. (e) 3D profile obtained from PSI via a series of interferograms such as the one in (c). In this area, the smectic free surface appears very bumpy. Scale bar on all images: 20 μm. | ||
All these results show that the reported focal domains are likely to correspond to “type I” FCDs (just noted FCDs hereafter), where the smectic layers bend to form singular points, which are all arranged in two conjugate conics: an ellipse at the basis of the FCD, and a branch of hyperbola that passes through one of the foci of the ellipse (see e.g.ref. 29). This is further supported by the dark dots seen in the center of (small) FCDs under polarized microscopy which, most probably, mark the location of hyperbolae (Fig. 11). The presence of such dark dots was also reported in ref. 30–32 for FCDs forming on curved smectic interfaces in the vicinity of colloidal particles and micropillars. All our data, in particular the dimple amplitudes and the surface topography, are very consistent with previous characterization of FCDs, whether in confined geometries,29,33–37 or on curved interfaces around colloids and microposts.30–32,38 However, the mechanism that drives the formation of FCDs in FSF is likely to be different than that highlighted in previous works on smectic films with hybrid boundary conditions.29–38 We will discuss this point below.
3.2 Wedge around colloidal particles
In this section, we briefly mention a few observations about the meniscus, or wedge, around solid particles embedded in the flat film area of the FSF. Our goal here was to reproduce and complement the already thorough observations reported in ref. 4, 6 and 14, using our experimental conditions.The particles were placed on the films using a spraying technique, as described above (Section 2). In all cases, the particle size was greater than the film thickness and the inclusions were always surrounded by a significant smectic wedge of finite extension. Edge dislocations can be clearly distinguished at the periphery of the wedge (Fig. 12b) and the boundary between the wedge and the film is very sharp (Fig. 12a and c).
 | ||
| Fig. 12 Optical photographs of colloidal inclusions (here, ellipsoids) trapped in the FSF (compound ZLI-3488). (a) SmA phase (reflected light). The menisci around each inclusion is smooth and free of any texture. The film thickness is very homogeneous, as indicated by the uniform pink color. The dashed arrow in the bottom left corner indicates the presence of FCDs in the thick area of the outer meniscus. As mentioned in the text, most FCDs remain in the SmA phase. Scale bar: 39.5 μm. (b) SmC* phase (transmitted light). The meniscus around the ellipsoid is decorated with radial stripes, just as in the thin areas of the outer meniscus (cf. region 1, Fig. 1). Scale bar: 15.6 μm. (c) Typical interferogram obtained for an adsorbed ellipsoid such as that in (b). The interference fringes are deformed and also reflect undulations of the free surface, like in the outer meniscus (cf.Fig. 2). However, the amplitudes are much smaller, of the order of 20 nm, i.e. close to the resolution limit of our PSI technique. Scale bar: 11.3 μm. | ||
In the SmA phase, the wedge around each particle is homogeneous and free of any textures (Fig. 12a). But this is not so in the SmC* phase where a pattern made of branched stripes occurs (Fig. 12b). These stripes, just like those in the outer meniscus, also correspond to c-director deformations and to undulations of the smectic–air interface, as revealed by the small distortions of the interference fringes (Fig. 12c). A preliminary analysis indicates that the undulation amplitudes are very small, of the order of 20 nm,39 whereas the maximum height variation of the wedge reaches about 1.5 μm with respect to the film. Note the elongated shape of the smectic wedge around the ellipsoid. Similar features were observed with spheres, although the wedge is circular in this case. Actually, the particle shape alters both the meniscus shape and its profile. But a detailed analysis of that effect is not the main purpose of the present study and the results of a dedicated investigation will be reported elsewhere. Most importantly, we wish to stress that FCDs never appear in the wedge surrounding micrometer-sized colloidal particles, whether they are spheres or ellipsoids, and whatever the smectic phase. Actually, this is an important fact that will help us understand the mechanisms that drive the formation of these patterns, as discussed hereafter.
4 Discussion
In this section, we wish to provide some insight to tentatively explain the formation of the different structures that decorate the meniscus, essentially in the tilted SmC* phase. We start with the radial stripes before addressing the case of FCDs. The discussion ends with a few open conjectures.4.1 Radial structures
 , due to layer undulations, we consider a smectic monodomain in contact with a sinusoidal solid wall placed at z = 0 of amplitude u0 and wave vector q = 2π/λ, with qu0 ≪ 1. An approximate expression of
  reads (per unit length along y):3
 | (1) |
 is the smectic penetration length (of the order of the layer thickness a0). K and
 ![[B with combining macron]](https://www.rsc.org/images/entities/i_char_0042_0304.gif) are the curvature and compression modulus of the smectic layers, respectively. Minimizing eqn (1), with the boundary condition u(x, z = 0) = u0
are the curvature and compression modulus of the smectic layers, respectively. Minimizing eqn (1), with the boundary condition u(x, z = 0) = u0![[thin space (1/6-em)]](https://www.rsc.org/images/entities/char_2009.gif) cos
cos![[thin space (1/6-em)]](https://www.rsc.org/images/entities/char_2009.gif) qx, leads to the solution: u(x, z) = u0
qx, leads to the solution: u(x, z) = u0![[thin space (1/6-em)]](https://www.rsc.org/images/entities/char_2009.gif) cos
cos![[thin space (1/6-em)]](https://www.rsc.org/images/entities/char_2009.gif) qx
qx![[thin space (1/6-em)]](https://www.rsc.org/images/entities/char_2009.gif) e−z/ξ, where ξ = (Λq2)−1 ≃ 1.4 mm with λ = 10 μm and Λ = 20 Å. ξ is the characteristic penetration length of the perturbation in the bulk of the smectic sample and we see that it has a macroscopic value.1,3 Thus, bulk distortions must have an influence on the capillary properties of smectics as we shall see hereafter. Injecting the solution for u(x, z) in eqn (1) and integrating yields:
e−z/ξ, where ξ = (Λq2)−1 ≃ 1.4 mm with λ = 10 μm and Λ = 20 Å. ξ is the characteristic penetration length of the perturbation in the bulk of the smectic sample and we see that it has a macroscopic value.1,3 Thus, bulk distortions must have an influence on the capillary properties of smectics as we shall see hereafter. Injecting the solution for u(x, z) in eqn (1) and integrating yields:  .
.
Consider now an undulating SmA–air interface with an assumed sinusoidal profile, again of amplitude u0 and wave vector q. The cost in terms of surface energy may be approximately given by (still per unit length along y):1,3
 | (2) |
 . We see that the ratio
  is equal to a dimensionless number β = Λ
![[B with combining macron]](https://www.rsc.org/images/entities/i_char_0042_0304.gif) /γsa. Taking typical values, i.e. Λ = 20 Å,
/γsa. Taking typical values, i.e. Λ = 20 Å, ![[B with combining macron]](https://www.rsc.org/images/entities/i_char_0042_0304.gif) ∼ 107 J m−3 and γsa ∼ 2 × 10⁻² J m−2,1,27 we obtain β ∼ 1.40 Therefore, the surface energy is of the same order of magnitude as the bulk elastic energy, which means that layer undulations at the free surface certainly propagate into the bulk, and vice versa, layer undulations in the bulk extend all the way to the smectic–air interface. Consequently, the experimental radial stripes should correspond to both surface and bulk undulations of smectic layers.
∼ 107 J m−3 and γsa ∼ 2 × 10⁻² J m−2,1,27 we obtain β ∼ 1.40 Therefore, the surface energy is of the same order of magnitude as the bulk elastic energy, which means that layer undulations at the free surface certainly propagate into the bulk, and vice versa, layer undulations in the bulk extend all the way to the smectic–air interface. Consequently, the experimental radial stripes should correspond to both surface and bulk undulations of smectic layers.
It follows from the above considerations that undulations of smectic layers may be the source of c-director deformations, which can be easily visualized using a polarized optical microscope, as shown in Fig. 6b. With crossed polarizers, the film area (bottom left) appears completely dark, meaning that the c-director is aligned along one of the directions of the polarizers. However, broad and bright orange domains alternate with thin dark and blue lines in the meniscus. These domains reflect c-director distortions that bear some resemblance to the splay domains of the original Meyer's model10 (see also ref. 6 and 8).
In general, it is reasonable to expect the occurrence of c-director modulations, and therefore stripes, if the layers undulate.41 However, the reverse may not be necessarily true: the presence of c-director distortions (stripes) does not guarantee that the layers undulate. In fact, we spotted a few scarce, preliminary evidence of this phenomenon in our experiments.42 Thus, it is important to have in mind that some of the striped patterns reported so far in FSFs (see e.g.ref. 8 and 43, for a recent review) may actually correspond to c-director effects only, without involving layer deformations. The original splay domains evidenced by Meyer and Pershan more than 40 years ago10 might fall into this category. The subtle coupling between the c-director field and the layer distortions definitely calls for further dedicated investigations.
In the remainder of this section, we do not pretend to fully elucidate the physical origin of all kinds of meniscus stripes. We only focus on the possible origins of those stripes that are associated with layer deformations.
The above scenario is further supported by the early work of Ribotta and Durand.28 These authors investigated the influence of a molecular tilt on the undulation instability, especially in the close vicinity of the SmA–SmC transition. Although approximate, their theoretical analysis shows that the critical dilation necessary to trigger the undulation instability is significantly decreased if the molecular tilt is allowed. This is so because a finite molecular tilt systematically lowers the Frank distortion energy. Hence, the explanation is simple: the instability occurs only if it is energetically more favorable for the layers to undulate rather than being uniformly stretched. And since the Frank energy is relaxed by the molecular tilt, the instability threshold is lower.28 Noteworthily, the same authors verified this prediction experimentally using a smectic material confined between two glass substrates: as the SmC phase is approached from above, the temperature variation of the instability threshold decreases by almost a factor of 2.
At this point, we may state that the above interpretation is compatible with most of the observations reported so far: the undulation instability develops only in the SmC (SmC*) phase and for compounds that possess a SmA phase in their phase sequence. Furthermore, the chiral properties of the LC material do not matter.6
In fact, Rault showed that smectic layers are intrinsically dilated in the vicinity of edge dislocations.46,47 He proposed that such an internal dilative stress could be relaxed by a buckling of the layers in order to explain the periodic deformations of “oily streaks” in lamellar systems (smectic and cholesteric LCs). Thus, in our experiments, the undulation instability at TAC may preferentially start in the vicinity of edge dislocations, with a wave vector parallel to the dislocation lines, as described in ref. 46 and 47. Such a scenario, where the dislocations serve as nucleation sites for layer undulations, would provide a consistent explanation of the observations: it explains why the stripes have a radial symmetry (provided that the FSF was created with a circular geometry), or equivalently, why the undulation wave vector is perpendicular to the thickness gradient.
The “dislocation” scenario has the advantage of providing a generic interpretation of the observations, i.e. independently of the material physical constants (K and ![[B with combining macron]](https://www.rsc.org/images/entities/i_char_0042_0304.gif) ). Indeed, as pointed out in ref. 7, the striped texture has been observed independently by several groups, and with numerous different compounds in the SmC (SmC*) phase, thereby ruling out a possible material dependent-based origin of the phenomenon.
). Indeed, as pointed out in ref. 7, the striped texture has been observed independently by several groups, and with numerous different compounds in the SmC (SmC*) phase, thereby ruling out a possible material dependent-based origin of the phenomenon.
A possible link between dislocations and layer undulations may also be invoked to offer a different interpretation of the data in Fig. 6b and c. These data show that the wavelength of the undulation is an increasing function of the meniscus thickness. As aforesaid, this trend is expected by analogy to the simple planar case. However, unlike the planar geometry, the meniscus contains a much higher density of dislocations, which may play an essential role. The surmise consists in relating the undulation wave vector to the Burgers vectors of the numerous edge dislocations. In fact, this argument was first put forward by Rault who showed that, in the vicinity of a dislocation of Burgers vector b, layer dilation occurs over a length scale of order b (=|b|).46 And by analogy to the planar case,15,16 the undulation wave vector at the instability threshold, qc, may be given by: qc2Λb = Cte, where Λ is the smectic penetration length defined previously. Therefore, the larger b, the larger the period of undulations.
We may extrapolate the above reasoning to our experimental situation. The thickness increase in the meniscus is compensated by the insertion of new layers and the formation of edge dislocations. The thicker the meniscus, the higher the density of dislocations. However, dislocations are known to interact and group together to form large-b dislocations, which are more energetically favorable.1,3,27 Consequently, large-b (resp., low-b) dislocations are preferentially located in the thick (resp., thin) parts of the meniscus. Thus, provided that the undulation instability starts close to dislocations, as proposed above, large (resp., small) wavelength distortions are expected to arise from large-b (resp., low-b) dislocations. Although speculative, this interpretation might account for the data in Fig. 6c. In fact, a similar argument was proposed by Smalyukh et al. to tentatively explain the branching of striped domains in the meniscus of FSFs made from TGBA and UTGBC* LCs (see Fig. 7 in ref. 13).
The variations of λ versus the meniscus thickness may also be understood from a purely energetic viewpoint. As a first approximation, if we consider again the expression of the elastic energy,  , of a smectic A [eqn (1)], we see that, in terms of orders of magnitude, the curvature energy term can be written as uxx2 ∼ u02/λ4, where u0 is the undulation amplitude. Thus, we notice that long wavelength distortions should be favored in order to minimize
  as much as possible. Hence, for a given local thickness h, the system will tend to maximize λ. This trend, combined with the fact that there is no layer undulation in the film, might force the system to generate a hierarchical cascade of stripes with a varying periodicity. Actually, this phenomenon bears some analogy with instabilities unveiled in other systems, such as thin polymer films or membranes subjected to external constraints.48–52
Finally, we close this section with a few open issues concerning the ageing of the striped patterns in the meniscus. As aforementioned, the radial stripes are conserved as long as the film is stable. Some samples could be kept for several months, at constant temperature, without any apparent evolution. This is in fierce contrast to what is usually observed in a conventional sandwich cell, where the stripes eventually disappear via a dissipative process involving a plastic relaxation from the motion of dislocations.1,3 In the SmA phase, a rather high density of dislocations – with potentially large Burgers vectors – is already present in the meniscus. Most likely, these dislocations are located in the center of the sample since they are repelled from free surfaces.1 At the SmA–SmC (SmC*) transition, layer undulation takes place and creates a periodic stress field in the bulk. This stress field is expected to exert forces on the dislocations which should, therefore, move and redistribute in the meniscus provided they are not pinned. Such motions, if they occur, might be responsible for the branching of stripes, which are initially straight and thin at TAC over the whole meniscus (cf. Section 3.1.1 and Fig. 7). This scenario would be consistent with the fact that undulations may preferentially appear in the vicinity of dislocations: if the dislocations rearrange, so do the stripes. However, we have no proof to support this highly speculative statement. Reliable orders of magnitude of typical dislocation velocities or transit times are difficult to estimate. The situation is quite complicated because the force acting on different points of the same dislocation line changes periodically, resulting in a non-uniform propagation velocity. To our knowledge, we are not aware of any work dedicated to the dynamics of even a single dislocation in the presence of an undulation instability. The only (early) experiments that touched upon this problem are those due to Bartolino and Durand, who investigated the undulation instability in a wedge cell for several wedge angles, α.53 They showed that the instability threshold, δc (critical displacement of the upper plate), grows significantly in the large angle limit, i.e. when one enters the regime of high dislocation densities. This result still remains poorly understood today, but points to the undoubtedly important role of defects in relaxation mechanisms.
4.2 Focal conic domains
Here, we wish to discuss the possible mechanism that drives the formation of FCDs in the thickest parts of the meniscus. As aforementioned, this mechanism is likely to be very different from the one usually invoked to account for the existence of FCDs in confined geometries.29–38 In these works, the smectic LC is, on one side, in contact to a solid substrate, while the other side is open to the air. Usually, the solid substrate is chemically treated to impose planar boundary conditions of the LC molecules, whereas the smectic free surface generally insures a homeotropic anchoring. These hybrid, conflicting anchoring conditions are precisely responsible for the formation of FCDs. Indeed, their stability is dictated from a balance between the surface anchoring and elastic energies: FCDs will form if the surface anchoring energy gain at the substrate overcomes the elastic energy penalty associated with the distortions of the layers and defects.36 Note that only half domains are present in this case, with the ellipse of the FCD located on the substrate surface (see e.g.ref. 36). In the meniscus of FSFs, such hybrid boundary conditions do not exist since the LC is not in contact with a solid substrate, except at the outer border. Furthermore, in contrast to FCDs on solid substrates, full domains, and not just half ones, are present in FSFs with the ellipse located in the central plane of the meniscus.54,55 We have checked that, changing the anchoring conditions on the outer boundary wall has no influence on the existence of FCDs. Thus, boundary conditions are unlikely to explain the formation of FCDs in our experiments.In fact, it turns out that edge dislocations, again, may play a crucial role. To our knowledge, the existence of FCDs in FSFs was first mentioned by Proust and Perez,56 and more recently by Picano et al.27 and Kléman et al.54,55 In ref. 27, chains of FCDs are clearly visible in the thickest parts of the meniscus in a smectic A sample. Most importantly, the authors give also evidence of giant edge dislocations with large Burgers vectors located just before the FCD network. And it is known that giant edge dislocations become rapidly unstable with respect to the formation of FCDs, as mentioned in ref. 27, and demonstrated in ref. 57. In fact, edge dislocations are topologically equivalent to focal conics, i.e. dislocations can be transformed into focal conics and, vice versa, dislocations can emerge from FCDs.47,57,58 Consequently, following Picano et al.,27 it seems reasonable to think that the FCDs evidenced in our experiments (Fig. 1, 9 and 10) originate, at least partly, from giant dislocations, which are certainly present in the thickest parts of the meniscus.
But very interestingly, Lavrentovich et al. also showed that layer undulations could catalyze the nucleation of FCDs in the bulk.59 More generally, their theory predicts that it is easier to generate FCDs out of a distorted state – due to e.g. dislocations, layer undulations, or small dust particles – rather than out of an ideally uniform state. Our observations directly support this scenario: both giant dislocations and layer undulations are present in the meniscus, and possibly serve as sources for the nucleation of FCDs.57,59 The latter phenomenon is particularly well illustrated in Fig. 1 and 9: indeed, small FCDs preferentially nucleate on thick stripes, prior to forming a more ordered array composed of larger domains (cf. Section 3.1.2). Upon heating well above TAC, the small FCDs disappear along with the stripes, but the larger FCDs remain, certainly because of the dislocations. This argument explains why FCDs are always present in the thick regions of the meniscus, whatever the smectic phase (SmA, SmC or SmC*).
Further considerations reinforce the previous scenario. In Section 3.1.2, we mentioned that FCDs appear at a well-defined distance from the film. This observation fits very well with the fact that giant dislocations only form in thick enough regions of the meniscus, i.e. at a precise distance from the film that depends on the radius of curvature.1,27 As a first approximation, we may use the model of ref. 27 to provide a rough estimate of the minimum distance from the film, Lmin, at which giant dislocations are expected to appear in the meniscus. Taking R ≃ 500 μm (cf. Section 3.1.1), we find Lmin ≈ 50 μm, which appears consistent with most of our observations, since the distance at which FCDs typically nucleate is (50–100) μm from the film (see e.g.Fig. 1).
The previous argument also explains why FCDs are usually not observed in the wedge around small, micrometer-sized, colloidal inclusions (Fig. 12): the meniscus thickness is not large enough for giant dislocations to develop, and FCDs cannot nucleate, despite the presence of small stripes. A few tests performed with rather large polystyrene particles (diameter ≳40 μm, data not shown) revealed the presence of FCDs in the thickest parts of the wedge, as in ref. 8 (see Fig. 8a therein), which is in line with the above statement.
5 Summary and prospects
In this work, we have reported a detailed experimental study of the structures that decorate the meniscus of free-standing smectic films. The structures only appear in areas where thickness gradients exist, including the wedge surrounding colloidal particles trapped in the film, and are absent in flat zones. They consist of radial stripes in the thin parts (SmC or SmC* phase only) followed by an ordered array of focal conic domains in thicker regions (SmC, SmC* and SmA phases). Using optical microscopy and phase shifting interferometry, we confirmed that the former correspond to undulations of smectic layers and showed that the latter exhibit an “egg-box” like and bumpy profile with dimple amplitudes exceeding 200 nm. For both types of textures, the characteristic domain size grows as the meniscus thickens. Using reasonable arguments based on well-established literature results, we suggested that the dislocations, which are ubiquitous in the meniscus, play an essential role in the occurrence of these patterns. In particular, the focal conic domains do not arise from anchoring effects, as in confined geometries with solid boundaries, but rather from unstable giant dislocations encountered in sufficiently thick regions. However, further investigations are still required to (i) explain the persistence of the striped patterns over very long time scales (some samples could be kept for more than a year), and (ii) achieve a better understanding of the coupling between the deformations of the layers and the modulations of the c-director field in the radial wrinkles. As aforementioned (cf. Section 4.1), we have a few pieces of evidence of the presence of striped domains without undulations of the smectic free surface. These observations are still unclear to us. Theoretical work is also missing on that particular issue. Some attempts were made a while ago, but in the absence of free surfaces and thickness gradients.28,41Concerning future work, we think that the behavior of solid inclusions embedded in FSFs is definitely an interesting problem to explore. The case of endogenic liquid inclusions is already very well documented,4 but here, both director field and interfacial deformations take place around the trapped colloids, resulting in elasto-capillary interactions on which very little is known. Understanding these interactions, and their self-assembly properties, hinges on a careful examination of the meniscus profile and the accompanying elastic distortions. Also, drag forces are unknown for particles straddling the smectic free surface whilst being dressed with a decorated meniscus. These studies could then be extended to quantify the 2D diffusion of particles of arbitrary shapes, as was done recently with smectic islands and microspheres.60,61 Such problems bear a direct interest in Biology, where it is of paramount importance to gain knowledge on the diffusion of a variety of species (e.g. macromolecules, lipid rafts) inside, and through, the cellular membrane.62,63
Acknowledgements
We acknowledge financial support from a joint research fellowship between the EU and the University of Tunis El Manar (Erasmus Mundus EU-METALIC II Cardiff Metropolitan University). We thank the instrumentation team and the mechanics shop of the laboratory for their valuable help and continuous technical assistance.References
- P. Oswald and P. Pieranski, Smectic and Columnar Liquid Crystals: Concepts and Physical Properties illustrated by Experiments, Taylor & Francis, Boca Raton, 2005 Search PubMed.
- T. Stoebe, P. Mach and C. C. Huang, Unusual layer-thinning transition observed near the Smectic-A-Isotropic transition in free-standing liquid-crystal films, Phys. Rev. Lett., 1994, 73, 1384–1387 CrossRef CAS PubMed.
- P. G. De Gennes and J. Prost, The Physics of Liquid Crystals, Clarendon Press, Oxford, 1993 Search PubMed.
- C. Bohley and R. Stannarius, Inclusions in free standing smectic liquid crystal films, Soft Matter, 2008, 4, 683–702 RSC.
- P. V. Dolganov and P. Cluzeau, Influence of chirality on director configuration and droplet interaction in ferroelectric free-standing films, Phys. Rev. E: Stat., Nonlinear, Soft Matter Phys., 2008, 78, 021701 CrossRef CAS PubMed.
- K. Harth and R. Stannarius, Corona patterns around inclusions in freely suspended smectic films, Eur. Phys. J. E: Soft Matter Biol. Phys., 2009, 28, 265–272 CrossRef CAS PubMed.
- K. Harth, B. Schulz, C. Bahr and R. Stannarius, Atomic force microscopy of menisci of free-standing smectic films, Soft Matter, 2011, 7, 7103–7111 RSC.
- K. Harth, A. Eremin and R. Stannarius, A Gallery of Meniscus Patterns of Free-Standing Smectic Films, Ferroelectrics, 2012, 431, 59–73 CrossRef CAS.
- J. C. Loudet, P. V. Dolganov, P. Patrício, H. Saadaoui and P. Cluzeau, Undulation instabilities in the meniscus of smectic membranes, Phys. Rev. Lett., 2011, 106, 117802 CrossRef CAS PubMed.
- R. B. Meyer and P. S. Pershan, Surface polarity induced domains in liquid crystals, Solid State Commun., 1973, 13, 989–992 CrossRef.
- J. Maclennan, Spontaneous director rotation in freely suspended ferroelectric liquid-crystal films, EPL, 1990, 13(5), 435–440 CrossRef CAS.
- S. Dhara, R. Pratibha and N. V. Madhusudana, Some experimental investigations on type II chiral liquid crystals, Ferroelectrics, 2002, 277, 13–23 CrossRef CAS.
- I. I. Smalyukh, R. Pratibha, O. D. Lavrentovich and N. V. Madhusudana, Free-standing films of twist grain boundary TGBA and UTGBC* liquid crystals studied by fluorescence confocal polarizing microscopy, Liq. Cryst., 2003, 30(8), 877–888 CrossRef CAS.
- M. Conradi, P. Ziherl, A. Šarlah and I. Muševič, Colloids on free-standing smectic films, Eur. Phys. J. E: Soft Matter Biol. Phys., 2006, 20, 231–236 CrossRef CAS PubMed.
- M. Delaye, R. Ribotta and G. Durand, Buckling instability of the layers in a smectic-A liquid crystal, Phys. Lett., 1973, 44A, 139–140 CrossRef.
- N. A. Clark and R. B. Meyer, Strain-induced instability of monodomain smectic A and cholesteric liquid crystals, Appl. Phys. Lett., 1973, 22, 493–494 CrossRef CAS.
- I. I. Smalyukh, S. Chernyshuk, B. I. Lev, A. B. Nych, U. Ognysta, V. G. Nazarenko and O. D. Lavrentovich, Ordered droplet structures at the liquid crystal surface and elastic-capillary interactions, Phys. Rev. Lett., 2004, 93, 117801 CrossRef CAS PubMed.
- A. B. Nych, U. M. Ognysta, V. M. Pergamenshchik, B. I. Lev, V. G. Nazarenko, I. Muševič, M. Škarabot and O. D. Lavrentovich, Coexistence of two colloidal crystals at the nematic liquid crystal–air interface, Phys. Rev. Lett., 2007, 98, 057801 CrossRef CAS PubMed.
- M. Oettel, A. Doímnguez, M. Tasinkevych and S. Dietrich, Effective interactions of colloids on nematic films, Eur. Phys. J. E: Soft Matter Biol. Phys., 2009, 28, 99–111 CrossRef CAS PubMed.
- M. A. Gharbi, D. Seč, T. Lopez-Leon, M. Nobili, M. Ravnik, S. Žumer and C. Blanc, Microparticles confined to a nematic liquid crystal shell, Soft Matter, 2013, 9, 6911–6920 RSC.
- P. V. Dolganov, H. T. Nguyen, G. Joly, E. I. Kats, V. K. Dolganov and P. Cluzeau, Stability of a free-standing liquid-crystal film: the measurement of the interaction between the film surfaces, JETP Lett., 2007, 105, 665–672 CrossRef CAS.
- J. A. Champion, Y. K. Katare and S. Mitragotri, Making polymeric micro- and nanoparticles of complex shapes, Proc. Natl. Acad. Sci. U. S. A., 2007, 104, 11901–11904 CrossRef CAS PubMed.
- B. M. Mihiretie, P. Snabre, J. C. Loudet and B. Pouligny, Optically driven oscillations of ellipsoidal particles. Part I: experimental observations, Eur. Phys. J. E: Soft Matter Biol. Phys., 2014, 37, 124 CrossRef CAS PubMed.
- A. Harasaki, J. Schmitt and J. C. Wyant, Improved vertical-scanning interferometry, Appl. Opt., 2000, 39, 2107–2115 CrossRef CAS PubMed.
- J. C. Loudet, A. G. Yodh and B. Pouligny, Wetting and contact lines of micrometer-sized ellipsoids, Phys. Rev. Lett., 2006, 97, 018304 CrossRef CAS PubMed.
- J. C. Géminard, R. Holyst and P. Oswald, Meniscus and dislocations in free-standing films of smectic-A liquid crystals, Phys. Rev. Lett., 1997, 78, 1924–1927 CrossRef.
- F. Picano, R. Holyst and P. Oswald, Coupling between meniscus and smectic-A films: circular and catenoid profiles, induced stress, and dislocation dynamics, Phys. Rev. E: Stat. Phys., Plasmas, Fluids, Relat. Interdiscip. Top., 2000, 62, 3747–3757 CrossRef CAS.
- R. Ribotta and G. Durand, Mechanical instabilities of smectic-A liquid crystals under dilative or compressive stresses, J. Phys., 1977, 38, 179–204 CAS.
- Y. H. Kim, D. K. Yoon, H. S. Jeong, O. D. Lavrentovich and H. T. Tung, Smectic liquid crystal defects for self-assembling of building blocks and their lithographic applications, Adv. Funct. Mater., 2011, 21, 610–627 CrossRef CAS.
- D. A. Beller, M. A. Gharbi, A. Honglawan, K. J. Stebe, S. Yang and R. D. Kamien, Focal conic flower textures at curved interfaces, Phys. Rev. X, 2013, 3, 041026 Search PubMed.
- F. Serra, M. A. Gharbi, Y. Luo, I. B. Liu, N. D. Bade, R. D. Kamien, S. Yang and K. J. Stebe, Curvature-driven, one-step assembly of reconfigurable smectic liquid crystal “compound eye” lenses, Adv. Opt. Mater., 2015, 3(9), 1287–1292 CrossRef CAS.
- M. A. Gharbi, I. B. Liu, Y. Luo, F. Serra, N. D. Bade, H. N. Kim, Y. Xia, R. D. Kamien, S. Yang and K. J. Stebe, Smectic gardening on curved landscapes, Langmuir, 2015, 31, 11135–11142 CrossRef CAS PubMed.
- M. C. Choi, T. Pfohl, Z. Wen, Y. Li, M. W. Kim, J. N. Israelachvili and C. R. Safinya, Ordered patterns of liquid crystal toroidal defects by microchannel confinement, Proc. Natl. Acad. Sci. U. S. A., 2004, 101, 17340–17344 CrossRef CAS PubMed.
- V. Designolle, S. Herminghaus, T. Pfohl and C. Bahr, AFM study of defect-induced depressions of the smectic-A/air interface, Langmuir, 2006, 22, 363–368 CrossRef CAS PubMed.
- W. Guo, S. Herminghaus and C. Bahr, Controlling smectic focal conic domains by substrate patterning, Langmuir, 2008, 24, 8174–8180 CrossRef CAS PubMed.
- Y. H. Kim, D. K. Yoon, M. C. Choi, H. S. Jeong, M. W. Kim, O. D. Lavrentovich and H. T. Tung, Confined self-assembly of Toric Focal Conic Domains (the effects of confined geometry on the feature size of Toric Focal Conic Domains), Langmuir, 2009, 25, 1685–1691 CrossRef CAS PubMed.
- B. Zappone, E. Lacaze, H. Hayeb, M. Goldmann, N. Boudet, P. Barois and M. Alba, Self-ordered arrays of linear defects and virtual singularities in thin smectic-A films, Soft Matter, 2011, 7, 1161–1167 RSC.
- A. Honglawan, D. A. Beller, M. Cavallaro, R. D. Kamien, K. J. Stebe and S. Yang, Topographically induced hierarchical assembly and geometrical transformation of focal conic domain arrays in smectic liquid crystals, Proc. Natl. Acad. Sci. U. S. A., 2013, 110, 34–39 CrossRef CAS PubMed.
- In a standard PSI analysis, we only account for interferences between the reference wave and light reflected off the top smectic–air interface. This is well suited for the characterization of the outer meniscus, whose total optical thickness is larger than the coherence length of our source. In this way, reflections coming the bottom smectic–air interface do not superimpose on the primary interferences of interest. However this condition is no longer fulfilled in the flat film region and in the small wedge around the colloidal particles. Both smectic–air interfaces contribute to the interference signal and a more careful interferogram analysis must be performed in order to accurately recover the wedge profile. Even further complications arise from light reflected from particle–air and particle–smectic interfaces. An improved algorithm analysis is currently in progress.
- For these order-of-magnitude estimates, we employed the typical values of the elastic modulus found in the literature for SmA phases, since we used the elastic energy of a SmA phase. It is worth noting that the values of the layer elastic moduli may change in SmC phases, even though there does not seem to be a general clear-cut trend. Indeed, the theoretical study of Johnson and Saupe (ref. 41) suggests that the layer elastic modulus, B, is smaller in the SmC phase than in the SmA phase. But measurements reveal that B can increase as well in the SmC phase [see e.g. S. Shibahara, et al., Phy. Rev. Lett., 2000, 85, 1670 or D. Rogez, et al., Eur. Phys. J. E, 2005, 16, 193]. More reliable, quantitative estimates are system-dependent, and require precise measurements of the involved physical parameters.
- D. Johnson and A. Saupe, Undulation instabilities in smectic C phases, Phys. Rev. A: At., Mol., Opt. Phys., 1977, 15, 2079–2085 CrossRef CAS.
- Unpublished results.
- R. Stannarius, A. Eremin and K. Harth, Stripe instabilities in menisci of free-standing smectic films with a direct transition from smectic C to an isotropic or nematic phase, Liq. Cryst., 2017 DOI:10.1080/02678292.2017.1290290.
- R. Ribotta, Instabilités mécaniques et thermo-mécaniques dans les cristaux liquides smectiques, J. Phys., Colloq., 1976, 37, 7–8 Search PubMed.
- J. M. Delrieu, Comparison between square, triangular, or one dimensional lattice of distortions in smectic A and cholesteric crystals for superposed strain and magnetic field of any directions, J. Chem. Phys., 1974, 60, 1081–1086 CrossRef CAS.
- J. Rault, Interpretation of oily streaks in liquid crystals, C. R. Acad. Sc. Paris B series, 1975, 280, 417–421 Search PubMed.
- J. Rault, Nucleation of the focal conic texture in lamellar liquid crystals, Philos. Mag., 1976, 34(5), 753–765 CrossRef CAS.
- E. Cerda and L. Mahadevan, Geometry and Physics of wrinkling, Phys. Rev. Lett., 2003, 90, 074302 CrossRef CAS PubMed.
- J. C. Géminard, R. Bernal and F. Melo, Wrinkle formations in axi-symmetrically stretched membranes, Eur. Phys. J. E: Soft Matter Biol. Phys., 2004, 15, 117–126 CrossRef PubMed.
- J. Huang, M. Juszkiewicz, W. H. de Jeu, E. Cerda, T. Emrick, N. Menon and T. P. Russell, Capillary wrinkling of floating thin polymer films, Science, 2007, 317, 650–653 CrossRef CAS PubMed.
- J. Huang, B. Davidovitch, C. D. Santangelo, T. P. Russell and N. Menon, Smooth Cascade of wrinkles at the edge of a floating elastic film, Phys. Rev. Lett., 2010, 105, 038302 CrossRef PubMed.
- H. Vandeparre, M. Piñeirua, F. Brau, B. Roman, J. Bico, C. Gay, W. Bao, C. N. Lau, P. M. Reis and P. Damman, Wrinkling hierarchy in constrained thin sheets from suspended graphene to curtains, Phys. Rev. Lett., 2011, 106, 224301 CrossRef PubMed.
- R. Bartolino and G. Durand, Dislocation effects on the viscoelastic properties of a smectic-A liquid crystal, Mol. Cryst. Liq. Cryst., 1977, 40, 117–132 CrossRef CAS.
- M. Kléman, C. Meyer and Y. A. Nastishin, Imperfections in focal conic domains: the role of dislocations, Philos. Mag., 2006, 86, 4439–4458 CrossRef.
- Y. A. Nastishin, C. Meyer and M. Kléman, Imperfect focal conic domains in A smectics: a textural analysis, Liq. Cryst., 2008, 35, 609–624 CrossRef CAS.
- J. E. Proust and E. Perez, Films minces smectiques symétriques et asymétriques, J. Phys., Lett., 1977, 38, L-91–L-94 CrossRef.
- P. Boltenhagen, O. D. Lavrentovich and M. Kleman, Oily streaks and focal conic domains in Lα lyotropic liquid crystals, J. Phys. II, 1991, 1, 1233–1252 CrossRef CAS.
- C. E. Williams and M. Kléman, Dislocations, grain boundaries and focal conics in smectics A, J. Phys., Colloq., 1975, 36, 315–320 CrossRef.
- O. D. Lavrentovich, M. Kléman and V. M. Pergamenshchik, Nucleation of focal conic domains in smectic A liquid crystals, J. Phys. II, 1994, 4, 377–404 CrossRef.
- Z. H. Nguyen, M. Atkinson, C. S. Park, J. E. Maclennan, M. A. Glaser and N. A. Clark, Crossover between 2D and 3D fluid dynamics in the diffusion of islands in ultrathin freely suspended smectic films, Phys. Rev. Lett., 2010, 105, 268304 CrossRef PubMed.
- A. Eremin, S. Baumgarten, K. Harth, R. Stannarius, Z. H. Nguyen, A. Goldfain, C. S. Park, J. E. Maclennan, M. A. Glaser and N. A. Clark, Two-dimensional microrheology of freely suspended liquid crystal films, Phys. Rev. Lett., 2011, 107, 268301 CrossRef CAS PubMed.
- K. Simons and I. Ikonen, Functional rafts in cell membranes, Nature, 1997, 387, 569–572 CrossRef CAS PubMed.
- P. Cicuta, S. L. Keller and S. L. Veatch, Diffusion of liquid domains in lipid bilayer membranes, J. Phys. Chem. B, 2007, 111, 3328–3331 CrossRef CAS PubMed.
| This journal is © The Royal Society of Chemistry 2017 |


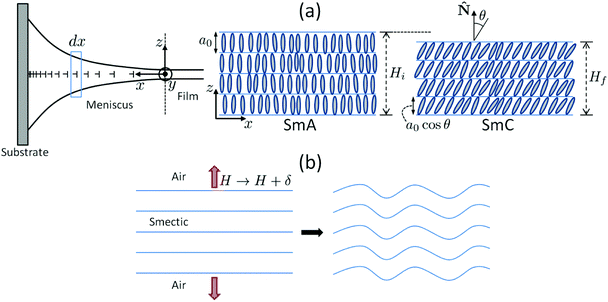
![[N with combining circumflex]](https://www.rsc.org/images/entities/char_004e_0302.gif) . At left, the nails symbolize edge dislocations in the meniscus. (b) The resulting mechanical stress is equivalent to a dilation (red arrows) if we assume a constant layer number; the dilative stress then triggers layer undulations (see the text for details).
. At left, the nails symbolize edge dislocations in the meniscus. (b) The resulting mechanical stress is equivalent to a dilation (red arrows) if we assume a constant layer number; the dilative stress then triggers layer undulations (see the text for details).